Free Statistics

of Irreproducible Research!

Author's title

Author*The author of this computation has been verified*
R Software Modulerwasp_autocorrelation.wasp
Title produced by software(Partial) Autocorrelation Function
Date of computationSun, 10 Dec 2017 13:33:51 +0100
Cite this page as followsStatistical Computations at FreeStatistics.org, Office for Research Development and Education, URL https://freestatistics.org/blog/index.php?v=date/2017/Dec/10/t15129093934xzi5egscnpv0hf.htm/, Retrieved Wed, 15 May 2024 05:07:38 +0000
Statistical Computations at FreeStatistics.org, Office for Research Development and Education, URL https://freestatistics.org/blog/index.php?pk=308908, Retrieved Wed, 15 May 2024 05:07:38 +0000
QR Codes:

Original text written by user:
IsPrivate?No (this computation is public)
User-defined keywords
Estimated Impact83
Family? (F = Feedback message, R = changed R code, M = changed R Module, P = changed Parameters, D = changed Data)
-       [(Partial) Autocorrelation Function] [] [2017-12-10 12:33:51] [ca643b0c409f93e6a7ce1fd0961340ec] [Current]
Feedback Forum

Post a new message
Dataseries X:
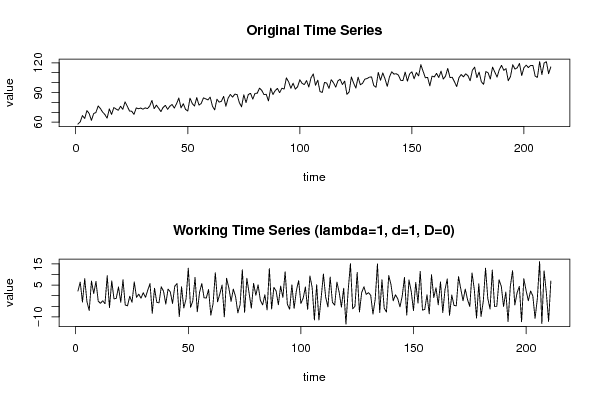
58.1
60.3
66.7
63.7
71.7
68.8
61.8
68.7
69.7
76.4
73.8
70.2
67.8
64
73.4
67.8
74.8
73.3
72
76.1
73
80.5
76.1
71.3
71
67.9
74.4
73.6
74.3
73.1
74.5
73.7
76.3
82
73.7
77.2
74.1
70.7
74.9
77
73
76.1
77.9
74.2
78.7
84.4
74.5
78.7
72.9
71.3
84.3
78.8
76.3
84.9
77.3
78.9
84.6
83.6
82.5
85.4
76.2
72.4
83.2
80.3
81.1
86.1
76.1
84.3
88
85.3
88.4
87.9
79.8
75.5
87.7
79.8
88
89.2
83.3
89.1
89.3
94.4
92.2
87.8
88.2
81.5
94.3
88
91.9
94.1
89.8
94.3
93.5
104.8
100.7
94.3
99.4
93.4
95.8
102.9
99.2
98
102.1
95.6
104.9
108.8
97.3
102.5
91
90
100.2
99.5
94.2
103
99.9
95.4
101.8
103.4
98
101.5
88.1
90.6
105.7
99.5
94.5
105.5
97.8
99.3
103.5
104.1
105.5
105.7
97
95.3
110.3
102.3
109.8
103.9
96.2
105.7
111
108.6
109
107.6
102.3
102.1
110.7
101.5
108.9
110.9
103.9
110.2
106.7
118.2
111.4
104.9
105.3
96.7
106.6
105.7
109.4
105.1
111.6
103.6
106.5
114.4
105.1
105.4
100.8
96
105
108.2
105.8
108.9
107
101.9
112.6
115.6
105
110.6
100.8
98.2
111.2
109.9
103.6
115.7
110.6
105.6
113.1
117.5
112.4
114.1
101.9
106.3
118.1
113.7
115
119.4
107.1
115.1
117.6
115.2
117.4
117.3
106.6
105.2
121.3
108.1
119.8
121.2
109
115.9


Summary of computational transaction
Raw Input view raw input (R code)
Raw Outputview raw output of R engine
Computing time2 seconds
R ServerBig Analytics Cloud Computing Center

\begin{tabular}{lllllllll}
\hline
Summary of computational transaction \tabularnewline
Raw Input view raw input (R code)  \tabularnewline
Raw Outputview raw output of R engine  \tabularnewline
Computing time2 seconds \tabularnewline
R ServerBig Analytics Cloud Computing Center \tabularnewline
\hline
\end{tabular}
%Source: https://freestatistics.org/blog/index.php?pk=308908&T=0

[TABLE]
[ROW]
Summary of computational transaction[/C][/ROW] [ROW]Raw Input[/C] view raw input (R code) [/C][/ROW] [ROW]Raw Output[/C]view raw output of R engine [/C][/ROW] [ROW]Computing time[/C]2 seconds[/C][/ROW] [ROW]R Server[/C]Big Analytics Cloud Computing Center[/C][/ROW] [/TABLE] Source: https://freestatistics.org/blog/index.php?pk=308908&T=0

Globally Unique Identifier (entire table): ba.freestatistics.org/blog/index.php?pk=308908&T=0

As an alternative you can also use a QR Code:  

The GUIDs for individual cells are displayed in the table below:

Summary of computational transaction
Raw Input view raw input (R code)
Raw Outputview raw output of R engine
Computing time2 seconds
R ServerBig Analytics Cloud Computing Center


Autocorrelation Function
Time lag kACF(k)T-STATP-value
1-0.433133-6.29160
2-0.157836-2.29270.011425
30.3294334.78532e-06
4-0.431598-6.26930
50.0755281.09710.136924
60.3236494.70132e-06
7-0.147699-2.14550.016529
8-0.177737-2.58180.005253
90.2665473.87187.2e-05
10-0.331436-4.81441e-06
11-0.039255-0.57020.28457
120.5715868.30280
13-0.369798-5.37160
140.1060091.53990.062544
150.0850841.23590.108932
16-0.425691-6.18350
170.2553813.70960.000133
180.1589872.30940.010944
19-0.164271-2.38620.008954
200.0324640.47160.318862
210.0273450.39720.345805
22-0.296208-4.30271.3e-05
230.207543.01470.001444
240.2197593.19220.000814
25-0.19462-2.8270.002575
260.1632082.37070.009327
27-0.122833-1.78430.03791
28-0.203677-2.95860.001722
290.2203013.20010.000793
30-0.036671-0.53270.297411
310.0541680.78680.21613
32-0.007473-0.10850.456831
33-0.132981-1.93170.02737
34-0.034008-0.4940.310913
350.0455090.66110.254647
360.121631.76680.039355
370.1024681.48840.069065
38-0.097942-1.42270.078152
39-0.096133-1.39640.082028
40-0.022428-0.32580.372454
410.0456190.66270.254138
42-0.023727-0.34470.365348
430.2047532.97420.00164
44-0.186187-2.70450.003699
45-0.104518-1.51820.065228
460.1536772.23230.013323
47-0.206723-3.00280.001499
480.2640273.83528.3e-05

\begin{tabular}{lllllllll}
\hline
Autocorrelation Function \tabularnewline
Time lag k & ACF(k) & T-STAT & P-value \tabularnewline
1 & -0.433133 & -6.2916 & 0 \tabularnewline
2 & -0.157836 & -2.2927 & 0.011425 \tabularnewline
3 & 0.329433 & 4.7853 & 2e-06 \tabularnewline
4 & -0.431598 & -6.2693 & 0 \tabularnewline
5 & 0.075528 & 1.0971 & 0.136924 \tabularnewline
6 & 0.323649 & 4.7013 & 2e-06 \tabularnewline
7 & -0.147699 & -2.1455 & 0.016529 \tabularnewline
8 & -0.177737 & -2.5818 & 0.005253 \tabularnewline
9 & 0.266547 & 3.8718 & 7.2e-05 \tabularnewline
10 & -0.331436 & -4.8144 & 1e-06 \tabularnewline
11 & -0.039255 & -0.5702 & 0.28457 \tabularnewline
12 & 0.571586 & 8.3028 & 0 \tabularnewline
13 & -0.369798 & -5.3716 & 0 \tabularnewline
14 & 0.106009 & 1.5399 & 0.062544 \tabularnewline
15 & 0.085084 & 1.2359 & 0.108932 \tabularnewline
16 & -0.425691 & -6.1835 & 0 \tabularnewline
17 & 0.255381 & 3.7096 & 0.000133 \tabularnewline
18 & 0.158987 & 2.3094 & 0.010944 \tabularnewline
19 & -0.164271 & -2.3862 & 0.008954 \tabularnewline
20 & 0.032464 & 0.4716 & 0.318862 \tabularnewline
21 & 0.027345 & 0.3972 & 0.345805 \tabularnewline
22 & -0.296208 & -4.3027 & 1.3e-05 \tabularnewline
23 & 0.20754 & 3.0147 & 0.001444 \tabularnewline
24 & 0.219759 & 3.1922 & 0.000814 \tabularnewline
25 & -0.19462 & -2.827 & 0.002575 \tabularnewline
26 & 0.163208 & 2.3707 & 0.009327 \tabularnewline
27 & -0.122833 & -1.7843 & 0.03791 \tabularnewline
28 & -0.203677 & -2.9586 & 0.001722 \tabularnewline
29 & 0.220301 & 3.2001 & 0.000793 \tabularnewline
30 & -0.036671 & -0.5327 & 0.297411 \tabularnewline
31 & 0.054168 & 0.7868 & 0.21613 \tabularnewline
32 & -0.007473 & -0.1085 & 0.456831 \tabularnewline
33 & -0.132981 & -1.9317 & 0.02737 \tabularnewline
34 & -0.034008 & -0.494 & 0.310913 \tabularnewline
35 & 0.045509 & 0.6611 & 0.254647 \tabularnewline
36 & 0.12163 & 1.7668 & 0.039355 \tabularnewline
37 & 0.102468 & 1.4884 & 0.069065 \tabularnewline
38 & -0.097942 & -1.4227 & 0.078152 \tabularnewline
39 & -0.096133 & -1.3964 & 0.082028 \tabularnewline
40 & -0.022428 & -0.3258 & 0.372454 \tabularnewline
41 & 0.045619 & 0.6627 & 0.254138 \tabularnewline
42 & -0.023727 & -0.3447 & 0.365348 \tabularnewline
43 & 0.204753 & 2.9742 & 0.00164 \tabularnewline
44 & -0.186187 & -2.7045 & 0.003699 \tabularnewline
45 & -0.104518 & -1.5182 & 0.065228 \tabularnewline
46 & 0.153677 & 2.2323 & 0.013323 \tabularnewline
47 & -0.206723 & -3.0028 & 0.001499 \tabularnewline
48 & 0.264027 & 3.8352 & 8.3e-05 \tabularnewline
\hline
\end{tabular}
%Source: https://freestatistics.org/blog/index.php?pk=308908&T=1

[TABLE]
[ROW][C]Autocorrelation Function[/C][/ROW]
[ROW][C]Time lag k[/C][C]ACF(k)[/C][C]T-STAT[/C][C]P-value[/C][/ROW]
[ROW][C]1[/C][C]-0.433133[/C][C]-6.2916[/C][C]0[/C][/ROW]
[ROW][C]2[/C][C]-0.157836[/C][C]-2.2927[/C][C]0.011425[/C][/ROW]
[ROW][C]3[/C][C]0.329433[/C][C]4.7853[/C][C]2e-06[/C][/ROW]
[ROW][C]4[/C][C]-0.431598[/C][C]-6.2693[/C][C]0[/C][/ROW]
[ROW][C]5[/C][C]0.075528[/C][C]1.0971[/C][C]0.136924[/C][/ROW]
[ROW][C]6[/C][C]0.323649[/C][C]4.7013[/C][C]2e-06[/C][/ROW]
[ROW][C]7[/C][C]-0.147699[/C][C]-2.1455[/C][C]0.016529[/C][/ROW]
[ROW][C]8[/C][C]-0.177737[/C][C]-2.5818[/C][C]0.005253[/C][/ROW]
[ROW][C]9[/C][C]0.266547[/C][C]3.8718[/C][C]7.2e-05[/C][/ROW]
[ROW][C]10[/C][C]-0.331436[/C][C]-4.8144[/C][C]1e-06[/C][/ROW]
[ROW][C]11[/C][C]-0.039255[/C][C]-0.5702[/C][C]0.28457[/C][/ROW]
[ROW][C]12[/C][C]0.571586[/C][C]8.3028[/C][C]0[/C][/ROW]
[ROW][C]13[/C][C]-0.369798[/C][C]-5.3716[/C][C]0[/C][/ROW]
[ROW][C]14[/C][C]0.106009[/C][C]1.5399[/C][C]0.062544[/C][/ROW]
[ROW][C]15[/C][C]0.085084[/C][C]1.2359[/C][C]0.108932[/C][/ROW]
[ROW][C]16[/C][C]-0.425691[/C][C]-6.1835[/C][C]0[/C][/ROW]
[ROW][C]17[/C][C]0.255381[/C][C]3.7096[/C][C]0.000133[/C][/ROW]
[ROW][C]18[/C][C]0.158987[/C][C]2.3094[/C][C]0.010944[/C][/ROW]
[ROW][C]19[/C][C]-0.164271[/C][C]-2.3862[/C][C]0.008954[/C][/ROW]
[ROW][C]20[/C][C]0.032464[/C][C]0.4716[/C][C]0.318862[/C][/ROW]
[ROW][C]21[/C][C]0.027345[/C][C]0.3972[/C][C]0.345805[/C][/ROW]
[ROW][C]22[/C][C]-0.296208[/C][C]-4.3027[/C][C]1.3e-05[/C][/ROW]
[ROW][C]23[/C][C]0.20754[/C][C]3.0147[/C][C]0.001444[/C][/ROW]
[ROW][C]24[/C][C]0.219759[/C][C]3.1922[/C][C]0.000814[/C][/ROW]
[ROW][C]25[/C][C]-0.19462[/C][C]-2.827[/C][C]0.002575[/C][/ROW]
[ROW][C]26[/C][C]0.163208[/C][C]2.3707[/C][C]0.009327[/C][/ROW]
[ROW][C]27[/C][C]-0.122833[/C][C]-1.7843[/C][C]0.03791[/C][/ROW]
[ROW][C]28[/C][C]-0.203677[/C][C]-2.9586[/C][C]0.001722[/C][/ROW]
[ROW][C]29[/C][C]0.220301[/C][C]3.2001[/C][C]0.000793[/C][/ROW]
[ROW][C]30[/C][C]-0.036671[/C][C]-0.5327[/C][C]0.297411[/C][/ROW]
[ROW][C]31[/C][C]0.054168[/C][C]0.7868[/C][C]0.21613[/C][/ROW]
[ROW][C]32[/C][C]-0.007473[/C][C]-0.1085[/C][C]0.456831[/C][/ROW]
[ROW][C]33[/C][C]-0.132981[/C][C]-1.9317[/C][C]0.02737[/C][/ROW]
[ROW][C]34[/C][C]-0.034008[/C][C]-0.494[/C][C]0.310913[/C][/ROW]
[ROW][C]35[/C][C]0.045509[/C][C]0.6611[/C][C]0.254647[/C][/ROW]
[ROW][C]36[/C][C]0.12163[/C][C]1.7668[/C][C]0.039355[/C][/ROW]
[ROW][C]37[/C][C]0.102468[/C][C]1.4884[/C][C]0.069065[/C][/ROW]
[ROW][C]38[/C][C]-0.097942[/C][C]-1.4227[/C][C]0.078152[/C][/ROW]
[ROW][C]39[/C][C]-0.096133[/C][C]-1.3964[/C][C]0.082028[/C][/ROW]
[ROW][C]40[/C][C]-0.022428[/C][C]-0.3258[/C][C]0.372454[/C][/ROW]
[ROW][C]41[/C][C]0.045619[/C][C]0.6627[/C][C]0.254138[/C][/ROW]
[ROW][C]42[/C][C]-0.023727[/C][C]-0.3447[/C][C]0.365348[/C][/ROW]
[ROW][C]43[/C][C]0.204753[/C][C]2.9742[/C][C]0.00164[/C][/ROW]
[ROW][C]44[/C][C]-0.186187[/C][C]-2.7045[/C][C]0.003699[/C][/ROW]
[ROW][C]45[/C][C]-0.104518[/C][C]-1.5182[/C][C]0.065228[/C][/ROW]
[ROW][C]46[/C][C]0.153677[/C][C]2.2323[/C][C]0.013323[/C][/ROW]
[ROW][C]47[/C][C]-0.206723[/C][C]-3.0028[/C][C]0.001499[/C][/ROW]
[ROW][C]48[/C][C]0.264027[/C][C]3.8352[/C][C]8.3e-05[/C][/ROW]
[/TABLE]
Source: https://freestatistics.org/blog/index.php?pk=308908&T=1

Globally Unique Identifier (entire table): ba.freestatistics.org/blog/index.php?pk=308908&T=1

As an alternative you can also use a QR Code:  

The GUIDs for individual cells are displayed in the table below:

Autocorrelation Function
Time lag kACF(k)T-STATP-value
1-0.433133-6.29160
2-0.157836-2.29270.011425
30.3294334.78532e-06
4-0.431598-6.26930
50.0755281.09710.136924
60.3236494.70132e-06
7-0.147699-2.14550.016529
8-0.177737-2.58180.005253
90.2665473.87187.2e-05
10-0.331436-4.81441e-06
11-0.039255-0.57020.28457
120.5715868.30280
13-0.369798-5.37160
140.1060091.53990.062544
150.0850841.23590.108932
16-0.425691-6.18350
170.2553813.70960.000133
180.1589872.30940.010944
19-0.164271-2.38620.008954
200.0324640.47160.318862
210.0273450.39720.345805
22-0.296208-4.30271.3e-05
230.207543.01470.001444
240.2197593.19220.000814
25-0.19462-2.8270.002575
260.1632082.37070.009327
27-0.122833-1.78430.03791
28-0.203677-2.95860.001722
290.2203013.20010.000793
30-0.036671-0.53270.297411
310.0541680.78680.21613
32-0.007473-0.10850.456831
33-0.132981-1.93170.02737
34-0.034008-0.4940.310913
350.0455090.66110.254647
360.121631.76680.039355
370.1024681.48840.069065
38-0.097942-1.42270.078152
39-0.096133-1.39640.082028
40-0.022428-0.32580.372454
410.0456190.66270.254138
42-0.023727-0.34470.365348
430.2047532.97420.00164
44-0.186187-2.70450.003699
45-0.104518-1.51820.065228
460.1536772.23230.013323
47-0.206723-3.00280.001499
480.2640273.83528.3e-05


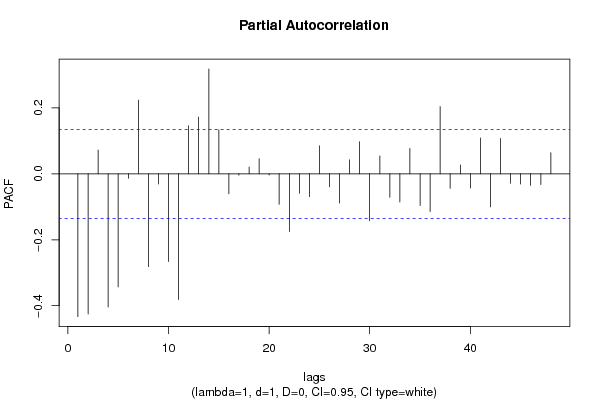
Partial Autocorrelation Function
Time lag kPACF(k)T-STATP-value
1-0.433133-6.29160
2-0.425211-6.17660
30.0718661.04390.148861
4-0.403714-5.86430
5-0.342823-4.97981e-06
6-0.01344-0.19520.422701
70.2233463.24430.000684
8-0.281466-4.08853.1e-05
9-0.030966-0.44980.326654
10-0.266141-3.86597.4e-05
11-0.381275-5.53830
120.1454792.11320.017879
130.1717622.4950.006681
140.317824.61663e-06
150.1331281.93380.027238
16-0.060395-0.87730.190666
17-0.004102-0.05960.476272
180.0207080.30080.381929
190.0455180.66120.254606
20-0.003715-0.0540.478507
21-0.092626-1.34550.089958
22-0.175156-2.54430.005833
23-0.05898-0.85670.19628
24-0.069286-1.00640.157679
250.084661.22980.110079
26-0.039483-0.57350.283452
27-0.088566-1.28650.099839
280.0422190.61330.270181
290.097351.41410.079405
30-0.142363-2.06790.019932
310.0539120.78310.217218
32-0.071279-1.03540.150836
33-0.085774-1.24590.107085
340.0766681.11370.133344
35-0.096261-1.39830.08175
36-0.114133-1.65790.049413
370.203622.95770.001726
38-0.04401-0.63930.261668
390.0268870.39060.348259
40-0.042985-0.62440.266522
410.1083891.57440.058443
42-0.100401-1.45840.073107
430.1071561.55650.060541
44-0.028639-0.4160.338913
45-0.031088-0.45160.326019
46-0.035193-0.51120.304869
47-0.032513-0.47230.318608
480.0636730.92490.178037

\begin{tabular}{lllllllll}
\hline
Partial Autocorrelation Function \tabularnewline
Time lag k & PACF(k) & T-STAT & P-value \tabularnewline
1 & -0.433133 & -6.2916 & 0 \tabularnewline
2 & -0.425211 & -6.1766 & 0 \tabularnewline
3 & 0.071866 & 1.0439 & 0.148861 \tabularnewline
4 & -0.403714 & -5.8643 & 0 \tabularnewline
5 & -0.342823 & -4.9798 & 1e-06 \tabularnewline
6 & -0.01344 & -0.1952 & 0.422701 \tabularnewline
7 & 0.223346 & 3.2443 & 0.000684 \tabularnewline
8 & -0.281466 & -4.0885 & 3.1e-05 \tabularnewline
9 & -0.030966 & -0.4498 & 0.326654 \tabularnewline
10 & -0.266141 & -3.8659 & 7.4e-05 \tabularnewline
11 & -0.381275 & -5.5383 & 0 \tabularnewline
12 & 0.145479 & 2.1132 & 0.017879 \tabularnewline
13 & 0.171762 & 2.495 & 0.006681 \tabularnewline
14 & 0.31782 & 4.6166 & 3e-06 \tabularnewline
15 & 0.133128 & 1.9338 & 0.027238 \tabularnewline
16 & -0.060395 & -0.8773 & 0.190666 \tabularnewline
17 & -0.004102 & -0.0596 & 0.476272 \tabularnewline
18 & 0.020708 & 0.3008 & 0.381929 \tabularnewline
19 & 0.045518 & 0.6612 & 0.254606 \tabularnewline
20 & -0.003715 & -0.054 & 0.478507 \tabularnewline
21 & -0.092626 & -1.3455 & 0.089958 \tabularnewline
22 & -0.175156 & -2.5443 & 0.005833 \tabularnewline
23 & -0.05898 & -0.8567 & 0.19628 \tabularnewline
24 & -0.069286 & -1.0064 & 0.157679 \tabularnewline
25 & 0.08466 & 1.2298 & 0.110079 \tabularnewline
26 & -0.039483 & -0.5735 & 0.283452 \tabularnewline
27 & -0.088566 & -1.2865 & 0.099839 \tabularnewline
28 & 0.042219 & 0.6133 & 0.270181 \tabularnewline
29 & 0.09735 & 1.4141 & 0.079405 \tabularnewline
30 & -0.142363 & -2.0679 & 0.019932 \tabularnewline
31 & 0.053912 & 0.7831 & 0.217218 \tabularnewline
32 & -0.071279 & -1.0354 & 0.150836 \tabularnewline
33 & -0.085774 & -1.2459 & 0.107085 \tabularnewline
34 & 0.076668 & 1.1137 & 0.133344 \tabularnewline
35 & -0.096261 & -1.3983 & 0.08175 \tabularnewline
36 & -0.114133 & -1.6579 & 0.049413 \tabularnewline
37 & 0.20362 & 2.9577 & 0.001726 \tabularnewline
38 & -0.04401 & -0.6393 & 0.261668 \tabularnewline
39 & 0.026887 & 0.3906 & 0.348259 \tabularnewline
40 & -0.042985 & -0.6244 & 0.266522 \tabularnewline
41 & 0.108389 & 1.5744 & 0.058443 \tabularnewline
42 & -0.100401 & -1.4584 & 0.073107 \tabularnewline
43 & 0.107156 & 1.5565 & 0.060541 \tabularnewline
44 & -0.028639 & -0.416 & 0.338913 \tabularnewline
45 & -0.031088 & -0.4516 & 0.326019 \tabularnewline
46 & -0.035193 & -0.5112 & 0.304869 \tabularnewline
47 & -0.032513 & -0.4723 & 0.318608 \tabularnewline
48 & 0.063673 & 0.9249 & 0.178037 \tabularnewline
\hline
\end{tabular}
%Source: https://freestatistics.org/blog/index.php?pk=308908&T=2

[TABLE]
[ROW][C]Partial Autocorrelation Function[/C][/ROW]
[ROW][C]Time lag k[/C][C]PACF(k)[/C][C]T-STAT[/C][C]P-value[/C][/ROW]
[ROW][C]1[/C][C]-0.433133[/C][C]-6.2916[/C][C]0[/C][/ROW]
[ROW][C]2[/C][C]-0.425211[/C][C]-6.1766[/C][C]0[/C][/ROW]
[ROW][C]3[/C][C]0.071866[/C][C]1.0439[/C][C]0.148861[/C][/ROW]
[ROW][C]4[/C][C]-0.403714[/C][C]-5.8643[/C][C]0[/C][/ROW]
[ROW][C]5[/C][C]-0.342823[/C][C]-4.9798[/C][C]1e-06[/C][/ROW]
[ROW][C]6[/C][C]-0.01344[/C][C]-0.1952[/C][C]0.422701[/C][/ROW]
[ROW][C]7[/C][C]0.223346[/C][C]3.2443[/C][C]0.000684[/C][/ROW]
[ROW][C]8[/C][C]-0.281466[/C][C]-4.0885[/C][C]3.1e-05[/C][/ROW]
[ROW][C]9[/C][C]-0.030966[/C][C]-0.4498[/C][C]0.326654[/C][/ROW]
[ROW][C]10[/C][C]-0.266141[/C][C]-3.8659[/C][C]7.4e-05[/C][/ROW]
[ROW][C]11[/C][C]-0.381275[/C][C]-5.5383[/C][C]0[/C][/ROW]
[ROW][C]12[/C][C]0.145479[/C][C]2.1132[/C][C]0.017879[/C][/ROW]
[ROW][C]13[/C][C]0.171762[/C][C]2.495[/C][C]0.006681[/C][/ROW]
[ROW][C]14[/C][C]0.31782[/C][C]4.6166[/C][C]3e-06[/C][/ROW]
[ROW][C]15[/C][C]0.133128[/C][C]1.9338[/C][C]0.027238[/C][/ROW]
[ROW][C]16[/C][C]-0.060395[/C][C]-0.8773[/C][C]0.190666[/C][/ROW]
[ROW][C]17[/C][C]-0.004102[/C][C]-0.0596[/C][C]0.476272[/C][/ROW]
[ROW][C]18[/C][C]0.020708[/C][C]0.3008[/C][C]0.381929[/C][/ROW]
[ROW][C]19[/C][C]0.045518[/C][C]0.6612[/C][C]0.254606[/C][/ROW]
[ROW][C]20[/C][C]-0.003715[/C][C]-0.054[/C][C]0.478507[/C][/ROW]
[ROW][C]21[/C][C]-0.092626[/C][C]-1.3455[/C][C]0.089958[/C][/ROW]
[ROW][C]22[/C][C]-0.175156[/C][C]-2.5443[/C][C]0.005833[/C][/ROW]
[ROW][C]23[/C][C]-0.05898[/C][C]-0.8567[/C][C]0.19628[/C][/ROW]
[ROW][C]24[/C][C]-0.069286[/C][C]-1.0064[/C][C]0.157679[/C][/ROW]
[ROW][C]25[/C][C]0.08466[/C][C]1.2298[/C][C]0.110079[/C][/ROW]
[ROW][C]26[/C][C]-0.039483[/C][C]-0.5735[/C][C]0.283452[/C][/ROW]
[ROW][C]27[/C][C]-0.088566[/C][C]-1.2865[/C][C]0.099839[/C][/ROW]
[ROW][C]28[/C][C]0.042219[/C][C]0.6133[/C][C]0.270181[/C][/ROW]
[ROW][C]29[/C][C]0.09735[/C][C]1.4141[/C][C]0.079405[/C][/ROW]
[ROW][C]30[/C][C]-0.142363[/C][C]-2.0679[/C][C]0.019932[/C][/ROW]
[ROW][C]31[/C][C]0.053912[/C][C]0.7831[/C][C]0.217218[/C][/ROW]
[ROW][C]32[/C][C]-0.071279[/C][C]-1.0354[/C][C]0.150836[/C][/ROW]
[ROW][C]33[/C][C]-0.085774[/C][C]-1.2459[/C][C]0.107085[/C][/ROW]
[ROW][C]34[/C][C]0.076668[/C][C]1.1137[/C][C]0.133344[/C][/ROW]
[ROW][C]35[/C][C]-0.096261[/C][C]-1.3983[/C][C]0.08175[/C][/ROW]
[ROW][C]36[/C][C]-0.114133[/C][C]-1.6579[/C][C]0.049413[/C][/ROW]
[ROW][C]37[/C][C]0.20362[/C][C]2.9577[/C][C]0.001726[/C][/ROW]
[ROW][C]38[/C][C]-0.04401[/C][C]-0.6393[/C][C]0.261668[/C][/ROW]
[ROW][C]39[/C][C]0.026887[/C][C]0.3906[/C][C]0.348259[/C][/ROW]
[ROW][C]40[/C][C]-0.042985[/C][C]-0.6244[/C][C]0.266522[/C][/ROW]
[ROW][C]41[/C][C]0.108389[/C][C]1.5744[/C][C]0.058443[/C][/ROW]
[ROW][C]42[/C][C]-0.100401[/C][C]-1.4584[/C][C]0.073107[/C][/ROW]
[ROW][C]43[/C][C]0.107156[/C][C]1.5565[/C][C]0.060541[/C][/ROW]
[ROW][C]44[/C][C]-0.028639[/C][C]-0.416[/C][C]0.338913[/C][/ROW]
[ROW][C]45[/C][C]-0.031088[/C][C]-0.4516[/C][C]0.326019[/C][/ROW]
[ROW][C]46[/C][C]-0.035193[/C][C]-0.5112[/C][C]0.304869[/C][/ROW]
[ROW][C]47[/C][C]-0.032513[/C][C]-0.4723[/C][C]0.318608[/C][/ROW]
[ROW][C]48[/C][C]0.063673[/C][C]0.9249[/C][C]0.178037[/C][/ROW]
[/TABLE]
Source: https://freestatistics.org/blog/index.php?pk=308908&T=2

Globally Unique Identifier (entire table): ba.freestatistics.org/blog/index.php?pk=308908&T=2

As an alternative you can also use a QR Code:  

The GUIDs for individual cells are displayed in the table below:

Partial Autocorrelation Function
Time lag kPACF(k)T-STATP-value
1-0.433133-6.29160
2-0.425211-6.17660
30.0718661.04390.148861
4-0.403714-5.86430
5-0.342823-4.97981e-06
6-0.01344-0.19520.422701
70.2233463.24430.000684
8-0.281466-4.08853.1e-05
9-0.030966-0.44980.326654
10-0.266141-3.86597.4e-05
11-0.381275-5.53830
120.1454792.11320.017879
130.1717622.4950.006681
140.317824.61663e-06
150.1331281.93380.027238
16-0.060395-0.87730.190666
17-0.004102-0.05960.476272
180.0207080.30080.381929
190.0455180.66120.254606
20-0.003715-0.0540.478507
21-0.092626-1.34550.089958
22-0.175156-2.54430.005833
23-0.05898-0.85670.19628
24-0.069286-1.00640.157679
250.084661.22980.110079
26-0.039483-0.57350.283452
27-0.088566-1.28650.099839
280.0422190.61330.270181
290.097351.41410.079405
30-0.142363-2.06790.019932
310.0539120.78310.217218
32-0.071279-1.03540.150836
33-0.085774-1.24590.107085
340.0766681.11370.133344
35-0.096261-1.39830.08175
36-0.114133-1.65790.049413
370.203622.95770.001726
38-0.04401-0.63930.261668
390.0268870.39060.348259
40-0.042985-0.62440.266522
410.1083891.57440.058443
42-0.100401-1.45840.073107
430.1071561.55650.060541
44-0.028639-0.4160.338913
45-0.031088-0.45160.326019
46-0.035193-0.51120.304869
47-0.032513-0.47230.318608
480.0636730.92490.178037


Parameters (Session):
par1 = 48 ; par2 = 1 ; par3 = 1 ; par4 = 0 ; par5 = 12 ; par6 = White Noise ; par7 = 0.95 ;
Parameters (R input):
par1 = 48 ; par2 = 1 ; par3 = 1 ; par4 = 0 ; par5 = 12 ; par6 = White Noise ; par7 = 0.95 ; par8 = ;
R code (references can be found in the software module):
par8 <- ''
par7 <- '0.95'
par6 <- 'White Noise'
par5 <- '12'
par4 <- '0'
par3 <- '1'
par2 <- '1'
par1 <- 'Default'
if (par1 == 'Default') {
par1 = 10*log10(length(x))
} else {
par1 <- as.numeric(par1)
}
par2 <- as.numeric(par2)
par3 <- as.numeric(par3)
par4 <- as.numeric(par4)
par5 <- as.numeric(par5)
if (par6 == 'White Noise') par6 <- 'white' else par6 <- 'ma'
par7 <- as.numeric(par7)
if (par8 != '') par8 <- as.numeric(par8)
x <- na.omit(x)
ox <- x
if (par8 == '') {
if (par2 == 0) {
x <- log(x)
} else {
x <- (x ^ par2 - 1) / par2
}
} else {
x <- log(x,base=par8)
}
if (par3 > 0) x <- diff(x,lag=1,difference=par3)
if (par4 > 0) x <- diff(x,lag=par5,difference=par4)
bitmap(file='picts.png')
op <- par(mfrow=c(2,1))
plot(ox,type='l',main='Original Time Series',xlab='time',ylab='value')
if (par8=='') {
mytitle <- paste('Working Time Series (lambda=',par2,', d=',par3,', D=',par4,')',sep='')
mysub <- paste('(lambda=',par2,', d=',par3,', D=',par4,', CI=', par7, ', CI type=',par6,')',sep='')
} else {
mytitle <- paste('Working Time Series (base=',par8,', d=',par3,', D=',par4,')',sep='')
mysub <- paste('(base=',par8,', d=',par3,', D=',par4,', CI=', par7, ', CI type=',par6,')',sep='')
}
plot(x,type='l', main=mytitle,xlab='time',ylab='value')
par(op)
dev.off()
bitmap(file='pic1.png')
racf <- acf(x, par1, main='Autocorrelation', xlab='time lag', ylab='ACF', ci.type=par6, ci=par7, sub=mysub)
dev.off()
bitmap(file='pic2.png')
rpacf <- pacf(x,par1,main='Partial Autocorrelation',xlab='lags',ylab='PACF',sub=mysub)
dev.off()
(myacf <- c(racf$acf))
(mypacf <- c(rpacf$acf))
lengthx <- length(x)
sqrtn <- sqrt(lengthx)
load(file='createtable')
a<-table.start()
a<-table.row.start(a)
a<-table.element(a,'Autocorrelation Function',4,TRUE)
a<-table.row.end(a)
a<-table.row.start(a)
a<-table.element(a,'Time lag k',header=TRUE)
a<-table.element(a,'ACF(k)',header=TRUE)
a<-table.element(a,'T-STAT',header=TRUE)
a<-table.element(a,'P-value',header=TRUE)
a<-table.row.end(a)
for (i in 2:(par1+1)) {
a<-table.row.start(a)
a<-table.element(a,i-1,header=TRUE)
a<-table.element(a,round(myacf[i],6))
mytstat <- myacf[i]*sqrtn
a<-table.element(a,round(mytstat,4))
a<-table.element(a,round(1-pt(abs(mytstat),lengthx),6))
a<-table.row.end(a)
}
a<-table.end(a)
table.save(a,file='mytable.tab')
a<-table.start()
a<-table.row.start(a)
a<-table.element(a,'Partial Autocorrelation Function',4,TRUE)
a<-table.row.end(a)
a<-table.row.start(a)
a<-table.element(a,'Time lag k',header=TRUE)
a<-table.element(a,'PACF(k)',header=TRUE)
a<-table.element(a,'T-STAT',header=TRUE)
a<-table.element(a,'P-value',header=TRUE)
a<-table.row.end(a)
for (i in 1:par1) {
a<-table.row.start(a)
a<-table.element(a,i,header=TRUE)
a<-table.element(a,round(mypacf[i],6))
mytstat <- mypacf[i]*sqrtn
a<-table.element(a,round(mytstat,4))
a<-table.element(a,round(1-pt(abs(mytstat),lengthx),6))
a<-table.row.end(a)
}
a<-table.end(a)
table.save(a,file='mytable1.tab')