Free Statistics

of Irreproducible Research!

Author's title

Author*The author of this computation has been verified*
R Software Modulerwasp_autocorrelation.wasp
Title produced by software(Partial) Autocorrelation Function
Date of computationSat, 09 Dec 2017 12:18:08 +0100
Cite this page as followsStatistical Computations at FreeStatistics.org, Office for Research Development and Education, URL https://freestatistics.org/blog/index.php?v=date/2017/Dec/09/t15128184099xlooc0cexhh5va.htm/, Retrieved Tue, 14 May 2024 14:01:00 +0000
Statistical Computations at FreeStatistics.org, Office for Research Development and Education, URL https://freestatistics.org/blog/index.php?pk=308841, Retrieved Tue, 14 May 2024 14:01:00 +0000
QR Codes:

Original text written by user:
IsPrivate?No (this computation is public)
User-defined keywords
Estimated Impact100
Family? (F = Feedback message, R = changed R code, M = changed R Module, P = changed Parameters, D = changed Data)
-       [(Partial) Autocorrelation Function] [] [2017-12-09 11:18:08] [d303646f018933692b665a59d945002e] [Current]
Feedback Forum

Post a new message
Dataseries X:
56.6
71.5
83.3
66.9
86.8
74.9
60.9
72.1
84.3
88.6
82.2
51.8
80.9
76.7
82.6
74.6
78.6
79
64.4
64
77.9
83.8
74.2
51.7
79.9
74.8
78
78.4
77.3
77.9
72
66.4
83.5
85.1
74.8
56.1
75.3
75.3
75.4
76.7
72.3
78.1
69.4
55
79.9
88.6
72.2
59.2
77.9
77.8
90.4
87.4
82.9
97.5
75.8
74
95.5
95.6
95.8
75.5
89.9
91.8
97
95.7
86
93.3
68.7
64.5
91
84.9
97.3
70.2
100.9
99.7
121.3
102.8
111.8
117.6
80.7
81.6
99.5
108.3
107.5
84.4
115.6
109.8
116.9
106.8
112.9
113.9
94.9
85.1
101
109.7
104.1
76.7
116.5
121.7
117.9
133.3
117.8
129.8
109.1
88
120.1
118.4
89.7
71.4
75.9
75.2
79.2
70.8
73.7
79.4
68.5
66.5
93
91.9
86.1
66.2
90.4
92.4
108.8
103.6
103
117.1
91.9
80.3
111.6
106.6
107
87.3
104.5
102.8
116.2
103.4
112.8
103
85.5
83.2
106.4
98.2
100.5
75.5
101.3
105.2
112.7
95.7
99.3
103
88.4
78.5
97
106.4
94.7
73.7
101.5
100.5
102.1
101.4
98.6
104.7
87.6
76
102.9
107.8
96
69.6
105.4
100.5
100.4
101.8
94.9
100.5
89.4
75.9
109.1
107.4
86.6
75.7
105.3
104.4
119.5
111.6
105.7
122.3
97.7
82.4
113.4
113.8
103.1
82.2
104.5
104.8
110.7
110.6
103.9
111.9
82.8
81.4
108.3
103.9
105.3
86
109.9
103.9
120.5
102.6
110.7
116.8
86.7
90.1


Summary of computational transaction
Raw Input view raw input (R code)
Raw Outputview raw output of R engine
Computing time2 seconds
R ServerBig Analytics Cloud Computing Center

\begin{tabular}{lllllllll}
\hline
Summary of computational transaction \tabularnewline
Raw Input view raw input (R code)  \tabularnewline
Raw Outputview raw output of R engine  \tabularnewline
Computing time2 seconds \tabularnewline
R ServerBig Analytics Cloud Computing Center \tabularnewline
\hline
\end{tabular}
%Source: https://freestatistics.org/blog/index.php?pk=308841&T=0

[TABLE]
[ROW]
Summary of computational transaction[/C][/ROW] [ROW]Raw Input[/C] view raw input (R code) [/C][/ROW] [ROW]Raw Output[/C]view raw output of R engine [/C][/ROW] [ROW]Computing time[/C]2 seconds[/C][/ROW] [ROW]R Server[/C]Big Analytics Cloud Computing Center[/C][/ROW] [/TABLE] Source: https://freestatistics.org/blog/index.php?pk=308841&T=0

Globally Unique Identifier (entire table): ba.freestatistics.org/blog/index.php?pk=308841&T=0

As an alternative you can also use a QR Code:  

The GUIDs for individual cells are displayed in the table below:

Summary of computational transaction
Raw Input view raw input (R code)
Raw Outputview raw output of R engine
Computing time2 seconds
R ServerBig Analytics Cloud Computing Center


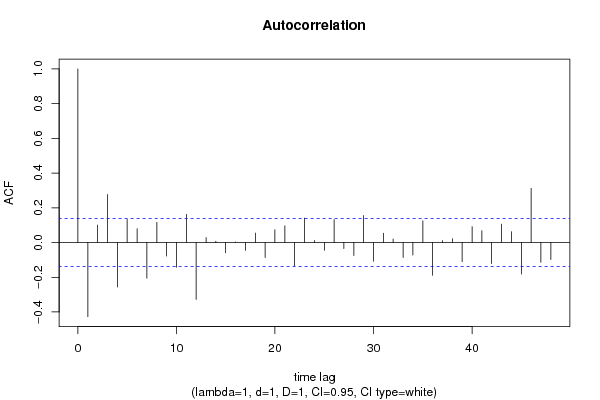
Autocorrelation Function
Time lag kACF(k)T-STATP-value
1-0.426849-6.02140
20.1004551.41710.079009
30.277093.90886.4e-05
4-0.256394-3.61690.000189
50.133231.87940.030823
60.0794241.12040.131943
7-0.204874-2.89010.002139
80.1163511.64130.051154
9-0.077199-1.0890.138728
10-0.142301-2.00740.02303
110.1621412.28730.011616
12-0.327424-4.61893e-06
130.0282650.39870.345259
140.0075880.1070.45743
15-0.059279-0.83620.202015
160.0030450.0430.482891
17-0.045251-0.63830.26199
180.0542410.76520.222541
19-0.086332-1.21790.11236
200.0738531.04180.149378
210.0963081.35860.087907
22-0.135041-1.9050.029112
230.1409091.98780.024104
240.0121970.17210.431784
25-0.044066-0.62160.26745
260.1319421.86130.03209
27-0.03409-0.48090.315559
28-0.074709-1.05390.146604
290.1559152.19950.014499
30-0.107329-1.51410.065798
310.0539180.76060.223895
320.0203840.28760.386993
33-0.085983-1.21290.113295
34-0.071555-1.00940.157002
350.1249351.76240.039766
36-0.188028-2.65250.004318
370.0109860.1550.438498
380.021460.30270.381208
39-0.109882-1.55010.061355
400.0916011.29220.098896
410.0684020.96490.167877
42-0.120825-1.70440.044929
430.1059821.49510.068241
440.062050.87530.191228
45-0.181078-2.55440.005692
460.3121164.40299e-06
47-0.113693-1.60380.055168
48-0.097633-1.37730.084986

\begin{tabular}{lllllllll}
\hline
Autocorrelation Function \tabularnewline
Time lag k & ACF(k) & T-STAT & P-value \tabularnewline
1 & -0.426849 & -6.0214 & 0 \tabularnewline
2 & 0.100455 & 1.4171 & 0.079009 \tabularnewline
3 & 0.27709 & 3.9088 & 6.4e-05 \tabularnewline
4 & -0.256394 & -3.6169 & 0.000189 \tabularnewline
5 & 0.13323 & 1.8794 & 0.030823 \tabularnewline
6 & 0.079424 & 1.1204 & 0.131943 \tabularnewline
7 & -0.204874 & -2.8901 & 0.002139 \tabularnewline
8 & 0.116351 & 1.6413 & 0.051154 \tabularnewline
9 & -0.077199 & -1.089 & 0.138728 \tabularnewline
10 & -0.142301 & -2.0074 & 0.02303 \tabularnewline
11 & 0.162141 & 2.2873 & 0.011616 \tabularnewline
12 & -0.327424 & -4.6189 & 3e-06 \tabularnewline
13 & 0.028265 & 0.3987 & 0.345259 \tabularnewline
14 & 0.007588 & 0.107 & 0.45743 \tabularnewline
15 & -0.059279 & -0.8362 & 0.202015 \tabularnewline
16 & 0.003045 & 0.043 & 0.482891 \tabularnewline
17 & -0.045251 & -0.6383 & 0.26199 \tabularnewline
18 & 0.054241 & 0.7652 & 0.222541 \tabularnewline
19 & -0.086332 & -1.2179 & 0.11236 \tabularnewline
20 & 0.073853 & 1.0418 & 0.149378 \tabularnewline
21 & 0.096308 & 1.3586 & 0.087907 \tabularnewline
22 & -0.135041 & -1.905 & 0.029112 \tabularnewline
23 & 0.140909 & 1.9878 & 0.024104 \tabularnewline
24 & 0.012197 & 0.1721 & 0.431784 \tabularnewline
25 & -0.044066 & -0.6216 & 0.26745 \tabularnewline
26 & 0.131942 & 1.8613 & 0.03209 \tabularnewline
27 & -0.03409 & -0.4809 & 0.315559 \tabularnewline
28 & -0.074709 & -1.0539 & 0.146604 \tabularnewline
29 & 0.155915 & 2.1995 & 0.014499 \tabularnewline
30 & -0.107329 & -1.5141 & 0.065798 \tabularnewline
31 & 0.053918 & 0.7606 & 0.223895 \tabularnewline
32 & 0.020384 & 0.2876 & 0.386993 \tabularnewline
33 & -0.085983 & -1.2129 & 0.113295 \tabularnewline
34 & -0.071555 & -1.0094 & 0.157002 \tabularnewline
35 & 0.124935 & 1.7624 & 0.039766 \tabularnewline
36 & -0.188028 & -2.6525 & 0.004318 \tabularnewline
37 & 0.010986 & 0.155 & 0.438498 \tabularnewline
38 & 0.02146 & 0.3027 & 0.381208 \tabularnewline
39 & -0.109882 & -1.5501 & 0.061355 \tabularnewline
40 & 0.091601 & 1.2922 & 0.098896 \tabularnewline
41 & 0.068402 & 0.9649 & 0.167877 \tabularnewline
42 & -0.120825 & -1.7044 & 0.044929 \tabularnewline
43 & 0.105982 & 1.4951 & 0.068241 \tabularnewline
44 & 0.06205 & 0.8753 & 0.191228 \tabularnewline
45 & -0.181078 & -2.5544 & 0.005692 \tabularnewline
46 & 0.312116 & 4.4029 & 9e-06 \tabularnewline
47 & -0.113693 & -1.6038 & 0.055168 \tabularnewline
48 & -0.097633 & -1.3773 & 0.084986 \tabularnewline
\hline
\end{tabular}
%Source: https://freestatistics.org/blog/index.php?pk=308841&T=1

[TABLE]
[ROW][C]Autocorrelation Function[/C][/ROW]
[ROW][C]Time lag k[/C][C]ACF(k)[/C][C]T-STAT[/C][C]P-value[/C][/ROW]
[ROW][C]1[/C][C]-0.426849[/C][C]-6.0214[/C][C]0[/C][/ROW]
[ROW][C]2[/C][C]0.100455[/C][C]1.4171[/C][C]0.079009[/C][/ROW]
[ROW][C]3[/C][C]0.27709[/C][C]3.9088[/C][C]6.4e-05[/C][/ROW]
[ROW][C]4[/C][C]-0.256394[/C][C]-3.6169[/C][C]0.000189[/C][/ROW]
[ROW][C]5[/C][C]0.13323[/C][C]1.8794[/C][C]0.030823[/C][/ROW]
[ROW][C]6[/C][C]0.079424[/C][C]1.1204[/C][C]0.131943[/C][/ROW]
[ROW][C]7[/C][C]-0.204874[/C][C]-2.8901[/C][C]0.002139[/C][/ROW]
[ROW][C]8[/C][C]0.116351[/C][C]1.6413[/C][C]0.051154[/C][/ROW]
[ROW][C]9[/C][C]-0.077199[/C][C]-1.089[/C][C]0.138728[/C][/ROW]
[ROW][C]10[/C][C]-0.142301[/C][C]-2.0074[/C][C]0.02303[/C][/ROW]
[ROW][C]11[/C][C]0.162141[/C][C]2.2873[/C][C]0.011616[/C][/ROW]
[ROW][C]12[/C][C]-0.327424[/C][C]-4.6189[/C][C]3e-06[/C][/ROW]
[ROW][C]13[/C][C]0.028265[/C][C]0.3987[/C][C]0.345259[/C][/ROW]
[ROW][C]14[/C][C]0.007588[/C][C]0.107[/C][C]0.45743[/C][/ROW]
[ROW][C]15[/C][C]-0.059279[/C][C]-0.8362[/C][C]0.202015[/C][/ROW]
[ROW][C]16[/C][C]0.003045[/C][C]0.043[/C][C]0.482891[/C][/ROW]
[ROW][C]17[/C][C]-0.045251[/C][C]-0.6383[/C][C]0.26199[/C][/ROW]
[ROW][C]18[/C][C]0.054241[/C][C]0.7652[/C][C]0.222541[/C][/ROW]
[ROW][C]19[/C][C]-0.086332[/C][C]-1.2179[/C][C]0.11236[/C][/ROW]
[ROW][C]20[/C][C]0.073853[/C][C]1.0418[/C][C]0.149378[/C][/ROW]
[ROW][C]21[/C][C]0.096308[/C][C]1.3586[/C][C]0.087907[/C][/ROW]
[ROW][C]22[/C][C]-0.135041[/C][C]-1.905[/C][C]0.029112[/C][/ROW]
[ROW][C]23[/C][C]0.140909[/C][C]1.9878[/C][C]0.024104[/C][/ROW]
[ROW][C]24[/C][C]0.012197[/C][C]0.1721[/C][C]0.431784[/C][/ROW]
[ROW][C]25[/C][C]-0.044066[/C][C]-0.6216[/C][C]0.26745[/C][/ROW]
[ROW][C]26[/C][C]0.131942[/C][C]1.8613[/C][C]0.03209[/C][/ROW]
[ROW][C]27[/C][C]-0.03409[/C][C]-0.4809[/C][C]0.315559[/C][/ROW]
[ROW][C]28[/C][C]-0.074709[/C][C]-1.0539[/C][C]0.146604[/C][/ROW]
[ROW][C]29[/C][C]0.155915[/C][C]2.1995[/C][C]0.014499[/C][/ROW]
[ROW][C]30[/C][C]-0.107329[/C][C]-1.5141[/C][C]0.065798[/C][/ROW]
[ROW][C]31[/C][C]0.053918[/C][C]0.7606[/C][C]0.223895[/C][/ROW]
[ROW][C]32[/C][C]0.020384[/C][C]0.2876[/C][C]0.386993[/C][/ROW]
[ROW][C]33[/C][C]-0.085983[/C][C]-1.2129[/C][C]0.113295[/C][/ROW]
[ROW][C]34[/C][C]-0.071555[/C][C]-1.0094[/C][C]0.157002[/C][/ROW]
[ROW][C]35[/C][C]0.124935[/C][C]1.7624[/C][C]0.039766[/C][/ROW]
[ROW][C]36[/C][C]-0.188028[/C][C]-2.6525[/C][C]0.004318[/C][/ROW]
[ROW][C]37[/C][C]0.010986[/C][C]0.155[/C][C]0.438498[/C][/ROW]
[ROW][C]38[/C][C]0.02146[/C][C]0.3027[/C][C]0.381208[/C][/ROW]
[ROW][C]39[/C][C]-0.109882[/C][C]-1.5501[/C][C]0.061355[/C][/ROW]
[ROW][C]40[/C][C]0.091601[/C][C]1.2922[/C][C]0.098896[/C][/ROW]
[ROW][C]41[/C][C]0.068402[/C][C]0.9649[/C][C]0.167877[/C][/ROW]
[ROW][C]42[/C][C]-0.120825[/C][C]-1.7044[/C][C]0.044929[/C][/ROW]
[ROW][C]43[/C][C]0.105982[/C][C]1.4951[/C][C]0.068241[/C][/ROW]
[ROW][C]44[/C][C]0.06205[/C][C]0.8753[/C][C]0.191228[/C][/ROW]
[ROW][C]45[/C][C]-0.181078[/C][C]-2.5544[/C][C]0.005692[/C][/ROW]
[ROW][C]46[/C][C]0.312116[/C][C]4.4029[/C][C]9e-06[/C][/ROW]
[ROW][C]47[/C][C]-0.113693[/C][C]-1.6038[/C][C]0.055168[/C][/ROW]
[ROW][C]48[/C][C]-0.097633[/C][C]-1.3773[/C][C]0.084986[/C][/ROW]
[/TABLE]
Source: https://freestatistics.org/blog/index.php?pk=308841&T=1

Globally Unique Identifier (entire table): ba.freestatistics.org/blog/index.php?pk=308841&T=1

As an alternative you can also use a QR Code:  

The GUIDs for individual cells are displayed in the table below:

Autocorrelation Function
Time lag kACF(k)T-STATP-value
1-0.426849-6.02140
20.1004551.41710.079009
30.277093.90886.4e-05
4-0.256394-3.61690.000189
50.133231.87940.030823
60.0794241.12040.131943
7-0.204874-2.89010.002139
80.1163511.64130.051154
9-0.077199-1.0890.138728
10-0.142301-2.00740.02303
110.1621412.28730.011616
12-0.327424-4.61893e-06
130.0282650.39870.345259
140.0075880.1070.45743
15-0.059279-0.83620.202015
160.0030450.0430.482891
17-0.045251-0.63830.26199
180.0542410.76520.222541
19-0.086332-1.21790.11236
200.0738531.04180.149378
210.0963081.35860.087907
22-0.135041-1.9050.029112
230.1409091.98780.024104
240.0121970.17210.431784
25-0.044066-0.62160.26745
260.1319421.86130.03209
27-0.03409-0.48090.315559
28-0.074709-1.05390.146604
290.1559152.19950.014499
30-0.107329-1.51410.065798
310.0539180.76060.223895
320.0203840.28760.386993
33-0.085983-1.21290.113295
34-0.071555-1.00940.157002
350.1249351.76240.039766
36-0.188028-2.65250.004318
370.0109860.1550.438498
380.021460.30270.381208
39-0.109882-1.55010.061355
400.0916011.29220.098896
410.0684020.96490.167877
42-0.120825-1.70440.044929
430.1059821.49510.068241
440.062050.87530.191228
45-0.181078-2.55440.005692
460.3121164.40299e-06
47-0.113693-1.60380.055168
48-0.097633-1.37730.084986


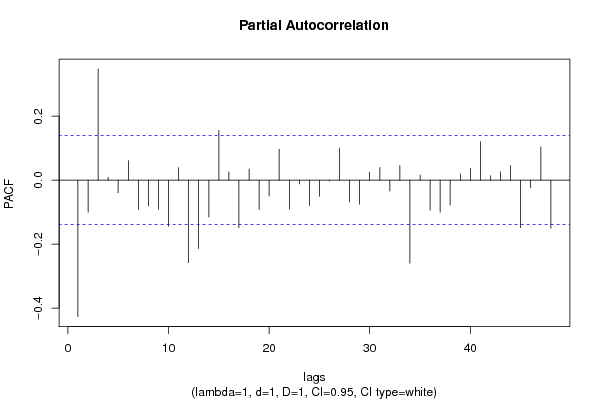
Partial Autocorrelation Function
Time lag kPACF(k)T-STATP-value
1-0.426849-6.02140
2-0.099956-1.41010.080042
30.34784.90631e-06
40.0086630.12220.451427
5-0.039384-0.55560.289559
60.0609420.85970.195496
7-0.090972-1.28330.100436
8-0.080974-1.14230.127355
9-0.090777-1.28060.100918
10-0.14408-2.03250.021716
110.0391140.55180.290862
12-0.257926-3.63850.000175
13-0.213974-3.01850.001436
14-0.114999-1.62230.053165
150.1554012.19220.014763
160.0258490.36470.357879
17-0.148896-2.10040.018475
180.0348370.49140.311829
19-0.091584-1.2920.098935
20-0.049803-0.70260.241575
210.0965311.36170.08741
22-0.090496-1.27660.101616
23-0.011762-0.16590.434195
24-0.079485-1.12130.131761
25-0.050388-0.71080.239017
26-0.002893-0.04080.483745
270.1001661.4130.079607
28-0.067891-0.95770.169683
29-0.074916-1.05680.145937
300.0246320.34750.364302
310.0391870.55280.29051
32-0.033993-0.47950.316045
330.0454570.64130.261049
34-0.259587-3.66190.00016
350.0162540.22930.409441
36-0.093694-1.32170.093891
37-0.100068-1.41160.079809
38-0.077512-1.09340.13776
390.0195710.27610.391386
400.0368660.52010.301799
410.119981.69250.046056
420.0134840.19020.424666
430.0260190.3670.356988
440.0459320.6480.25888
45-0.148794-2.0990.018539
46-0.023304-0.32870.371349
470.1042181.47020.071547
48-0.150223-2.11920.017659

\begin{tabular}{lllllllll}
\hline
Partial Autocorrelation Function \tabularnewline
Time lag k & PACF(k) & T-STAT & P-value \tabularnewline
1 & -0.426849 & -6.0214 & 0 \tabularnewline
2 & -0.099956 & -1.4101 & 0.080042 \tabularnewline
3 & 0.3478 & 4.9063 & 1e-06 \tabularnewline
4 & 0.008663 & 0.1222 & 0.451427 \tabularnewline
5 & -0.039384 & -0.5556 & 0.289559 \tabularnewline
6 & 0.060942 & 0.8597 & 0.195496 \tabularnewline
7 & -0.090972 & -1.2833 & 0.100436 \tabularnewline
8 & -0.080974 & -1.1423 & 0.127355 \tabularnewline
9 & -0.090777 & -1.2806 & 0.100918 \tabularnewline
10 & -0.14408 & -2.0325 & 0.021716 \tabularnewline
11 & 0.039114 & 0.5518 & 0.290862 \tabularnewline
12 & -0.257926 & -3.6385 & 0.000175 \tabularnewline
13 & -0.213974 & -3.0185 & 0.001436 \tabularnewline
14 & -0.114999 & -1.6223 & 0.053165 \tabularnewline
15 & 0.155401 & 2.1922 & 0.014763 \tabularnewline
16 & 0.025849 & 0.3647 & 0.357879 \tabularnewline
17 & -0.148896 & -2.1004 & 0.018475 \tabularnewline
18 & 0.034837 & 0.4914 & 0.311829 \tabularnewline
19 & -0.091584 & -1.292 & 0.098935 \tabularnewline
20 & -0.049803 & -0.7026 & 0.241575 \tabularnewline
21 & 0.096531 & 1.3617 & 0.08741 \tabularnewline
22 & -0.090496 & -1.2766 & 0.101616 \tabularnewline
23 & -0.011762 & -0.1659 & 0.434195 \tabularnewline
24 & -0.079485 & -1.1213 & 0.131761 \tabularnewline
25 & -0.050388 & -0.7108 & 0.239017 \tabularnewline
26 & -0.002893 & -0.0408 & 0.483745 \tabularnewline
27 & 0.100166 & 1.413 & 0.079607 \tabularnewline
28 & -0.067891 & -0.9577 & 0.169683 \tabularnewline
29 & -0.074916 & -1.0568 & 0.145937 \tabularnewline
30 & 0.024632 & 0.3475 & 0.364302 \tabularnewline
31 & 0.039187 & 0.5528 & 0.29051 \tabularnewline
32 & -0.033993 & -0.4795 & 0.316045 \tabularnewline
33 & 0.045457 & 0.6413 & 0.261049 \tabularnewline
34 & -0.259587 & -3.6619 & 0.00016 \tabularnewline
35 & 0.016254 & 0.2293 & 0.409441 \tabularnewline
36 & -0.093694 & -1.3217 & 0.093891 \tabularnewline
37 & -0.100068 & -1.4116 & 0.079809 \tabularnewline
38 & -0.077512 & -1.0934 & 0.13776 \tabularnewline
39 & 0.019571 & 0.2761 & 0.391386 \tabularnewline
40 & 0.036866 & 0.5201 & 0.301799 \tabularnewline
41 & 0.11998 & 1.6925 & 0.046056 \tabularnewline
42 & 0.013484 & 0.1902 & 0.424666 \tabularnewline
43 & 0.026019 & 0.367 & 0.356988 \tabularnewline
44 & 0.045932 & 0.648 & 0.25888 \tabularnewline
45 & -0.148794 & -2.099 & 0.018539 \tabularnewline
46 & -0.023304 & -0.3287 & 0.371349 \tabularnewline
47 & 0.104218 & 1.4702 & 0.071547 \tabularnewline
48 & -0.150223 & -2.1192 & 0.017659 \tabularnewline
\hline
\end{tabular}
%Source: https://freestatistics.org/blog/index.php?pk=308841&T=2

[TABLE]
[ROW][C]Partial Autocorrelation Function[/C][/ROW]
[ROW][C]Time lag k[/C][C]PACF(k)[/C][C]T-STAT[/C][C]P-value[/C][/ROW]
[ROW][C]1[/C][C]-0.426849[/C][C]-6.0214[/C][C]0[/C][/ROW]
[ROW][C]2[/C][C]-0.099956[/C][C]-1.4101[/C][C]0.080042[/C][/ROW]
[ROW][C]3[/C][C]0.3478[/C][C]4.9063[/C][C]1e-06[/C][/ROW]
[ROW][C]4[/C][C]0.008663[/C][C]0.1222[/C][C]0.451427[/C][/ROW]
[ROW][C]5[/C][C]-0.039384[/C][C]-0.5556[/C][C]0.289559[/C][/ROW]
[ROW][C]6[/C][C]0.060942[/C][C]0.8597[/C][C]0.195496[/C][/ROW]
[ROW][C]7[/C][C]-0.090972[/C][C]-1.2833[/C][C]0.100436[/C][/ROW]
[ROW][C]8[/C][C]-0.080974[/C][C]-1.1423[/C][C]0.127355[/C][/ROW]
[ROW][C]9[/C][C]-0.090777[/C][C]-1.2806[/C][C]0.100918[/C][/ROW]
[ROW][C]10[/C][C]-0.14408[/C][C]-2.0325[/C][C]0.021716[/C][/ROW]
[ROW][C]11[/C][C]0.039114[/C][C]0.5518[/C][C]0.290862[/C][/ROW]
[ROW][C]12[/C][C]-0.257926[/C][C]-3.6385[/C][C]0.000175[/C][/ROW]
[ROW][C]13[/C][C]-0.213974[/C][C]-3.0185[/C][C]0.001436[/C][/ROW]
[ROW][C]14[/C][C]-0.114999[/C][C]-1.6223[/C][C]0.053165[/C][/ROW]
[ROW][C]15[/C][C]0.155401[/C][C]2.1922[/C][C]0.014763[/C][/ROW]
[ROW][C]16[/C][C]0.025849[/C][C]0.3647[/C][C]0.357879[/C][/ROW]
[ROW][C]17[/C][C]-0.148896[/C][C]-2.1004[/C][C]0.018475[/C][/ROW]
[ROW][C]18[/C][C]0.034837[/C][C]0.4914[/C][C]0.311829[/C][/ROW]
[ROW][C]19[/C][C]-0.091584[/C][C]-1.292[/C][C]0.098935[/C][/ROW]
[ROW][C]20[/C][C]-0.049803[/C][C]-0.7026[/C][C]0.241575[/C][/ROW]
[ROW][C]21[/C][C]0.096531[/C][C]1.3617[/C][C]0.08741[/C][/ROW]
[ROW][C]22[/C][C]-0.090496[/C][C]-1.2766[/C][C]0.101616[/C][/ROW]
[ROW][C]23[/C][C]-0.011762[/C][C]-0.1659[/C][C]0.434195[/C][/ROW]
[ROW][C]24[/C][C]-0.079485[/C][C]-1.1213[/C][C]0.131761[/C][/ROW]
[ROW][C]25[/C][C]-0.050388[/C][C]-0.7108[/C][C]0.239017[/C][/ROW]
[ROW][C]26[/C][C]-0.002893[/C][C]-0.0408[/C][C]0.483745[/C][/ROW]
[ROW][C]27[/C][C]0.100166[/C][C]1.413[/C][C]0.079607[/C][/ROW]
[ROW][C]28[/C][C]-0.067891[/C][C]-0.9577[/C][C]0.169683[/C][/ROW]
[ROW][C]29[/C][C]-0.074916[/C][C]-1.0568[/C][C]0.145937[/C][/ROW]
[ROW][C]30[/C][C]0.024632[/C][C]0.3475[/C][C]0.364302[/C][/ROW]
[ROW][C]31[/C][C]0.039187[/C][C]0.5528[/C][C]0.29051[/C][/ROW]
[ROW][C]32[/C][C]-0.033993[/C][C]-0.4795[/C][C]0.316045[/C][/ROW]
[ROW][C]33[/C][C]0.045457[/C][C]0.6413[/C][C]0.261049[/C][/ROW]
[ROW][C]34[/C][C]-0.259587[/C][C]-3.6619[/C][C]0.00016[/C][/ROW]
[ROW][C]35[/C][C]0.016254[/C][C]0.2293[/C][C]0.409441[/C][/ROW]
[ROW][C]36[/C][C]-0.093694[/C][C]-1.3217[/C][C]0.093891[/C][/ROW]
[ROW][C]37[/C][C]-0.100068[/C][C]-1.4116[/C][C]0.079809[/C][/ROW]
[ROW][C]38[/C][C]-0.077512[/C][C]-1.0934[/C][C]0.13776[/C][/ROW]
[ROW][C]39[/C][C]0.019571[/C][C]0.2761[/C][C]0.391386[/C][/ROW]
[ROW][C]40[/C][C]0.036866[/C][C]0.5201[/C][C]0.301799[/C][/ROW]
[ROW][C]41[/C][C]0.11998[/C][C]1.6925[/C][C]0.046056[/C][/ROW]
[ROW][C]42[/C][C]0.013484[/C][C]0.1902[/C][C]0.424666[/C][/ROW]
[ROW][C]43[/C][C]0.026019[/C][C]0.367[/C][C]0.356988[/C][/ROW]
[ROW][C]44[/C][C]0.045932[/C][C]0.648[/C][C]0.25888[/C][/ROW]
[ROW][C]45[/C][C]-0.148794[/C][C]-2.099[/C][C]0.018539[/C][/ROW]
[ROW][C]46[/C][C]-0.023304[/C][C]-0.3287[/C][C]0.371349[/C][/ROW]
[ROW][C]47[/C][C]0.104218[/C][C]1.4702[/C][C]0.071547[/C][/ROW]
[ROW][C]48[/C][C]-0.150223[/C][C]-2.1192[/C][C]0.017659[/C][/ROW]
[/TABLE]
Source: https://freestatistics.org/blog/index.php?pk=308841&T=2

Globally Unique Identifier (entire table): ba.freestatistics.org/blog/index.php?pk=308841&T=2

As an alternative you can also use a QR Code:  

The GUIDs for individual cells are displayed in the table below:

Partial Autocorrelation Function
Time lag kPACF(k)T-STATP-value
1-0.426849-6.02140
2-0.099956-1.41010.080042
30.34784.90631e-06
40.0086630.12220.451427
5-0.039384-0.55560.289559
60.0609420.85970.195496
7-0.090972-1.28330.100436
8-0.080974-1.14230.127355
9-0.090777-1.28060.100918
10-0.14408-2.03250.021716
110.0391140.55180.290862
12-0.257926-3.63850.000175
13-0.213974-3.01850.001436
14-0.114999-1.62230.053165
150.1554012.19220.014763
160.0258490.36470.357879
17-0.148896-2.10040.018475
180.0348370.49140.311829
19-0.091584-1.2920.098935
20-0.049803-0.70260.241575
210.0965311.36170.08741
22-0.090496-1.27660.101616
23-0.011762-0.16590.434195
24-0.079485-1.12130.131761
25-0.050388-0.71080.239017
26-0.002893-0.04080.483745
270.1001661.4130.079607
28-0.067891-0.95770.169683
29-0.074916-1.05680.145937
300.0246320.34750.364302
310.0391870.55280.29051
32-0.033993-0.47950.316045
330.0454570.64130.261049
34-0.259587-3.66190.00016
350.0162540.22930.409441
36-0.093694-1.32170.093891
37-0.100068-1.41160.079809
38-0.077512-1.09340.13776
390.0195710.27610.391386
400.0368660.52010.301799
410.119981.69250.046056
420.0134840.19020.424666
430.0260190.3670.356988
440.0459320.6480.25888
45-0.148794-2.0990.018539
46-0.023304-0.32870.371349
470.1042181.47020.071547
48-0.150223-2.11920.017659


Parameters (Session):
par1 = 12 ;
Parameters (R input):
par1 = 48 ; par2 = 1 ; par3 = 1 ; par4 = 1 ; par5 = 12 ; par6 = White Noise ; par7 = 0.95 ; par8 = ;
R code (references can be found in the software module):
par8 <- ''
par7 <- '0.95'
par6 <- 'White Noise'
par5 <- '12'
par4 <- '0'
par3 <- '1'
par2 <- '1'
par1 <- '48'
if (par1 == 'Default') {
par1 = 10*log10(length(x))
} else {
par1 <- as.numeric(par1)
}
par2 <- as.numeric(par2)
par3 <- as.numeric(par3)
par4 <- as.numeric(par4)
par5 <- as.numeric(par5)
if (par6 == 'White Noise') par6 <- 'white' else par6 <- 'ma'
par7 <- as.numeric(par7)
if (par8 != '') par8 <- as.numeric(par8)
x <- na.omit(x)
ox <- x
if (par8 == '') {
if (par2 == 0) {
x <- log(x)
} else {
x <- (x ^ par2 - 1) / par2
}
} else {
x <- log(x,base=par8)
}
if (par3 > 0) x <- diff(x,lag=1,difference=par3)
if (par4 > 0) x <- diff(x,lag=par5,difference=par4)
bitmap(file='picts.png')
op <- par(mfrow=c(2,1))
plot(ox,type='l',main='Original Time Series',xlab='time',ylab='value')
if (par8=='') {
mytitle <- paste('Working Time Series (lambda=',par2,', d=',par3,', D=',par4,')',sep='')
mysub <- paste('(lambda=',par2,', d=',par3,', D=',par4,', CI=', par7, ', CI type=',par6,')',sep='')
} else {
mytitle <- paste('Working Time Series (base=',par8,', d=',par3,', D=',par4,')',sep='')
mysub <- paste('(base=',par8,', d=',par3,', D=',par4,', CI=', par7, ', CI type=',par6,')',sep='')
}
plot(x,type='l', main=mytitle,xlab='time',ylab='value')
par(op)
dev.off()
bitmap(file='pic1.png')
racf <- acf(x, par1, main='Autocorrelation', xlab='time lag', ylab='ACF', ci.type=par6, ci=par7, sub=mysub)
dev.off()
bitmap(file='pic2.png')
rpacf <- pacf(x,par1,main='Partial Autocorrelation',xlab='lags',ylab='PACF',sub=mysub)
dev.off()
(myacf <- c(racf$acf))
(mypacf <- c(rpacf$acf))
lengthx <- length(x)
sqrtn <- sqrt(lengthx)
load(file='createtable')
a<-table.start()
a<-table.row.start(a)
a<-table.element(a,'Autocorrelation Function',4,TRUE)
a<-table.row.end(a)
a<-table.row.start(a)
a<-table.element(a,'Time lag k',header=TRUE)
a<-table.element(a,'ACF(k)',header=TRUE)
a<-table.element(a,'T-STAT',header=TRUE)
a<-table.element(a,'P-value',header=TRUE)
a<-table.row.end(a)
for (i in 2:(par1+1)) {
a<-table.row.start(a)
a<-table.element(a,i-1,header=TRUE)
a<-table.element(a,round(myacf[i],6))
mytstat <- myacf[i]*sqrtn
a<-table.element(a,round(mytstat,4))
a<-table.element(a,round(1-pt(abs(mytstat),lengthx),6))
a<-table.row.end(a)
}
a<-table.end(a)
table.save(a,file='mytable.tab')
a<-table.start()
a<-table.row.start(a)
a<-table.element(a,'Partial Autocorrelation Function',4,TRUE)
a<-table.row.end(a)
a<-table.row.start(a)
a<-table.element(a,'Time lag k',header=TRUE)
a<-table.element(a,'PACF(k)',header=TRUE)
a<-table.element(a,'T-STAT',header=TRUE)
a<-table.element(a,'P-value',header=TRUE)
a<-table.row.end(a)
for (i in 1:par1) {
a<-table.row.start(a)
a<-table.element(a,i,header=TRUE)
a<-table.element(a,round(mypacf[i],6))
mytstat <- mypacf[i]*sqrtn
a<-table.element(a,round(mytstat,4))
a<-table.element(a,round(1-pt(abs(mytstat),lengthx),6))
a<-table.row.end(a)
}
a<-table.end(a)
table.save(a,file='mytable1.tab')