Free Statistics

of Irreproducible Research!

Author's title

Author*The author of this computation has been verified*
R Software Modulerwasp_autocorrelation.wasp
Title produced by software(Partial) Autocorrelation Function
Date of computationFri, 08 Dec 2017 15:16:10 +0100
Cite this page as followsStatistical Computations at FreeStatistics.org, Office for Research Development and Education, URL https://freestatistics.org/blog/index.php?v=date/2017/Dec/08/t1512742672gefm5cz5w01om33.htm/, Retrieved Tue, 14 May 2024 06:36:05 +0000
Statistical Computations at FreeStatistics.org, Office for Research Development and Education, URL https://freestatistics.org/blog/index.php?pk=308809, Retrieved Tue, 14 May 2024 06:36:05 +0000
QR Codes:

Original text written by user:
IsPrivate?No (this computation is public)
User-defined keywords
Estimated Impact97
Family? (F = Feedback message, R = changed R code, M = changed R Module, P = changed Parameters, D = changed Data)
-       [(Partial) Autocorrelation Function] [] [2017-12-08 14:16:10] [834c75312b1a933b06457deba9c9b5e8] [Current]
Feedback Forum

Post a new message
Dataseries X:
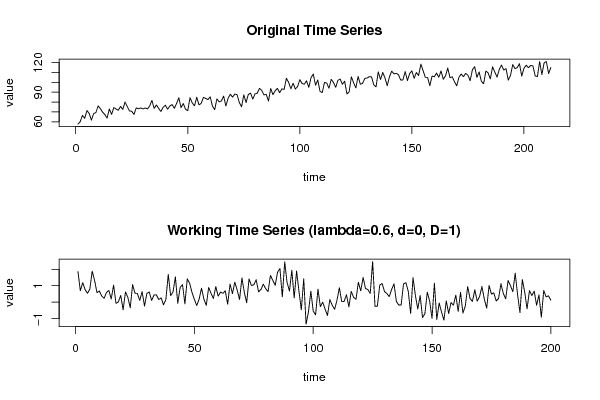
57.7
60.1
66.5
63.4
71.4
68.5
61.6
68.3
69.3
76.1
73.3
69.7
67.4
63.7
73
67.5
74.4
72.9
71.7
75.6
72.5
80
75.4
71
70.6
67.5
74.1
73.2
74
73
74
73
76
81.7
73.5
77
73.6
70.4
74.7
76.8
72.7
76
77.5
73.6
78.5
84.3
74.4
78.5
72.7
71.3
84.4
79.1
76.2
84.9
77.1
78.7
84.7
83.7
82.5
85.2
76
72.2
83.2
80.2
81.1
86
76
83.9
87.9
85
88.1
87.4
79.5
75.2
87.3
79.5
87.6
89.1
83
88.3
88.9
93.9
91.7
87.2
87.8
81
93.7
87.5
91.4
93.8
89.5
93.3
92.8
104.1
99.9
93.4
99
93.2
95.7
102.6
98.8
98
101.5
94.9
104.7
108.4
97
102.3
90.8
89.6
99.9
99.2
94
103
99.8
94.9
102
103.2
98
101.1
88.2
90.3
105.5
99.4
94.3
105.9
98
99
103.9
104.3
105.7
105.5
97.4
95.4
110.5
102.8
110
104.3
96.5
105.6
111.3
108.5
109.1
107.7
102.3
102.4
110.8
101.7
108.9
111.5
104
109.9
106.8
118.4
111.8
105
104.9
96.5
106.3
105.6
109.3
105.1
111.5
103.1
106.5
114.4
104.7
105.5
100.5
96.4
105.1
108.4
105.7
109
107.2
101.6
112.7
115.9
105
110.4
100.9
98.5
111.3
109.6
103.4
115.7
110.4
105.2
113.2
117.4
112.3
113.9
102.2
106.9
118
113.8
114.9
118.8
106.3
114.2
117.3
114.7
117
116.6
106.5
105.7
121
107.8
119.7
121
108.8
115


Summary of computational transaction
Raw Input view raw input (R code)
Raw Outputview raw output of R engine
Computing time1 seconds
R ServerBig Analytics Cloud Computing Center

\begin{tabular}{lllllllll}
\hline
Summary of computational transaction \tabularnewline
Raw Input view raw input (R code)  \tabularnewline
Raw Outputview raw output of R engine  \tabularnewline
Computing time1 seconds \tabularnewline
R ServerBig Analytics Cloud Computing Center \tabularnewline
\hline
\end{tabular}
%Source: https://freestatistics.org/blog/index.php?pk=308809&T=0

[TABLE]
[ROW]
Summary of computational transaction[/C][/ROW] [ROW]Raw Input[/C] view raw input (R code) [/C][/ROW] [ROW]Raw Output[/C]view raw output of R engine [/C][/ROW] [ROW]Computing time[/C]1 seconds[/C][/ROW] [ROW]R Server[/C]Big Analytics Cloud Computing Center[/C][/ROW] [/TABLE] Source: https://freestatistics.org/blog/index.php?pk=308809&T=0

Globally Unique Identifier (entire table): ba.freestatistics.org/blog/index.php?pk=308809&T=0

As an alternative you can also use a QR Code:  

The GUIDs for individual cells are displayed in the table below:

Summary of computational transaction
Raw Input view raw input (R code)
Raw Outputview raw output of R engine
Computing time1 seconds
R ServerBig Analytics Cloud Computing Center


Autocorrelation Function
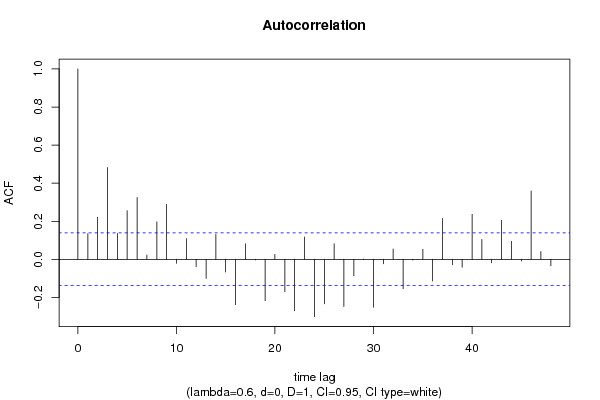
Time lag kACF(k)T-STATP-value
10.1351551.91140.028693
20.2207913.12250.00103
30.4820566.81730
40.1361411.92530.027803
50.2556493.61540.00019
60.3245274.58954e-06
70.0219510.31040.378278
80.1967762.78280.002952
90.288494.07993.3e-05
10-0.0204-0.28850.38663
110.1086741.53690.062951
12-0.038688-0.54710.292451
13-0.100212-1.41720.078989
140.1303521.84340.033372
15-0.067029-0.94790.172152
16-0.23801-3.3660.000457
170.0811891.14820.126131
18-0.002802-0.03960.484215
19-0.216898-3.06740.001229
200.0257580.36430.358022
21-0.170049-2.40490.008545
22-0.269419-3.81029.2e-05
230.1175121.66190.049053
24-0.301132-4.25861.6e-05
25-0.232979-3.29480.000582
260.082221.16280.123154
27-0.24816-3.50950.000277
28-0.086356-1.22130.111713
29-0.000696-0.00980.496077
30-0.251984-3.56360.000229
31-0.022891-0.32370.373239
320.0544140.76950.221242
33-0.154186-2.18050.015193
34-0.003506-0.04960.480253
350.0529450.74880.227444
36-0.11401-1.61230.054232
370.2147453.0370.001354
38-0.028179-0.39850.34534
39-0.041419-0.58580.279351
400.2361143.33910.000501
410.1042611.47450.070963
42-0.017654-0.24970.401552
430.2051532.90130.002066
440.0941961.33210.092166
45-0.009265-0.1310.447944
460.3592725.08090
470.0403810.57110.284293
48-0.034122-0.48260.31497

\begin{tabular}{lllllllll}
\hline
Autocorrelation Function \tabularnewline
Time lag k & ACF(k) & T-STAT & P-value \tabularnewline
1 & 0.135155 & 1.9114 & 0.028693 \tabularnewline
2 & 0.220791 & 3.1225 & 0.00103 \tabularnewline
3 & 0.482056 & 6.8173 & 0 \tabularnewline
4 & 0.136141 & 1.9253 & 0.027803 \tabularnewline
5 & 0.255649 & 3.6154 & 0.00019 \tabularnewline
6 & 0.324527 & 4.5895 & 4e-06 \tabularnewline
7 & 0.021951 & 0.3104 & 0.378278 \tabularnewline
8 & 0.196776 & 2.7828 & 0.002952 \tabularnewline
9 & 0.28849 & 4.0799 & 3.3e-05 \tabularnewline
10 & -0.0204 & -0.2885 & 0.38663 \tabularnewline
11 & 0.108674 & 1.5369 & 0.062951 \tabularnewline
12 & -0.038688 & -0.5471 & 0.292451 \tabularnewline
13 & -0.100212 & -1.4172 & 0.078989 \tabularnewline
14 & 0.130352 & 1.8434 & 0.033372 \tabularnewline
15 & -0.067029 & -0.9479 & 0.172152 \tabularnewline
16 & -0.23801 & -3.366 & 0.000457 \tabularnewline
17 & 0.081189 & 1.1482 & 0.126131 \tabularnewline
18 & -0.002802 & -0.0396 & 0.484215 \tabularnewline
19 & -0.216898 & -3.0674 & 0.001229 \tabularnewline
20 & 0.025758 & 0.3643 & 0.358022 \tabularnewline
21 & -0.170049 & -2.4049 & 0.008545 \tabularnewline
22 & -0.269419 & -3.8102 & 9.2e-05 \tabularnewline
23 & 0.117512 & 1.6619 & 0.049053 \tabularnewline
24 & -0.301132 & -4.2586 & 1.6e-05 \tabularnewline
25 & -0.232979 & -3.2948 & 0.000582 \tabularnewline
26 & 0.08222 & 1.1628 & 0.123154 \tabularnewline
27 & -0.24816 & -3.5095 & 0.000277 \tabularnewline
28 & -0.086356 & -1.2213 & 0.111713 \tabularnewline
29 & -0.000696 & -0.0098 & 0.496077 \tabularnewline
30 & -0.251984 & -3.5636 & 0.000229 \tabularnewline
31 & -0.022891 & -0.3237 & 0.373239 \tabularnewline
32 & 0.054414 & 0.7695 & 0.221242 \tabularnewline
33 & -0.154186 & -2.1805 & 0.015193 \tabularnewline
34 & -0.003506 & -0.0496 & 0.480253 \tabularnewline
35 & 0.052945 & 0.7488 & 0.227444 \tabularnewline
36 & -0.11401 & -1.6123 & 0.054232 \tabularnewline
37 & 0.214745 & 3.037 & 0.001354 \tabularnewline
38 & -0.028179 & -0.3985 & 0.34534 \tabularnewline
39 & -0.041419 & -0.5858 & 0.279351 \tabularnewline
40 & 0.236114 & 3.3391 & 0.000501 \tabularnewline
41 & 0.104261 & 1.4745 & 0.070963 \tabularnewline
42 & -0.017654 & -0.2497 & 0.401552 \tabularnewline
43 & 0.205153 & 2.9013 & 0.002066 \tabularnewline
44 & 0.094196 & 1.3321 & 0.092166 \tabularnewline
45 & -0.009265 & -0.131 & 0.447944 \tabularnewline
46 & 0.359272 & 5.0809 & 0 \tabularnewline
47 & 0.040381 & 0.5711 & 0.284293 \tabularnewline
48 & -0.034122 & -0.4826 & 0.31497 \tabularnewline
\hline
\end{tabular}
%Source: https://freestatistics.org/blog/index.php?pk=308809&T=1

[TABLE]
[ROW][C]Autocorrelation Function[/C][/ROW]
[ROW][C]Time lag k[/C][C]ACF(k)[/C][C]T-STAT[/C][C]P-value[/C][/ROW]
[ROW][C]1[/C][C]0.135155[/C][C]1.9114[/C][C]0.028693[/C][/ROW]
[ROW][C]2[/C][C]0.220791[/C][C]3.1225[/C][C]0.00103[/C][/ROW]
[ROW][C]3[/C][C]0.482056[/C][C]6.8173[/C][C]0[/C][/ROW]
[ROW][C]4[/C][C]0.136141[/C][C]1.9253[/C][C]0.027803[/C][/ROW]
[ROW][C]5[/C][C]0.255649[/C][C]3.6154[/C][C]0.00019[/C][/ROW]
[ROW][C]6[/C][C]0.324527[/C][C]4.5895[/C][C]4e-06[/C][/ROW]
[ROW][C]7[/C][C]0.021951[/C][C]0.3104[/C][C]0.378278[/C][/ROW]
[ROW][C]8[/C][C]0.196776[/C][C]2.7828[/C][C]0.002952[/C][/ROW]
[ROW][C]9[/C][C]0.28849[/C][C]4.0799[/C][C]3.3e-05[/C][/ROW]
[ROW][C]10[/C][C]-0.0204[/C][C]-0.2885[/C][C]0.38663[/C][/ROW]
[ROW][C]11[/C][C]0.108674[/C][C]1.5369[/C][C]0.062951[/C][/ROW]
[ROW][C]12[/C][C]-0.038688[/C][C]-0.5471[/C][C]0.292451[/C][/ROW]
[ROW][C]13[/C][C]-0.100212[/C][C]-1.4172[/C][C]0.078989[/C][/ROW]
[ROW][C]14[/C][C]0.130352[/C][C]1.8434[/C][C]0.033372[/C][/ROW]
[ROW][C]15[/C][C]-0.067029[/C][C]-0.9479[/C][C]0.172152[/C][/ROW]
[ROW][C]16[/C][C]-0.23801[/C][C]-3.366[/C][C]0.000457[/C][/ROW]
[ROW][C]17[/C][C]0.081189[/C][C]1.1482[/C][C]0.126131[/C][/ROW]
[ROW][C]18[/C][C]-0.002802[/C][C]-0.0396[/C][C]0.484215[/C][/ROW]
[ROW][C]19[/C][C]-0.216898[/C][C]-3.0674[/C][C]0.001229[/C][/ROW]
[ROW][C]20[/C][C]0.025758[/C][C]0.3643[/C][C]0.358022[/C][/ROW]
[ROW][C]21[/C][C]-0.170049[/C][C]-2.4049[/C][C]0.008545[/C][/ROW]
[ROW][C]22[/C][C]-0.269419[/C][C]-3.8102[/C][C]9.2e-05[/C][/ROW]
[ROW][C]23[/C][C]0.117512[/C][C]1.6619[/C][C]0.049053[/C][/ROW]
[ROW][C]24[/C][C]-0.301132[/C][C]-4.2586[/C][C]1.6e-05[/C][/ROW]
[ROW][C]25[/C][C]-0.232979[/C][C]-3.2948[/C][C]0.000582[/C][/ROW]
[ROW][C]26[/C][C]0.08222[/C][C]1.1628[/C][C]0.123154[/C][/ROW]
[ROW][C]27[/C][C]-0.24816[/C][C]-3.5095[/C][C]0.000277[/C][/ROW]
[ROW][C]28[/C][C]-0.086356[/C][C]-1.2213[/C][C]0.111713[/C][/ROW]
[ROW][C]29[/C][C]-0.000696[/C][C]-0.0098[/C][C]0.496077[/C][/ROW]
[ROW][C]30[/C][C]-0.251984[/C][C]-3.5636[/C][C]0.000229[/C][/ROW]
[ROW][C]31[/C][C]-0.022891[/C][C]-0.3237[/C][C]0.373239[/C][/ROW]
[ROW][C]32[/C][C]0.054414[/C][C]0.7695[/C][C]0.221242[/C][/ROW]
[ROW][C]33[/C][C]-0.154186[/C][C]-2.1805[/C][C]0.015193[/C][/ROW]
[ROW][C]34[/C][C]-0.003506[/C][C]-0.0496[/C][C]0.480253[/C][/ROW]
[ROW][C]35[/C][C]0.052945[/C][C]0.7488[/C][C]0.227444[/C][/ROW]
[ROW][C]36[/C][C]-0.11401[/C][C]-1.6123[/C][C]0.054232[/C][/ROW]
[ROW][C]37[/C][C]0.214745[/C][C]3.037[/C][C]0.001354[/C][/ROW]
[ROW][C]38[/C][C]-0.028179[/C][C]-0.3985[/C][C]0.34534[/C][/ROW]
[ROW][C]39[/C][C]-0.041419[/C][C]-0.5858[/C][C]0.279351[/C][/ROW]
[ROW][C]40[/C][C]0.236114[/C][C]3.3391[/C][C]0.000501[/C][/ROW]
[ROW][C]41[/C][C]0.104261[/C][C]1.4745[/C][C]0.070963[/C][/ROW]
[ROW][C]42[/C][C]-0.017654[/C][C]-0.2497[/C][C]0.401552[/C][/ROW]
[ROW][C]43[/C][C]0.205153[/C][C]2.9013[/C][C]0.002066[/C][/ROW]
[ROW][C]44[/C][C]0.094196[/C][C]1.3321[/C][C]0.092166[/C][/ROW]
[ROW][C]45[/C][C]-0.009265[/C][C]-0.131[/C][C]0.447944[/C][/ROW]
[ROW][C]46[/C][C]0.359272[/C][C]5.0809[/C][C]0[/C][/ROW]
[ROW][C]47[/C][C]0.040381[/C][C]0.5711[/C][C]0.284293[/C][/ROW]
[ROW][C]48[/C][C]-0.034122[/C][C]-0.4826[/C][C]0.31497[/C][/ROW]
[/TABLE]
Source: https://freestatistics.org/blog/index.php?pk=308809&T=1

Globally Unique Identifier (entire table): ba.freestatistics.org/blog/index.php?pk=308809&T=1

As an alternative you can also use a QR Code:  

The GUIDs for individual cells are displayed in the table below:

Autocorrelation Function
Time lag kACF(k)T-STATP-value
10.1351551.91140.028693
20.2207913.12250.00103
30.4820566.81730
40.1361411.92530.027803
50.2556493.61540.00019
60.3245274.58954e-06
70.0219510.31040.378278
80.1967762.78280.002952
90.288494.07993.3e-05
10-0.0204-0.28850.38663
110.1086741.53690.062951
12-0.038688-0.54710.292451
13-0.100212-1.41720.078989
140.1303521.84340.033372
15-0.067029-0.94790.172152
16-0.23801-3.3660.000457
170.0811891.14820.126131
18-0.002802-0.03960.484215
19-0.216898-3.06740.001229
200.0257580.36430.358022
21-0.170049-2.40490.008545
22-0.269419-3.81029.2e-05
230.1175121.66190.049053
24-0.301132-4.25861.6e-05
25-0.232979-3.29480.000582
260.082221.16280.123154
27-0.24816-3.50950.000277
28-0.086356-1.22130.111713
29-0.000696-0.00980.496077
30-0.251984-3.56360.000229
31-0.022891-0.32370.373239
320.0544140.76950.221242
33-0.154186-2.18050.015193
34-0.003506-0.04960.480253
350.0529450.74880.227444
36-0.11401-1.61230.054232
370.2147453.0370.001354
38-0.028179-0.39850.34534
39-0.041419-0.58580.279351
400.2361143.33910.000501
410.1042611.47450.070963
42-0.017654-0.24970.401552
430.2051532.90130.002066
440.0941961.33210.092166
45-0.009265-0.1310.447944
460.3592725.08090
470.0403810.57110.284293
48-0.034122-0.48260.31497


Partial Autocorrelation Function
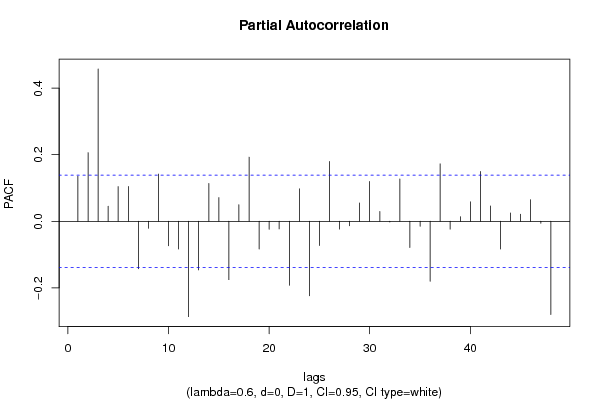
Time lag kPACF(k)T-STATP-value
10.1351551.91140.028693
20.2062922.91740.001967
30.457996.4770
40.0449310.63540.26294
50.1042581.47440.070969
60.1045031.47790.070505
7-0.14286-2.02030.022341
8-0.021302-0.30130.381765
90.141662.00340.023243
10-0.073597-1.04080.149609
11-0.08339-1.17930.119836
12-0.286909-4.05753.6e-05
13-0.146295-2.06890.019919
140.1134371.60420.055119
150.0711671.00650.157707
16-0.175524-2.48230.006939
170.0497310.70330.241345
180.1927472.72590.003491
19-0.083499-1.18080.119533
20-0.023998-0.33940.367337
21-0.02302-0.32550.372553
22-0.192629-2.72420.003508
230.0972841.37580.085211
24-0.224288-3.17190.000877
25-0.07278-1.02930.152299
260.1795052.53860.005946
27-0.023628-0.33410.369309
28-0.013502-0.19090.424383
290.0548710.7760.219334
300.1197091.69290.046012
310.0295510.41790.338231
32-0.002549-0.0360.485642
330.1272441.79950.036723
34-0.079168-1.11960.132112
35-0.015234-0.21540.414821
36-0.180248-2.54910.005775
370.1726732.4420.007738
38-0.023718-0.33540.36883
390.013740.19430.423063
400.0583180.82470.205251
410.1498692.11950.017642
420.0457280.64670.259285
43-0.08354-1.18140.119416
440.0249690.35310.362186
450.021130.29880.38269
460.0644830.91190.181453
47-0.005887-0.08330.466867
48-0.280372-3.96515.1e-05

\begin{tabular}{lllllllll}
\hline
Partial Autocorrelation Function \tabularnewline
Time lag k & PACF(k) & T-STAT & P-value \tabularnewline
1 & 0.135155 & 1.9114 & 0.028693 \tabularnewline
2 & 0.206292 & 2.9174 & 0.001967 \tabularnewline
3 & 0.45799 & 6.477 & 0 \tabularnewline
4 & 0.044931 & 0.6354 & 0.26294 \tabularnewline
5 & 0.104258 & 1.4744 & 0.070969 \tabularnewline
6 & 0.104503 & 1.4779 & 0.070505 \tabularnewline
7 & -0.14286 & -2.0203 & 0.022341 \tabularnewline
8 & -0.021302 & -0.3013 & 0.381765 \tabularnewline
9 & 0.14166 & 2.0034 & 0.023243 \tabularnewline
10 & -0.073597 & -1.0408 & 0.149609 \tabularnewline
11 & -0.08339 & -1.1793 & 0.119836 \tabularnewline
12 & -0.286909 & -4.0575 & 3.6e-05 \tabularnewline
13 & -0.146295 & -2.0689 & 0.019919 \tabularnewline
14 & 0.113437 & 1.6042 & 0.055119 \tabularnewline
15 & 0.071167 & 1.0065 & 0.157707 \tabularnewline
16 & -0.175524 & -2.4823 & 0.006939 \tabularnewline
17 & 0.049731 & 0.7033 & 0.241345 \tabularnewline
18 & 0.192747 & 2.7259 & 0.003491 \tabularnewline
19 & -0.083499 & -1.1808 & 0.119533 \tabularnewline
20 & -0.023998 & -0.3394 & 0.367337 \tabularnewline
21 & -0.02302 & -0.3255 & 0.372553 \tabularnewline
22 & -0.192629 & -2.7242 & 0.003508 \tabularnewline
23 & 0.097284 & 1.3758 & 0.085211 \tabularnewline
24 & -0.224288 & -3.1719 & 0.000877 \tabularnewline
25 & -0.07278 & -1.0293 & 0.152299 \tabularnewline
26 & 0.179505 & 2.5386 & 0.005946 \tabularnewline
27 & -0.023628 & -0.3341 & 0.369309 \tabularnewline
28 & -0.013502 & -0.1909 & 0.424383 \tabularnewline
29 & 0.054871 & 0.776 & 0.219334 \tabularnewline
30 & 0.119709 & 1.6929 & 0.046012 \tabularnewline
31 & 0.029551 & 0.4179 & 0.338231 \tabularnewline
32 & -0.002549 & -0.036 & 0.485642 \tabularnewline
33 & 0.127244 & 1.7995 & 0.036723 \tabularnewline
34 & -0.079168 & -1.1196 & 0.132112 \tabularnewline
35 & -0.015234 & -0.2154 & 0.414821 \tabularnewline
36 & -0.180248 & -2.5491 & 0.005775 \tabularnewline
37 & 0.172673 & 2.442 & 0.007738 \tabularnewline
38 & -0.023718 & -0.3354 & 0.36883 \tabularnewline
39 & 0.01374 & 0.1943 & 0.423063 \tabularnewline
40 & 0.058318 & 0.8247 & 0.205251 \tabularnewline
41 & 0.149869 & 2.1195 & 0.017642 \tabularnewline
42 & 0.045728 & 0.6467 & 0.259285 \tabularnewline
43 & -0.08354 & -1.1814 & 0.119416 \tabularnewline
44 & 0.024969 & 0.3531 & 0.362186 \tabularnewline
45 & 0.02113 & 0.2988 & 0.38269 \tabularnewline
46 & 0.064483 & 0.9119 & 0.181453 \tabularnewline
47 & -0.005887 & -0.0833 & 0.466867 \tabularnewline
48 & -0.280372 & -3.9651 & 5.1e-05 \tabularnewline
\hline
\end{tabular}
%Source: https://freestatistics.org/blog/index.php?pk=308809&T=2

[TABLE]
[ROW][C]Partial Autocorrelation Function[/C][/ROW]
[ROW][C]Time lag k[/C][C]PACF(k)[/C][C]T-STAT[/C][C]P-value[/C][/ROW]
[ROW][C]1[/C][C]0.135155[/C][C]1.9114[/C][C]0.028693[/C][/ROW]
[ROW][C]2[/C][C]0.206292[/C][C]2.9174[/C][C]0.001967[/C][/ROW]
[ROW][C]3[/C][C]0.45799[/C][C]6.477[/C][C]0[/C][/ROW]
[ROW][C]4[/C][C]0.044931[/C][C]0.6354[/C][C]0.26294[/C][/ROW]
[ROW][C]5[/C][C]0.104258[/C][C]1.4744[/C][C]0.070969[/C][/ROW]
[ROW][C]6[/C][C]0.104503[/C][C]1.4779[/C][C]0.070505[/C][/ROW]
[ROW][C]7[/C][C]-0.14286[/C][C]-2.0203[/C][C]0.022341[/C][/ROW]
[ROW][C]8[/C][C]-0.021302[/C][C]-0.3013[/C][C]0.381765[/C][/ROW]
[ROW][C]9[/C][C]0.14166[/C][C]2.0034[/C][C]0.023243[/C][/ROW]
[ROW][C]10[/C][C]-0.073597[/C][C]-1.0408[/C][C]0.149609[/C][/ROW]
[ROW][C]11[/C][C]-0.08339[/C][C]-1.1793[/C][C]0.119836[/C][/ROW]
[ROW][C]12[/C][C]-0.286909[/C][C]-4.0575[/C][C]3.6e-05[/C][/ROW]
[ROW][C]13[/C][C]-0.146295[/C][C]-2.0689[/C][C]0.019919[/C][/ROW]
[ROW][C]14[/C][C]0.113437[/C][C]1.6042[/C][C]0.055119[/C][/ROW]
[ROW][C]15[/C][C]0.071167[/C][C]1.0065[/C][C]0.157707[/C][/ROW]
[ROW][C]16[/C][C]-0.175524[/C][C]-2.4823[/C][C]0.006939[/C][/ROW]
[ROW][C]17[/C][C]0.049731[/C][C]0.7033[/C][C]0.241345[/C][/ROW]
[ROW][C]18[/C][C]0.192747[/C][C]2.7259[/C][C]0.003491[/C][/ROW]
[ROW][C]19[/C][C]-0.083499[/C][C]-1.1808[/C][C]0.119533[/C][/ROW]
[ROW][C]20[/C][C]-0.023998[/C][C]-0.3394[/C][C]0.367337[/C][/ROW]
[ROW][C]21[/C][C]-0.02302[/C][C]-0.3255[/C][C]0.372553[/C][/ROW]
[ROW][C]22[/C][C]-0.192629[/C][C]-2.7242[/C][C]0.003508[/C][/ROW]
[ROW][C]23[/C][C]0.097284[/C][C]1.3758[/C][C]0.085211[/C][/ROW]
[ROW][C]24[/C][C]-0.224288[/C][C]-3.1719[/C][C]0.000877[/C][/ROW]
[ROW][C]25[/C][C]-0.07278[/C][C]-1.0293[/C][C]0.152299[/C][/ROW]
[ROW][C]26[/C][C]0.179505[/C][C]2.5386[/C][C]0.005946[/C][/ROW]
[ROW][C]27[/C][C]-0.023628[/C][C]-0.3341[/C][C]0.369309[/C][/ROW]
[ROW][C]28[/C][C]-0.013502[/C][C]-0.1909[/C][C]0.424383[/C][/ROW]
[ROW][C]29[/C][C]0.054871[/C][C]0.776[/C][C]0.219334[/C][/ROW]
[ROW][C]30[/C][C]0.119709[/C][C]1.6929[/C][C]0.046012[/C][/ROW]
[ROW][C]31[/C][C]0.029551[/C][C]0.4179[/C][C]0.338231[/C][/ROW]
[ROW][C]32[/C][C]-0.002549[/C][C]-0.036[/C][C]0.485642[/C][/ROW]
[ROW][C]33[/C][C]0.127244[/C][C]1.7995[/C][C]0.036723[/C][/ROW]
[ROW][C]34[/C][C]-0.079168[/C][C]-1.1196[/C][C]0.132112[/C][/ROW]
[ROW][C]35[/C][C]-0.015234[/C][C]-0.2154[/C][C]0.414821[/C][/ROW]
[ROW][C]36[/C][C]-0.180248[/C][C]-2.5491[/C][C]0.005775[/C][/ROW]
[ROW][C]37[/C][C]0.172673[/C][C]2.442[/C][C]0.007738[/C][/ROW]
[ROW][C]38[/C][C]-0.023718[/C][C]-0.3354[/C][C]0.36883[/C][/ROW]
[ROW][C]39[/C][C]0.01374[/C][C]0.1943[/C][C]0.423063[/C][/ROW]
[ROW][C]40[/C][C]0.058318[/C][C]0.8247[/C][C]0.205251[/C][/ROW]
[ROW][C]41[/C][C]0.149869[/C][C]2.1195[/C][C]0.017642[/C][/ROW]
[ROW][C]42[/C][C]0.045728[/C][C]0.6467[/C][C]0.259285[/C][/ROW]
[ROW][C]43[/C][C]-0.08354[/C][C]-1.1814[/C][C]0.119416[/C][/ROW]
[ROW][C]44[/C][C]0.024969[/C][C]0.3531[/C][C]0.362186[/C][/ROW]
[ROW][C]45[/C][C]0.02113[/C][C]0.2988[/C][C]0.38269[/C][/ROW]
[ROW][C]46[/C][C]0.064483[/C][C]0.9119[/C][C]0.181453[/C][/ROW]
[ROW][C]47[/C][C]-0.005887[/C][C]-0.0833[/C][C]0.466867[/C][/ROW]
[ROW][C]48[/C][C]-0.280372[/C][C]-3.9651[/C][C]5.1e-05[/C][/ROW]
[/TABLE]
Source: https://freestatistics.org/blog/index.php?pk=308809&T=2

Globally Unique Identifier (entire table): ba.freestatistics.org/blog/index.php?pk=308809&T=2

As an alternative you can also use a QR Code:  

The GUIDs for individual cells are displayed in the table below:

Partial Autocorrelation Function
Time lag kPACF(k)T-STATP-value
10.1351551.91140.028693
20.2062922.91740.001967
30.457996.4770
40.0449310.63540.26294
50.1042581.47440.070969
60.1045031.47790.070505
7-0.14286-2.02030.022341
8-0.021302-0.30130.381765
90.141662.00340.023243
10-0.073597-1.04080.149609
11-0.08339-1.17930.119836
12-0.286909-4.05753.6e-05
13-0.146295-2.06890.019919
140.1134371.60420.055119
150.0711671.00650.157707
16-0.175524-2.48230.006939
170.0497310.70330.241345
180.1927472.72590.003491
19-0.083499-1.18080.119533
20-0.023998-0.33940.367337
21-0.02302-0.32550.372553
22-0.192629-2.72420.003508
230.0972841.37580.085211
24-0.224288-3.17190.000877
25-0.07278-1.02930.152299
260.1795052.53860.005946
27-0.023628-0.33410.369309
28-0.013502-0.19090.424383
290.0548710.7760.219334
300.1197091.69290.046012
310.0295510.41790.338231
32-0.002549-0.0360.485642
330.1272441.79950.036723
34-0.079168-1.11960.132112
35-0.015234-0.21540.414821
36-0.180248-2.54910.005775
370.1726732.4420.007738
38-0.023718-0.33540.36883
390.013740.19430.423063
400.0583180.82470.205251
410.1498692.11950.017642
420.0457280.64670.259285
43-0.08354-1.18140.119416
440.0249690.35310.362186
450.021130.29880.38269
460.0644830.91190.181453
47-0.005887-0.08330.466867
48-0.280372-3.96515.1e-05


Parameters (Session):
par1 = 48 ; par2 = 0.6 ; par3 = 0 ; par4 = 1 ; par5 = 12 ; par6 = White Noise ; par7 = 0.95 ;
Parameters (R input):
par1 = 48 ; par2 = 0.6 ; par3 = 0 ; par4 = 1 ; par5 = 12 ; par6 = White Noise ; par7 = 0.95 ; par8 = ;
R code (references can be found in the software module):
if (par1 == 'Default') {
par1 = 10*log10(length(x))
} else {
par1 <- as.numeric(par1)
}
par2 <- as.numeric(par2)
par3 <- as.numeric(par3)
par4 <- as.numeric(par4)
par5 <- as.numeric(par5)
if (par6 == 'White Noise') par6 <- 'white' else par6 <- 'ma'
par7 <- as.numeric(par7)
if (par8 != '') par8 <- as.numeric(par8)
x <- na.omit(x)
ox <- x
if (par8 == '') {
if (par2 == 0) {
x <- log(x)
} else {
x <- (x ^ par2 - 1) / par2
}
} else {
x <- log(x,base=par8)
}
if (par3 > 0) x <- diff(x,lag=1,difference=par3)
if (par4 > 0) x <- diff(x,lag=par5,difference=par4)
bitmap(file='picts.png')
op <- par(mfrow=c(2,1))
plot(ox,type='l',main='Original Time Series',xlab='time',ylab='value')
if (par8=='') {
mytitle <- paste('Working Time Series (lambda=',par2,', d=',par3,', D=',par4,')',sep='')
mysub <- paste('(lambda=',par2,', d=',par3,', D=',par4,', CI=', par7, ', CI type=',par6,')',sep='')
} else {
mytitle <- paste('Working Time Series (base=',par8,', d=',par3,', D=',par4,')',sep='')
mysub <- paste('(base=',par8,', d=',par3,', D=',par4,', CI=', par7, ', CI type=',par6,')',sep='')
}
plot(x,type='l', main=mytitle,xlab='time',ylab='value')
par(op)
dev.off()
bitmap(file='pic1.png')
racf <- acf(x, par1, main='Autocorrelation', xlab='time lag', ylab='ACF', ci.type=par6, ci=par7, sub=mysub)
dev.off()
bitmap(file='pic2.png')
rpacf <- pacf(x,par1,main='Partial Autocorrelation',xlab='lags',ylab='PACF',sub=mysub)
dev.off()
(myacf <- c(racf$acf))
(mypacf <- c(rpacf$acf))
lengthx <- length(x)
sqrtn <- sqrt(lengthx)
load(file='createtable')
a<-table.start()
a<-table.row.start(a)
a<-table.element(a,'Autocorrelation Function',4,TRUE)
a<-table.row.end(a)
a<-table.row.start(a)
a<-table.element(a,'Time lag k',header=TRUE)
a<-table.element(a,'ACF(k)',header=TRUE)
a<-table.element(a,'T-STAT',header=TRUE)
a<-table.element(a,'P-value',header=TRUE)
a<-table.row.end(a)
for (i in 2:(par1+1)) {
a<-table.row.start(a)
a<-table.element(a,i-1,header=TRUE)
a<-table.element(a,round(myacf[i],6))
mytstat <- myacf[i]*sqrtn
a<-table.element(a,round(mytstat,4))
a<-table.element(a,round(1-pt(abs(mytstat),lengthx),6))
a<-table.row.end(a)
}
a<-table.end(a)
table.save(a,file='mytable.tab')
a<-table.start()
a<-table.row.start(a)
a<-table.element(a,'Partial Autocorrelation Function',4,TRUE)
a<-table.row.end(a)
a<-table.row.start(a)
a<-table.element(a,'Time lag k',header=TRUE)
a<-table.element(a,'PACF(k)',header=TRUE)
a<-table.element(a,'T-STAT',header=TRUE)
a<-table.element(a,'P-value',header=TRUE)
a<-table.row.end(a)
for (i in 1:par1) {
a<-table.row.start(a)
a<-table.element(a,i,header=TRUE)
a<-table.element(a,round(mypacf[i],6))
mytstat <- mypacf[i]*sqrtn
a<-table.element(a,round(mytstat,4))
a<-table.element(a,round(1-pt(abs(mytstat),lengthx),6))
a<-table.row.end(a)
}
a<-table.end(a)
table.save(a,file='mytable1.tab')