Free Statistics

of Irreproducible Research!

Author's title

Author*The author of this computation has been verified*
R Software Modulerwasp_multipleregression.wasp
Title produced by softwareMultiple Regression
Date of computationFri, 08 Dec 2017 14:58:04 +0100
Cite this page as followsStatistical Computations at FreeStatistics.org, Office for Research Development and Education, URL https://freestatistics.org/blog/index.php?v=date/2017/Dec/08/t15127415151tb7h6smq0ozjav.htm/, Retrieved Tue, 14 May 2024 19:10:21 +0000
Statistical Computations at FreeStatistics.org, Office for Research Development and Education, URL https://freestatistics.org/blog/index.php?pk=308799, Retrieved Tue, 14 May 2024 19:10:21 +0000
QR Codes:

Original text written by user:
IsPrivate?No (this computation is public)
User-defined keywords
Estimated Impact88
Family? (F = Feedback message, R = changed R code, M = changed R Module, P = changed Parameters, D = changed Data)
-       [Multiple Regression] [multiple regressi...] [2017-12-08 13:58:04] [431300f4593cfe73715ac2c22e82996b] [Current]
Feedback Forum

Post a new message
Dataseries X:
28375	16	60.5	30.5	5.6
14678	27	53.8	36.2	0.5
25286	26	73.8	7.7	16.8
17194	25	1.2	0.6	98.8
33954	29	92.5	1.4	1.7
15523	29	7	7.7	79
25949	22	50.8	0.3	44.2
25043	35	8.6	0.2	84.1
16778	44	14.6	17.7	66.3
22005	31	63.6	7.7	26.5
26916	76	51.4	0.9	44.9
51186	40	67.3	0.6	12.9
25563	31	83.7	7.6	3.1
25998	23	64	23.5	7.5
20027	39	37.5	27	24.7
23205	25	30.5	58.4	6.4
29881	54	52.2	16.2	15.7
41676	24	44.8	6.9	16.5
37455	57	31.3	7.5	15.2
27384	21	28.3	5.1	58.1
23342	42	92.3	2.3	2.9
22719	21	40.3	10.7	41.4
18376	36	17.8	4.4	76.4
17695	26	77.7	0.9	9.7
21610	49	78.1	2.2	15.1
32921	54	94	1.8	1.9
22441	26	7.7	6	77.9
23926	48	86.2	7.4	6.5
13231	33	6	3.4	89.9
19599	21	56.6	1.2	35.9
14995	41	1.6	66.4	35.2
22968	48	0.6	98.6	0
34698	36	89.9	4.3	1.4
22085	41	93.7	0.6	5.1
21868	29	42	12.3	37.1
32142	27	60.1	9.5	13.7
21769	45	65.1	23.7	6.3
15373	32	4.3	3.4	89.6
16558	35	16.5	0.9	78.7
17853	36	53.7	44.4	1.8
20248	35	94.1	2.4	2.6
17225	40	33.9	2.6	56.6
26667	18	83.9	4	5.5
15488	34	72.1	14.5	6.8
19978	39	4.2	0.2	93.9
18995	21	3.3	11.7	84.7
14256	62	5.1	85.1	6.2
18843	43	59.9	31.7	2.9
21170	44	15.8	0.3	81.5
20901	29	39.3	0.1	1.7
86023	35	60.6	7.8	10.5
22105	50	57	17.7	19.8
14560	18	0	98.9	0.1
27813	25	74.9	0.8	22.8
28125	31	89	0	8.1
42931	29	70.7	4.5	15.5
20407	49	79.7	1.4	14.5
18047	23	2	1.1	96.6
35827	45	69.7	0.1	28
17893	26	1.9	47.3	45.9
31080	35	94.9	0.6	3.2
25130	34	93.2	0.3	2.2
35788	46	43	7.7	1
28556	29	86.2	6.4	3.9
27031	39	73.2	6	14.4
11805	28	12.2	18.9	48.3
20428	51	46	0.9	51.3
12840	67	95.9	0	0
31274	53	94.4	0.5	2.9
14177	25	0	98.4	1
13805	30	18.1	67.5	11.5
16689	24	6.5	31.8	58.6
14746	35	40.7	1.4	35.8
8206	43	18	54.9	23
22409	24	71.5	20.2	3.9
37579	29	41	1.7	53.4
33294	38	88.7	3	1.7
22080	31	67.2	21.7	10
21049	36	61.8	6.4	15.4
37721	23	52.5	36.5	4.4
21845	38	78.2	5.4	14.2
23583	53	94.9	3.7	0.3
14816	24	62.7	0.3	28.3
22235	26	32.9	15	48.3
21264	28	82.8	4.9	5.3
21667	34	63.6	7.7	21.4
22472	28	31.8	51	12
25799	40	3.8	81.2	6.1
21344	51	1.5	83.1	15.6
30465	44	87.8	0	10.3
19146	25	8.5	0.4	89.6
38593	56	69.3	2.8	17.8
21626	37	51.6	11	18.4
24749	58	62.5	15.8	15.9
16218	39	55.5	6.4	36
22833	37	49.2	0.1	49.8
39122	35	23.7	54.6	7
11157	26	17.4	75.7	0
22857	47	43.6	4.9	36
12109	31	41.5	52.6	3.1
22385	60	65.4	32.1	1.5
20610	32	40.4	44	10.4
10987	45	88.9	0.1	6.4
21474	42	75.3	13.7	10.5
21109	17	74	1.3	20.3
18438	22	20.4	9.8	70.7
12741	33	5.7	6.1	88.5
30061	18	88.2	8.5	1.4
29488	39	94.1	3.2	1.5
30491	59	92.2	2.9	5.9
18370	33	44.7	25	1.9
24348	58	94.3	3.9	1.1
23883	58	95.7	0	2
15373	47	51.3	47.8	0.9
41609	41	76.8	2.1	8.8
21130	64	22.5	1.8	64.6
19598	45	9.5	0	33.9
33869	53	87.1	1.8	3.4
16983	24	54.9	22	19.1
23944	48	10.8	86.4	2.6
20254	29	3.2	94.4	5
15656	40	0.9	19.5	71.9
26928	34	47.3	6.7	29
30784	21	28.9	22.8	39.6
19921	26	52.2	5.1	41.5
14256	45	0.4	84.8	14
18257	25	19	46.1	28.8
32088	17	96.1	0.1	3.1
26846	24	23.6	3	49.1
36099	42	86.8	0.3	10.5
22193	29	37.5	5	54.3
19031	42	54.9	42.7	0.6
28490	30	55	22.1	14.9
21858	29	76.2	0	19.9
14520	39	9.3	81.6	13.5
25135	63	83.5	9	1.1
21837	49	94.3	4.7	0.1
19755	41	70.6	24.1	1.5
20623	27	21.5	53	20.9
51071	30	91.1	2.1	3.4
21342	60	25.2	17.5	53.5
13968	77	22.2	77.8	1.5
16415	19	65	0.9	30.3
24026	37	15.6	5.8	66
37922	54	11.3	86.4	0
17632	29	48.3	8.1	38.4
31009	30	34.7	16.3	14.6
35008	24	43	18.6	23.5
16415	21	65	0.9	30.3
16953	44	52.2	23.8	10.1
20644	40	68.6	0	23.6
31930	32	84.1	0.3	3.8
27255	22	7.9	2.1	83.7
19343	43	20.6	5.9	71.2
22177	52	12.6	3.5	77
16620	27	0.5	0.2	96.3
27273	34	67.9	0	27.1
26675	20	84.7	4.4	7.5
18976	25	11.1	75.1	11.3
37028	24	63.1	0.5	6.5
31776	20	46.4	6.1	24.4
18363	46	66.2	30.9	0.1
23716	42	70.2	1.3	23.3
23444	43	39.3	27.1	22.1
30261	41	21.2	19	57.8
25030	59	34.2	57.3	1.1
14227	25	0.1	99.4	0
23467	42	56.7	9.1	24
21261	64	66.2	28.5	3.8
31641	22	90	9.3	0
41377	24	86.9	0.7	2.9
18397	63	69.1	0.8	2.6
40529	56	80.6	0.6	10.5
22384	60	96.3	0.3	0.2
23683	54	82.8	15	0.4
20405	37	57.8	7.4	20.3
27745	22	74.2	10.8	9.1
36727	39	61.4	24.2	10.7
21693	45	84.3	4.6	6
20760	57	89	8.6	1.9
26643	42	99.6	0.2	0
17223	19	4	9.5	68.2
14932	26	33.1	3	52.5
18243	34	97.3	0.8	0.3
16615	69	94.2	3.4	1.1
27432	64	44.1	18.9	32.7
21306	35	4.6	35.9	35.9
20836	40	33.2	62.2	2.8
14048	19	0.2	99.8	0
18727	27	86.2	9.8	1
17433	37	16	10.6	72.4
14504	17	69.6	6.6	19.9
11338	39	56.7	34.3	7.1
15489	74	33.3	43.7	22.3
30391	42	87.2	0.1	5
18238	47	42	27.1	29.9
38810	43	85.5	11	0.7
39179	46	94.4	0	4.2
30489	44	96.5	0.7	1.6
22255	31	36.5	57.6	0.3
24705	47	96.8	0.2	0.8
41719	41	73.8	2.5	17.7
20213	43	63.2	21.4	4.7
22947	40	89.6	0	4.1
30906	32	62.2	1.6	28.7
10219	31	5.4	93.1	1.3
22021	20	79.4	0.3	17.1
11184	20	8.4	88	5.8
19808	33	70.9	19.6	7.1
18029	22	9.9	68.6	20.6
18975	41	58.6	0	40.4
37476	41	35.3	19.7	29.2
19868	32	62.5	27.2	8.4
25865	16	38	53	3.2
28397	29	72.5	1.2	19.3
22750	42	62.8	32.1	1.9
19032	29	14	60	26.6
12297	47	28.7	17.7	48.7
19423	53	39.3	59.4	0
26314	18	1	95	0.7
15289	47	99.4	0.2	0
30625	34	83.3	2.2	8.7
29063	36	56.8	34	4.4
36696	63	51.1	0.4	6.1
35194	36	64.1	8.1	24.7
17493	27	59.9	34	2
19218	28	56.5	35.1	2.9
16616	33	71	21	3.6
37967	32	85.7	9.4	2.7
26001	42	60.3	8.8	25.7
27355	31	87.3	1.2	9.2
32602	17	38.8	43.2	13.7
20860	28	87.4	0	10.4
20396	24	50.9	31.2	7.9
18750	71	67.9	29.8	1.3
21988	51	40.2	12.6	44.2
23243	28	30.6	11.5	44.4
48922	53	97.1	0.5	0.9
23940	54	90	0	6.7
22681	45	20.6	74.2	2.2
27385	33	90.5	5.1	2.2
24076	48	75.4	1.6	6.5
34326	34	63.9	3.7	26.6
22016	23	45	34.2	15.7
23378	35	71.2	0	23.6
32902	33	50.4	11.7	10.2
45333	32	59.2	1.4	24.3
32466	52	89.3	4.9	0.5
16670	30	1.5	16.6	36.3
26030	23	32.9	18.3	39.2
22158	35	79.9	4.4	10.4
14765	42	41.5	9.1	37.7
20769	37	67.9	30	0.1
15511	56	24.3	4.9	67.2
28062	36	34.1	24.5	26
15480	27	5.1	2.7	80
23633	30	76.9	8.5	4
27172	31	79.9	3.8	10.3
17213	46	29.6	13.1	56
19316	51	76.4	1.7	3.5
24332	72	14.9	24.9	34.2
22628	28	31.8	9.3	48.6
30661	63	63.1	9.4	18.8
30908	28	27.6	0.7	26.2
22995	33	52.8	1.8	41.3
22734	24	46.9	1	51.7
19474	27	82.7	8.9	3.2
13130	24	4.3	0.3	2.7
23280	28	37.7	22.7	10.9
40021	28	79.1	4.6	9.2
21955	17	26.6	40.7	26.2
33918	46	83.3	1.5	10.9
19136	52	45.7	21.4	28.2
25279	39	37.7	17.2	42.1
23974	49	38.6	9.1	52.8
29893	30	61.9	20.5	18.4
23250	51	75.3	3.5	14.3
14754	16	5.2	93.6	0.7
16463	18	68	17.4	6.4
32211	22	60.2	4	30.3
25418	40	67.6	26.3	4.3
18760	61	97.2	0.3	0.6
34176	52	64.4	24.6	5.2
25226	51	61.8	29.3	6
36305	36	75.3	1.1	17.3
31491	36	79.9	0	10.8
41145	59	71	17.6	2.7
14332	17	44.8	34.1	19.7
26583	18	92.3	1.3	5.7
23750	41	90.5	0.6	7.6
20075	33	25.5	11.1	13.6
26067	25	5.9	83	9.5
17693	23	28.5	59.4	6.1
18978	47	34.5	59.4	1.4
19645	58	91.8	5.1	1.5
29959	47	69.3	0	19.8
35089	34	1.6	92.7	5.1
28125	28	87.5	0.1	3.3
17901	37	75.4	8.6	4.9
27077	87	91	0.6	0.8
54036	39	92.7	0.1	1.6
28730	27	44.7	0	41.7
12376	35	2.4	2	72
20072	36	1.4	87.2	4.5
11425	24	18.9	42.3	5.4
22537	26	56.4	31.8	4.4
26119	34	19.2	75.3	4.8
5457	51	69.4	4.4	3.5
17474	49	62	0.4	31.7
15542	41	49.7	16.5	26.3
24858	54	80.7	0.7	1.4
19029	36	39.8	7	50.1
13143	26	5.8	92.8	2.5
17026	35	32.8	7.8	35.5
25190	22	47.5	28.2	22.6
19400	27	88.5	9.9	0.7
30332	42	62.1	7.1	15.5
64657	32	73.5	0.9	11.8
33875	32	94.7	0.9	3.4
25839	25	71.7	2.3	9.8
29511	26	16.1	2.6	70.9
21506	53	97.2	1.3	0
20296	26	74.9	2.3	12
17696	40	90	1.8	2.3
13939	55	9.7	89.1	0
27917	29	97.1	1.1	0.3
13929	31	93.4	2	1.3
30533	19	15	0.4	11.1
18472	57	87.2	0.2	3.6
20297	40	77.2	17.8	3.7
30723	35	40.1	45.6	3.1
23011	35	65.6	11.1	19.8
18022	39	33.3	0.7	61.8
49269	37	78	15.7	2.6
14457	36	3.2	0	96.8
11405	62	58.2	9.8	24.8
21008	43	23.3	0.9	68
15892	32	79	4.1	9.4
31009	34	34.7	16.3	14.6
21082	37	26.2	24	41
5688	37	58.6	17.8	7.9
21831	33	95.9	2	0
25231	35	73.5	5.6	4.5
21131	40	83.3	2.2	6.6
42774	21	14.5	4.5	7.9
16071	30	49.7	13.6	32.2
45795	23	37	45.7	10.6
16012	26	16.3	12	55.4
42519	39	94.4	0.9	3.1
40693	33	46.4	5.3	43.2
37476	34	35.3	19.7	29.2
9353	37	2.1	84.2	5.4
22057	26	42.6	3.2	52.9
39531	24	41.8	8.7	8.8
15628	25	5.9	14.5	62.7
25755	31	15.7	1.6	69.1
36062	49	94.5	0.2	0.2
37453	59	28.1	7.1	32.9
17402	50	23.5	1.3	72.3
34516	37	10.6	23	7.8
23844	28	69.7	16.6	3.3
40387	26	29.8	25.3	34.5
22132	23	7.2	1.9	83.4
17401	32	5.1	21.3	77.8
43458	24	86.7	3.3	3.1
14964	42	76.8	8.5	7.3
15556	34	1.1	60.3	37.2
28690	68	61.7	9.8	16.3
18174	31	19.6	3.5	74.1
25034	83	82.8	1	5.2
20761	35	37.4	10.7	47.7
26047	29	24.2	5.6	70.2
11558	50	0.6	95.6	3.9
26741	56	72.8	0.3	26.3
26101	43	47.6	0.3	50.6
28781	38	89.6	3.4	4.5
20995	27	58.6	25.5	10
22348	36	73.6	0	24.2
23281	55	85.8	0.5	6
21115	36	36.3	2.3	59.8
27875	68	62.3	6.1	30
31969	61	53.3	6.4	34.6
20153	46	82.5	10.5	0.4
30540	47	86.8	1.5	10.6
18133	26	95.5	0	0
32242	37	27.6	5.5	46.4
30472	22	49	2.5	22.5
25977	18	75.2	1.5	21.7
14162	39	1.7	0	94.3
12930	49	9.9	85.3	4.8
16953	23	52.2	23.8	10.1
21130	47	30.1	1.4	66.5
24236	32	47.3	8.8	43.7
19151	45	9.5	67	21.7
20900	51	2.3	0.8	97.1
43062	31	68.9	10.7	10.7
16558	54	16.5	0.9	78.7
21374	31	80.9	0.2	11.9
15632	23	13	10.4	61.1
19746	29	8.5	6.3	84.5
23243	28	30.6	11.5	44.4
23143	31	57.8	15.5	2.2
15812	24	4.8	0.4	94.8
44430	27	67	1.5	19.7
17467	57	8.5	0	27.3
34053	39	86.7	0.8	9.2
33110	38	81.1	8.6	2.7
44585	34	58.6	2.8	19.2
19149	39	86.3	2.1	0
16065	20	14.3	38.8	44.9
24352	35	54.5	0	42.3
29056	36	65.8	11.3	21.1
21509	38	26.1	13.4	2
20164	33	49.5	10.9	36.1
26143	57	37.8	28.2	8.9
21908	38	44.4	22.4	28.9
19044	72	66.6	8	21
15686	37	45.5	3.1	40.8
21658	47	58	11.3	15.6
20685	43	77.3	16.9	2.9
20423	37	71.5	2.6	18.7
29741	75	42.2	20.6	24.9
15252	21	36.9	43.4	1.5
12961	20	5.7	92.4	1.3
11576	29	49.4	40	4.7
31524	37	77.4	14.6	7.6
26566	41	68.7	5.5	5.6
16745	22	1.8	79.2	20.8
18371	23	7.5	92.5	0
15871	64	49.8	43.7	3.5
11656	34	1	98.6	0.2
36216	49	89.4	2.2	7.5
17367	32	5.7	0	80.8
14989	25	19.9	0.6	79
36394	39	88	2.6	4
18999	53	68.7	5.3	18.1
26934	27	72.1	0.9	19.5
17632	36	48.3	8.1	38.4
15498	20	41.3	0.6	55.3
27719	39	78.5	0.4	20.9
35028	19	90.7	1.3	5.5
19921	34	56.9	28.6	8.5
22213	36	72.2	25.9	0.3
25110	34	72.5	0	1.1
27347	31	89.5	0	8.4
35316	45	77.5	3.1	15
26597	34	74.8	8.8	4.2
29695	31	25	31.9	40.1
16940	28	0.3	37	60.3
52896	57	78.5	6.5	4.8
27535	29	87.4	10	0
14963	50	15.8	65.2	18.6
54494	40	89.2	0.9	6
31761	35	94.8	0	2.5
42312	53	84.7	1.4	7.7
31470	59	64.3	16.9	4.9
25262	18	40.9	53.8	0
18470	28	74.5	0.4	20.2
21175	52	83.2	10.1	0.3
26971	38	21.7	24.9	37.1
33590	48	23.1	4	12.3


Summary of computational transaction
Raw Input view raw input (R code)
Raw Outputview raw output of R engine
Computing time11 seconds
R ServerBig Analytics Cloud Computing Center

\begin{tabular}{lllllllll}
\hline
Summary of computational transaction \tabularnewline
Raw Input view raw input (R code)  \tabularnewline
Raw Outputview raw output of R engine  \tabularnewline
Computing time11 seconds \tabularnewline
R ServerBig Analytics Cloud Computing Center \tabularnewline
\hline
\end{tabular}
%Source: https://freestatistics.org/blog/index.php?pk=308799&T=0

[TABLE]
[ROW]
Summary of computational transaction[/C][/ROW] [ROW]Raw Input[/C] view raw input (R code) [/C][/ROW] [ROW]Raw Output[/C]view raw output of R engine [/C][/ROW] [ROW]Computing time[/C]11 seconds[/C][/ROW] [ROW]R Server[/C]Big Analytics Cloud Computing Center[/C][/ROW] [/TABLE] Source: https://freestatistics.org/blog/index.php?pk=308799&T=0

Globally Unique Identifier (entire table): ba.freestatistics.org/blog/index.php?pk=308799&T=0

As an alternative you can also use a QR Code:  

The GUIDs for individual cells are displayed in the table below:

Summary of computational transaction
Raw Input view raw input (R code)
Raw Outputview raw output of R engine
Computing time11 seconds
R ServerBig Analytics Cloud Computing Center


Multiple Linear Regression - Estimated Regression Equation
PrInc[t] = + 34931.1 -28.067Age[t] -50.7956Sh_White[t] -180.43Sh_Black[t] -167.759Sh_Hisp[t] + e[t]

\begin{tabular}{lllllllll}
\hline
Multiple Linear Regression - Estimated Regression Equation \tabularnewline
PrInc[t] =  +  34931.1 -28.067Age[t] -50.7956Sh_White[t] -180.43Sh_Black[t] -167.759Sh_Hisp[t]  + e[t] \tabularnewline
 \tabularnewline
\hline
\end{tabular}
%Source: https://freestatistics.org/blog/index.php?pk=308799&T=1

[TABLE]
[ROW][C]Multiple Linear Regression - Estimated Regression Equation[/C][/ROW]
[ROW][C]PrInc[t] =  +  34931.1 -28.067Age[t] -50.7956Sh_White[t] -180.43Sh_Black[t] -167.759Sh_Hisp[t]  + e[t][/C][/ROW]
[ROW][C][/C][/ROW]
[/TABLE]
Source: https://freestatistics.org/blog/index.php?pk=308799&T=1

Globally Unique Identifier (entire table): ba.freestatistics.org/blog/index.php?pk=308799&T=1

As an alternative you can also use a QR Code:  

The GUIDs for individual cells are displayed in the table below:

Multiple Linear Regression - Estimated Regression Equation
PrInc[t] = + 34931.1 -28.067Age[t] -50.7956Sh_White[t] -180.43Sh_Black[t] -167.759Sh_Hisp[t] + e[t]


Multiple Linear Regression - Ordinary Least Squares
VariableParameterS.D.T-STATH0: parameter = 02-tail p-value1-tail p-value
(Intercept)+3.493e+04 3210+1.0880e+01 1.118e-24 5.589e-25
Age-28.07 30.23-9.2850e-01 0.3536 0.1768
Sh_White-50.8 33.73-1.5060e+00 0.1327 0.06636
Sh_Black-180.4 34.12-5.2890e+00 1.917e-07 9.586e-08
Sh_Hisp-167.8 35.52-4.7230e+00 3.096e-06 1.548e-06

\begin{tabular}{lllllllll}
\hline
Multiple Linear Regression - Ordinary Least Squares \tabularnewline
Variable & Parameter & S.D. & T-STATH0: parameter = 0 & 2-tail p-value & 1-tail p-value \tabularnewline
(Intercept) & +3.493e+04 &  3210 & +1.0880e+01 &  1.118e-24 &  5.589e-25 \tabularnewline
Age & -28.07 &  30.23 & -9.2850e-01 &  0.3536 &  0.1768 \tabularnewline
Sh_White & -50.8 &  33.73 & -1.5060e+00 &  0.1327 &  0.06636 \tabularnewline
Sh_Black & -180.4 &  34.12 & -5.2890e+00 &  1.917e-07 &  9.586e-08 \tabularnewline
Sh_Hisp & -167.8 &  35.52 & -4.7230e+00 &  3.096e-06 &  1.548e-06 \tabularnewline
\hline
\end{tabular}
%Source: https://freestatistics.org/blog/index.php?pk=308799&T=2

[TABLE]
[ROW][C]Multiple Linear Regression - Ordinary Least Squares[/C][/ROW]
[ROW][C]Variable[/C][C]Parameter[/C][C]S.D.[/C][C]T-STATH0: parameter = 0[/C][C]2-tail p-value[/C][C]1-tail p-value[/C][/ROW]
[ROW][C](Intercept)[/C][C]+3.493e+04[/C][C] 3210[/C][C]+1.0880e+01[/C][C] 1.118e-24[/C][C] 5.589e-25[/C][/ROW]
[ROW][C]Age[/C][C]-28.07[/C][C] 30.23[/C][C]-9.2850e-01[/C][C] 0.3536[/C][C] 0.1768[/C][/ROW]
[ROW][C]Sh_White[/C][C]-50.8[/C][C] 33.73[/C][C]-1.5060e+00[/C][C] 0.1327[/C][C] 0.06636[/C][/ROW]
[ROW][C]Sh_Black[/C][C]-180.4[/C][C] 34.12[/C][C]-5.2890e+00[/C][C] 1.917e-07[/C][C] 9.586e-08[/C][/ROW]
[ROW][C]Sh_Hisp[/C][C]-167.8[/C][C] 35.52[/C][C]-4.7230e+00[/C][C] 3.096e-06[/C][C] 1.548e-06[/C][/ROW]
[/TABLE]
Source: https://freestatistics.org/blog/index.php?pk=308799&T=2

Globally Unique Identifier (entire table): ba.freestatistics.org/blog/index.php?pk=308799&T=2

As an alternative you can also use a QR Code:  

The GUIDs for individual cells are displayed in the table below:

Multiple Linear Regression - Ordinary Least Squares
VariableParameterS.D.T-STATH0: parameter = 02-tail p-value1-tail p-value
(Intercept)+3.493e+04 3210+1.0880e+01 1.118e-24 5.589e-25
Age-28.07 30.23-9.2850e-01 0.3536 0.1768
Sh_White-50.8 33.73-1.5060e+00 0.1327 0.06636
Sh_Black-180.4 34.12-5.2890e+00 1.917e-07 9.586e-08
Sh_Hisp-167.8 35.52-4.7230e+00 3.096e-06 1.548e-06


Multiple Linear Regression - Regression Statistics
Multiple R 0.4251
R-squared 0.1807
Adjusted R-squared 0.1735
F-TEST (value) 25.15
F-TEST (DF numerator)4
F-TEST (DF denominator)456
p-value 0
Multiple Linear Regression - Residual Statistics
Residual Standard Deviation 8236
Sum Squared Residuals 3.093e+10

\begin{tabular}{lllllllll}
\hline
Multiple Linear Regression - Regression Statistics \tabularnewline
Multiple R &  0.4251 \tabularnewline
R-squared &  0.1807 \tabularnewline
Adjusted R-squared &  0.1735 \tabularnewline
F-TEST (value) &  25.15 \tabularnewline
F-TEST (DF numerator) & 4 \tabularnewline
F-TEST (DF denominator) & 456 \tabularnewline
p-value &  0 \tabularnewline
Multiple Linear Regression - Residual Statistics \tabularnewline
Residual Standard Deviation &  8236 \tabularnewline
Sum Squared Residuals &  3.093e+10 \tabularnewline
\hline
\end{tabular}
%Source: https://freestatistics.org/blog/index.php?pk=308799&T=3

[TABLE]
[ROW][C]Multiple Linear Regression - Regression Statistics[/C][/ROW]
[ROW][C]Multiple R[/C][C] 0.4251[/C][/ROW]
[ROW][C]R-squared[/C][C] 0.1807[/C][/ROW]
[ROW][C]Adjusted R-squared[/C][C] 0.1735[/C][/ROW]
[ROW][C]F-TEST (value)[/C][C] 25.15[/C][/ROW]
[ROW][C]F-TEST (DF numerator)[/C][C]4[/C][/ROW]
[ROW][C]F-TEST (DF denominator)[/C][C]456[/C][/ROW]
[ROW][C]p-value[/C][C] 0[/C][/ROW]
[ROW][C]Multiple Linear Regression - Residual Statistics[/C][/ROW]
[ROW][C]Residual Standard Deviation[/C][C] 8236[/C][/ROW]
[ROW][C]Sum Squared Residuals[/C][C] 3.093e+10[/C][/ROW]
[/TABLE]
Source: https://freestatistics.org/blog/index.php?pk=308799&T=3

Globally Unique Identifier (entire table): ba.freestatistics.org/blog/index.php?pk=308799&T=3

As an alternative you can also use a QR Code:  

The GUIDs for individual cells are displayed in the table below:

Multiple Linear Regression - Regression Statistics
Multiple R 0.4251
R-squared 0.1807
Adjusted R-squared 0.1735
F-TEST (value) 25.15
F-TEST (DF numerator)4
F-TEST (DF denominator)456
p-value 0
Multiple Linear Regression - Residual Statistics
Residual Standard Deviation 8236
Sum Squared Residuals 3.093e+10


Menu of Residual Diagnostics
DescriptionLink
HistogramCompute
Central TendencyCompute
QQ PlotCompute
Kernel Density PlotCompute
Skewness/Kurtosis TestCompute
Skewness-Kurtosis PlotCompute
Harrell-Davis PlotCompute
Bootstrap Plot -- Central TendencyCompute
Blocked Bootstrap Plot -- Central TendencyCompute
(Partial) Autocorrelation PlotCompute
Spectral AnalysisCompute
Tukey lambda PPCC PlotCompute
Box-Cox Normality PlotCompute
Summary StatisticsCompute

\begin{tabular}{lllllllll}
\hline
Menu of Residual Diagnostics \tabularnewline
Description & Link \tabularnewline
Histogram & Compute \tabularnewline
Central Tendency & Compute \tabularnewline
QQ Plot & Compute \tabularnewline
Kernel Density Plot & Compute \tabularnewline
Skewness/Kurtosis Test & Compute \tabularnewline
Skewness-Kurtosis Plot & Compute \tabularnewline
Harrell-Davis Plot & Compute \tabularnewline
Bootstrap Plot -- Central Tendency & Compute \tabularnewline
Blocked Bootstrap Plot -- Central Tendency & Compute \tabularnewline
(Partial) Autocorrelation Plot & Compute \tabularnewline
Spectral Analysis & Compute \tabularnewline
Tukey lambda PPCC Plot & Compute \tabularnewline
Box-Cox Normality Plot & Compute \tabularnewline
Summary Statistics & Compute \tabularnewline
\hline
\end{tabular}
%Source: https://freestatistics.org/blog/index.php?pk=308799&T=4

[TABLE]
[ROW][C]Menu of Residual Diagnostics[/C][/ROW]
[ROW][C]Description[/C][C]Link[/C][/ROW]
[ROW][C]Histogram[/C][C]Compute[/C][/ROW]
[ROW][C]Central Tendency[/C][C]Compute[/C][/ROW]
[ROW][C]QQ Plot[/C][C]Compute[/C][/ROW]
[ROW][C]Kernel Density Plot[/C][C]Compute[/C][/ROW]
[ROW][C]Skewness/Kurtosis Test[/C][C]Compute[/C][/ROW]
[ROW][C]Skewness-Kurtosis Plot[/C][C]Compute[/C][/ROW]
[ROW][C]Harrell-Davis Plot[/C][C]Compute[/C][/ROW]
[ROW][C]Bootstrap Plot -- Central Tendency[/C][C]Compute[/C][/ROW]
[ROW][C]Blocked Bootstrap Plot -- Central Tendency[/C][C]Compute[/C][/ROW]
[ROW][C](Partial) Autocorrelation Plot[/C][C]Compute[/C][/ROW]
[ROW][C]Spectral Analysis[/C][C]Compute[/C][/ROW]
[ROW][C]Tukey lambda PPCC Plot[/C][C]Compute[/C][/ROW]
[ROW][C]Box-Cox Normality Plot[/C][C]Compute[/C][/ROW]
[ROW][C]Summary Statistics[/C][C]Compute[/C][/ROW]
[/TABLE]
Source: https://freestatistics.org/blog/index.php?pk=308799&T=4

Globally Unique Identifier (entire table): ba.freestatistics.org/blog/index.php?pk=308799&T=4

As an alternative you can also use a QR Code:  

The GUIDs for individual cells are displayed in the table below:

Menu of Residual Diagnostics
DescriptionLink
HistogramCompute
Central TendencyCompute
QQ PlotCompute
Kernel Density PlotCompute
Skewness/Kurtosis TestCompute
Skewness-Kurtosis PlotCompute
Harrell-Davis PlotCompute
Bootstrap Plot -- Central TendencyCompute
Blocked Bootstrap Plot -- Central TendencyCompute
(Partial) Autocorrelation PlotCompute
Spectral AnalysisCompute
Tukey lambda PPCC PlotCompute
Box-Cox Normality PlotCompute
Summary StatisticsCompute


Ramsey RESET F-Test for powers (2 and 3) of fitted values
> reset_test_fitted
	RESET test
data:  mylm
RESET = 1.7035, df1 = 2, df2 = 454, p-value = 0.1832
Ramsey RESET F-Test for powers (2 and 3) of regressors
> reset_test_regressors
	RESET test
data:  mylm
RESET = 1.6842, df1 = 8, df2 = 448, p-value = 0.09993
Ramsey RESET F-Test for powers (2 and 3) of principal components
> reset_test_principal_components
	RESET test
data:  mylm
RESET = 0.17128, df1 = 2, df2 = 454, p-value = 0.8426

\begin{tabular}{lllllllll}
\hline
Ramsey RESET F-Test for powers (2 and 3) of fitted values \tabularnewline
> reset_test_fitted
	RESET test
data:  mylm
RESET = 1.7035, df1 = 2, df2 = 454, p-value = 0.1832
\tabularnewline Ramsey RESET F-Test for powers (2 and 3) of regressors \tabularnewline
> reset_test_regressors
	RESET test
data:  mylm
RESET = 1.6842, df1 = 8, df2 = 448, p-value = 0.09993
\tabularnewline Ramsey RESET F-Test for powers (2 and 3) of principal components \tabularnewline
> reset_test_principal_components
	RESET test
data:  mylm
RESET = 0.17128, df1 = 2, df2 = 454, p-value = 0.8426
\tabularnewline \hline \end{tabular} %Source: https://freestatistics.org/blog/index.php?pk=308799&T=5

[TABLE]
[ROW][C]Ramsey RESET F-Test for powers (2 and 3) of fitted values[/C][/ROW]
[ROW][C]
> reset_test_fitted
	RESET test
data:  mylm
RESET = 1.7035, df1 = 2, df2 = 454, p-value = 0.1832
[/C][/ROW] [ROW][C]Ramsey RESET F-Test for powers (2 and 3) of regressors[/C][/ROW] [ROW][C]
> reset_test_regressors
	RESET test
data:  mylm
RESET = 1.6842, df1 = 8, df2 = 448, p-value = 0.09993
[/C][/ROW] [ROW][C]Ramsey RESET F-Test for powers (2 and 3) of principal components[/C][/ROW] [ROW][C]
> reset_test_principal_components
	RESET test
data:  mylm
RESET = 0.17128, df1 = 2, df2 = 454, p-value = 0.8426
[/C][/ROW] [/TABLE] Source: https://freestatistics.org/blog/index.php?pk=308799&T=5

Globally Unique Identifier (entire table): ba.freestatistics.org/blog/index.php?pk=308799&T=5

As an alternative you can also use a QR Code:  

The GUIDs for individual cells are displayed in the table below:

Ramsey RESET F-Test for powers (2 and 3) of fitted values
> reset_test_fitted
	RESET test
data:  mylm
RESET = 1.7035, df1 = 2, df2 = 454, p-value = 0.1832
Ramsey RESET F-Test for powers (2 and 3) of regressors
> reset_test_regressors
	RESET test
data:  mylm
RESET = 1.6842, df1 = 8, df2 = 448, p-value = 0.09993
Ramsey RESET F-Test for powers (2 and 3) of principal components
> reset_test_principal_components
	RESET test
data:  mylm
RESET = 0.17128, df1 = 2, df2 = 454, p-value = 0.8426


Variance Inflation Factors (Multicollinearity)
> vif
     Age Sh_White Sh_Black  Sh_Hisp 
1.042274 6.907861 4.917774 5.187106 

\begin{tabular}{lllllllll}
\hline
Variance Inflation Factors (Multicollinearity) \tabularnewline
> vif
     Age Sh_White Sh_Black  Sh_Hisp 
1.042274 6.907861 4.917774 5.187106 
\tabularnewline \hline \end{tabular} %Source: https://freestatistics.org/blog/index.php?pk=308799&T=6

[TABLE]
[ROW][C]Variance Inflation Factors (Multicollinearity)[/C][/ROW]
[ROW][C]
> vif
     Age Sh_White Sh_Black  Sh_Hisp 
1.042274 6.907861 4.917774 5.187106 
[/C][/ROW] [/TABLE] Source: https://freestatistics.org/blog/index.php?pk=308799&T=6

Globally Unique Identifier (entire table): ba.freestatistics.org/blog/index.php?pk=308799&T=6

As an alternative you can also use a QR Code:  

The GUIDs for individual cells are displayed in the table below:

Variance Inflation Factors (Multicollinearity)
> vif
     Age Sh_White Sh_Black  Sh_Hisp 
1.042274 6.907861 4.917774 5.187106 


Parameters (Session):
par1 = 1 ; par2 = Do not include Seasonal Dummies ; par3 = No Linear Trend ; par4 = 1 ; par5 = 1 ; par6 = 12 ;
Parameters (R input):
par1 = 1 ; par2 = Do not include Seasonal Dummies ; par3 = No Linear Trend ; par4 = 0 ; par5 = 0 ; par6 = 12 ;
R code (references can be found in the software module):
par6 <- '12'
par5 <- '0'
par4 <- '0'
par3 <- 'No Linear Trend'
par2 <- 'Do not include Seasonal Dummies'
par1 <- '1'
library(lattice)
library(lmtest)
library(car)
library(MASS)
n25 <- 25 #minimum number of obs. for Goldfeld-Quandt test
mywarning <- ''
par6 <- as.numeric(par6)
if(is.na(par6)) {
par6 <- 12
mywarning = 'Warning: you did not specify the seasonality. The seasonal period was set to s = 12.'
}
par1 <- as.numeric(par1)
if(is.na(par1)) {
par1 <- 1
mywarning = 'Warning: you did not specify the column number of the endogenous series! The first column was selected by default.'
}
if (par4=='') par4 <- 0
par4 <- as.numeric(par4)
if (!is.numeric(par4)) par4 <- 0
if (par5=='') par5 <- 0
par5 <- as.numeric(par5)
if (!is.numeric(par5)) par5 <- 0
x <- na.omit(t(y))
k <- length(x[1,])
n <- length(x[,1])
x1 <- cbind(x[,par1], x[,1:k!=par1])
mycolnames <- c(colnames(x)[par1], colnames(x)[1:k!=par1])
colnames(x1) <- mycolnames #colnames(x)[par1]
x <- x1
if (par3 == 'First Differences'){
(n <- n -1)
x2 <- array(0, dim=c(n,k), dimnames=list(1:n, paste('(1-B)',colnames(x),sep='')))
for (i in 1:n) {
for (j in 1:k) {
x2[i,j] <- x[i+1,j] - x[i,j]
}
}
x <- x2
}
if (par3 == 'Seasonal Differences (s)'){
(n <- n - par6)
x2 <- array(0, dim=c(n,k), dimnames=list(1:n, paste('(1-Bs)',colnames(x),sep='')))
for (i in 1:n) {
for (j in 1:k) {
x2[i,j] <- x[i+par6,j] - x[i,j]
}
}
x <- x2
}
if (par3 == 'First and Seasonal Differences (s)'){
(n <- n -1)
x2 <- array(0, dim=c(n,k), dimnames=list(1:n, paste('(1-B)',colnames(x),sep='')))
for (i in 1:n) {
for (j in 1:k) {
x2[i,j] <- x[i+1,j] - x[i,j]
}
}
x <- x2
(n <- n - par6)
x2 <- array(0, dim=c(n,k), dimnames=list(1:n, paste('(1-Bs)',colnames(x),sep='')))
for (i in 1:n) {
for (j in 1:k) {
x2[i,j] <- x[i+par6,j] - x[i,j]
}
}
x <- x2
}
if(par4 > 0) {
x2 <- array(0, dim=c(n-par4,par4), dimnames=list(1:(n-par4), paste(colnames(x)[par1],'(t-',1:par4,')',sep='')))
for (i in 1:(n-par4)) {
for (j in 1:par4) {
x2[i,j] <- x[i+par4-j,par1]
}
}
x <- cbind(x[(par4+1):n,], x2)
n <- n - par4
}
if(par5 > 0) {
x2 <- array(0, dim=c(n-par5*par6,par5), dimnames=list(1:(n-par5*par6), paste(colnames(x)[par1],'(t-',1:par5,'s)',sep='')))
for (i in 1:(n-par5*par6)) {
for (j in 1:par5) {
x2[i,j] <- x[i+par5*par6-j*par6,par1]
}
}
x <- cbind(x[(par5*par6+1):n,], x2)
n <- n - par5*par6
}
if (par2 == 'Include Seasonal Dummies'){
x2 <- array(0, dim=c(n,par6-1), dimnames=list(1:n, paste('M', seq(1:(par6-1)), sep ='')))
for (i in 1:(par6-1)){
x2[seq(i,n,par6),i] <- 1
}
x <- cbind(x, x2)
}
if (par2 == 'Include Monthly Dummies'){
x2 <- array(0, dim=c(n,11), dimnames=list(1:n, paste('M', seq(1:11), sep ='')))
for (i in 1:11){
x2[seq(i,n,12),i] <- 1
}
x <- cbind(x, x2)
}
if (par2 == 'Include Quarterly Dummies'){
x2 <- array(0, dim=c(n,3), dimnames=list(1:n, paste('Q', seq(1:3), sep ='')))
for (i in 1:3){
x2[seq(i,n,4),i] <- 1
}
x <- cbind(x, x2)
}
(k <- length(x[n,]))
if (par3 == 'Linear Trend'){
x <- cbind(x, c(1:n))
colnames(x)[k+1] <- 't'
}
print(x)
(k <- length(x[n,]))
head(x)
df <- as.data.frame(x)
(mylm <- lm(df))
(mysum <- summary(mylm))
if (n > n25) {
kp3 <- k + 3
nmkm3 <- n - k - 3
gqarr <- array(NA, dim=c(nmkm3-kp3+1,3))
numgqtests <- 0
numsignificant1 <- 0
numsignificant5 <- 0
numsignificant10 <- 0
for (mypoint in kp3:nmkm3) {
j <- 0
numgqtests <- numgqtests + 1
for (myalt in c('greater', 'two.sided', 'less')) {
j <- j + 1
gqarr[mypoint-kp3+1,j] <- gqtest(mylm, point=mypoint, alternative=myalt)$p.value
}
if (gqarr[mypoint-kp3+1,2] < 0.01) numsignificant1 <- numsignificant1 + 1
if (gqarr[mypoint-kp3+1,2] < 0.05) numsignificant5 <- numsignificant5 + 1
if (gqarr[mypoint-kp3+1,2] < 0.10) numsignificant10 <- numsignificant10 + 1
}
gqarr
}
bitmap(file='test0.png')
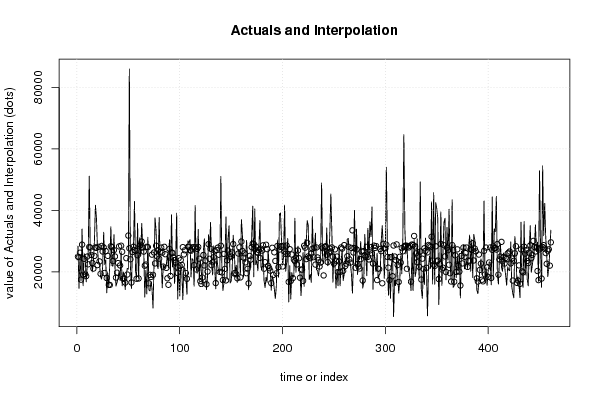
plot(x[,1], type='l', main='Actuals and Interpolation', ylab='value of Actuals and Interpolation (dots)', xlab='time or index')
points(x[,1]-mysum$resid)
grid()
dev.off()
bitmap(file='test1.png')
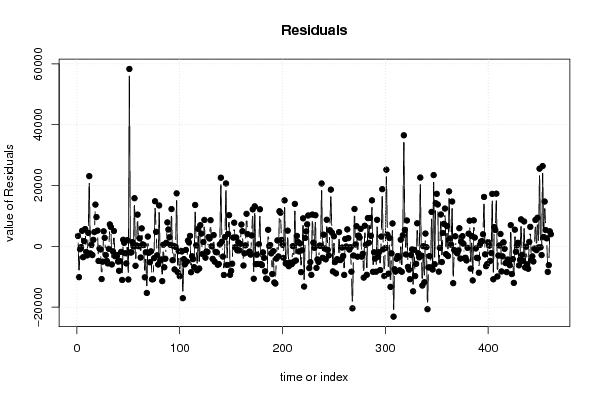
plot(mysum$resid, type='b', pch=19, main='Residuals', ylab='value of Residuals', xlab='time or index')
grid()
dev.off()
bitmap(file='test2.png')
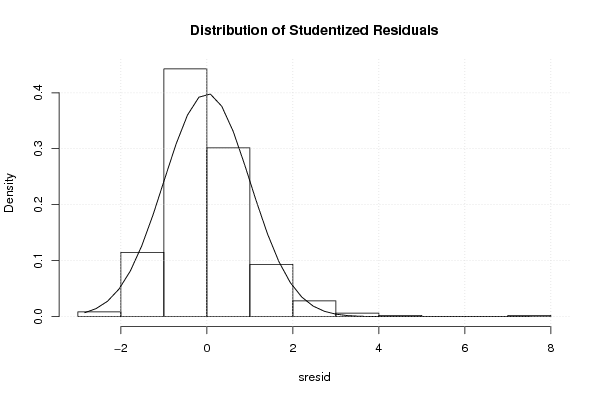
sresid <- studres(mylm)
hist(sresid, freq=FALSE, main='Distribution of Studentized Residuals')
xfit<-seq(min(sresid),max(sresid),length=40)
yfit<-dnorm(xfit)
lines(xfit, yfit)
grid()
dev.off()
bitmap(file='test3.png')
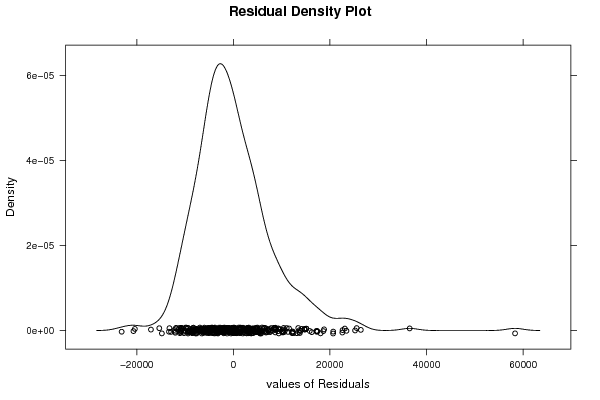
densityplot(~mysum$resid,col='black',main='Residual Density Plot', xlab='values of Residuals')
dev.off()
bitmap(file='test4.png')
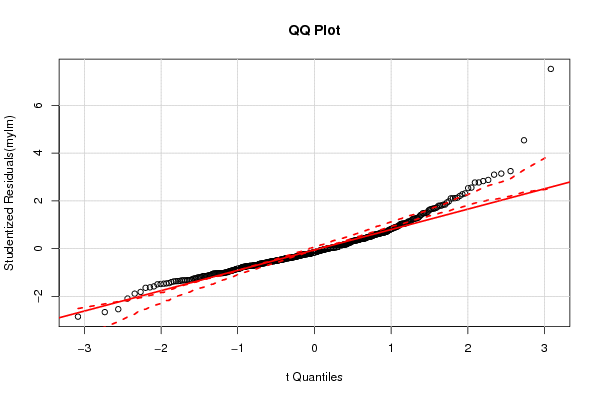
qqPlot(mylm, main='QQ Plot')
grid()
dev.off()
(myerror <- as.ts(mysum$resid))
bitmap(file='test5.png')
dum <- cbind(lag(myerror,k=1),myerror)
dum
dum1 <- dum[2:length(myerror),]
dum1
z <- as.data.frame(dum1)
print(z)
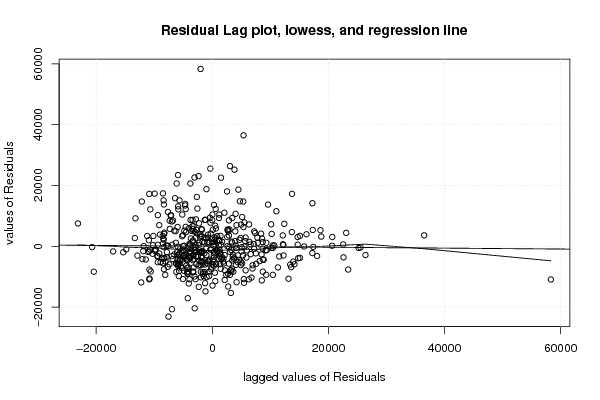
plot(z,main=paste('Residual Lag plot, lowess, and regression line'), ylab='values of Residuals', xlab='lagged values of Residuals')
lines(lowess(z))
abline(lm(z))
grid()
dev.off()
bitmap(file='test6.png')
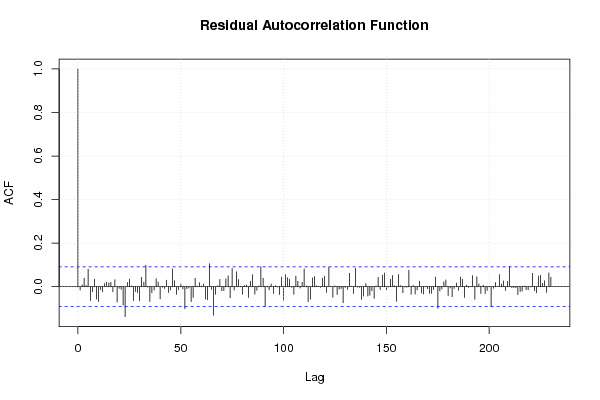
acf(mysum$resid, lag.max=length(mysum$resid)/2, main='Residual Autocorrelation Function')
grid()
dev.off()
bitmap(file='test7.png')
pacf(mysum$resid, lag.max=length(mysum$resid)/2, main='Residual Partial Autocorrelation Function')
grid()
dev.off()
bitmap(file='test8.png')
opar <- par(mfrow = c(2,2), oma = c(0, 0, 1.1, 0))
plot(mylm, las = 1, sub='Residual Diagnostics')
par(opar)
dev.off()
if (n > n25) {
bitmap(file='test9.png')
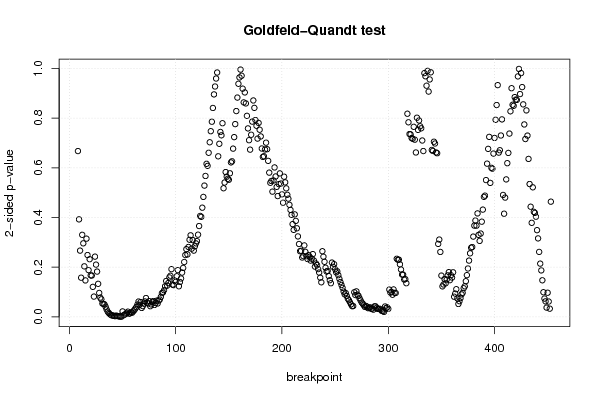
plot(kp3:nmkm3,gqarr[,2], main='Goldfeld-Quandt test',ylab='2-sided p-value',xlab='breakpoint')
grid()
dev.off()
}
load(file='createtable')
a<-table.start()
a<-table.row.start(a)
a<-table.element(a, 'Multiple Linear Regression - Estimated Regression Equation', 1, TRUE)
a<-table.row.end(a)
myeq <- colnames(x)[1]
myeq <- paste(myeq, '[t] = ', sep='')
for (i in 1:k){
if (mysum$coefficients[i,1] > 0) myeq <- paste(myeq, '+', '')
myeq <- paste(myeq, signif(mysum$coefficients[i,1],6), sep=' ')
if (rownames(mysum$coefficients)[i] != '(Intercept)') {
myeq <- paste(myeq, rownames(mysum$coefficients)[i], sep='')
if (rownames(mysum$coefficients)[i] != 't') myeq <- paste(myeq, '[t]', sep='')
}
}
myeq <- paste(myeq, ' + e[t]')
a<-table.row.start(a)
a<-table.element(a, myeq)
a<-table.row.end(a)
a<-table.row.start(a)
a<-table.element(a, mywarning)
a<-table.row.end(a)
a<-table.end(a)
table.save(a,file='mytable1.tab')
a<-table.start()
a<-table.row.start(a)
a<-table.element(a,'Multiple Linear Regression - Ordinary Least Squares', 6, TRUE)
a<-table.row.end(a)
a<-table.row.start(a)
a<-table.element(a,'Variable',header=TRUE)
a<-table.element(a,'Parameter',header=TRUE)
a<-table.element(a,'S.D.',header=TRUE)
a<-table.element(a,'T-STAT
H0: parameter = 0',header=TRUE)
a<-table.element(a,'2-tail p-value',header=TRUE)
a<-table.element(a,'1-tail p-value',header=TRUE)
a<-table.row.end(a)
for (i in 1:k){
a<-table.row.start(a)
a<-table.element(a,rownames(mysum$coefficients)[i],header=TRUE)
a<-table.element(a,formatC(signif(mysum$coefficients[i,1],5),format='g',flag='+'))
a<-table.element(a,formatC(signif(mysum$coefficients[i,2],5),format='g',flag=' '))
a<-table.element(a,formatC(signif(mysum$coefficients[i,3],4),format='e',flag='+'))
a<-table.element(a,formatC(signif(mysum$coefficients[i,4],4),format='g',flag=' '))
a<-table.element(a,formatC(signif(mysum$coefficients[i,4]/2,4),format='g',flag=' '))
a<-table.row.end(a)
}
a<-table.end(a)
table.save(a,file='mytable2.tab')
a<-table.start()
a<-table.row.start(a)
a<-table.element(a, 'Multiple Linear Regression - Regression Statistics', 2, TRUE)
a<-table.row.end(a)
a<-table.row.start(a)
a<-table.element(a, 'Multiple R',1,TRUE)
a<-table.element(a,formatC(signif(sqrt(mysum$r.squared),6),format='g',flag=' '))
a<-table.row.end(a)
a<-table.row.start(a)
a<-table.element(a, 'R-squared',1,TRUE)
a<-table.element(a,formatC(signif(mysum$r.squared,6),format='g',flag=' '))
a<-table.row.end(a)
a<-table.row.start(a)
a<-table.element(a, 'Adjusted R-squared',1,TRUE)
a<-table.element(a,formatC(signif(mysum$adj.r.squared,6),format='g',flag=' '))
a<-table.row.end(a)
a<-table.row.start(a)
a<-table.element(a, 'F-TEST (value)',1,TRUE)
a<-table.element(a,formatC(signif(mysum$fstatistic[1],6),format='g',flag=' '))
a<-table.row.end(a)
a<-table.row.start(a)
a<-table.element(a, 'F-TEST (DF numerator)',1,TRUE)
a<-table.element(a, signif(mysum$fstatistic[2],6))
a<-table.row.end(a)
a<-table.row.start(a)
a<-table.element(a, 'F-TEST (DF denominator)',1,TRUE)
a<-table.element(a, signif(mysum$fstatistic[3],6))
a<-table.row.end(a)
a<-table.row.start(a)
a<-table.element(a, 'p-value',1,TRUE)
a<-table.element(a,formatC(signif(1-pf(mysum$fstatistic[1],mysum$fstatistic[2],mysum$fstatistic[3]),6),format='g',flag=' '))
a<-table.row.end(a)
a<-table.row.start(a)
a<-table.element(a, 'Multiple Linear Regression - Residual Statistics', 2, TRUE)
a<-table.row.end(a)
a<-table.row.start(a)
a<-table.element(a, 'Residual Standard Deviation',1,TRUE)
a<-table.element(a,formatC(signif(mysum$sigma,6),format='g',flag=' '))
a<-table.row.end(a)
a<-table.row.start(a)
a<-table.element(a, 'Sum Squared Residuals',1,TRUE)
a<-table.element(a,formatC(signif(sum(myerror*myerror),6),format='g',flag=' '))
a<-table.row.end(a)
a<-table.end(a)
table.save(a,file='mytable3.tab')
myr <- as.numeric(mysum$resid)
myr
a <-table.start()
a <- table.row.start(a)
a <- table.element(a,'Menu of Residual Diagnostics',2,TRUE)
a <- table.row.end(a)
a <- table.row.start(a)
a <- table.element(a,'Description',1,TRUE)
a <- table.element(a,'Link',1,TRUE)
a <- table.row.end(a)
a <- table.row.start(a)
a <-table.element(a,'Histogram',1,header=TRUE)
a <- table.element(a,hyperlink( paste('https://supernova.wessa.net/rwasp_histogram.wasp?convertgetintopost=1&data=',paste(as.character(mysum$resid),sep='',collapse=' '),sep='') ,'Compute','Click here to examine the Residuals.'),1)
a <- table.row.end(a)
a <- table.row.start(a)
a <-table.element(a,'Central Tendency',1,header=TRUE)
a <- table.element(a,hyperlink( paste('https://supernova.wessa.net/rwasp_centraltendency.wasp?convertgetintopost=1&data=',paste(as.character(mysum$resid),sep='',collapse=' '),sep='') ,'Compute','Click here to examine the Residuals.'),1)
a <- table.row.end(a)
a <- table.row.start(a)
a <-table.element(a,'QQ Plot',1,header=TRUE)
a <- table.element(a,hyperlink( paste('https://supernova.wessa.net/rwasp_fitdistrnorm.wasp?convertgetintopost=1&data=',paste(as.character(mysum$resid),sep='',collapse=' '),sep='') ,'Compute','Click here to examine the Residuals.'),1)
a <- table.row.end(a)
a <- table.row.start(a)
a <-table.element(a,'Kernel Density Plot',1,header=TRUE)
a <- table.element(a,hyperlink( paste('https://supernova.wessa.net/rwasp_density.wasp?convertgetintopost=1&data=',paste(as.character(mysum$resid),sep='',collapse=' '),sep='') ,'Compute','Click here to examine the Residuals.'),1)
a <- table.row.end(a)
a <- table.row.start(a)
a <-table.element(a,'Skewness/Kurtosis Test',1,header=TRUE)
a <- table.element(a,hyperlink( paste('https://supernova.wessa.net/rwasp_skewness_kurtosis.wasp?convertgetintopost=1&data=',paste(as.character(mysum$resid),sep='',collapse=' '),sep='') ,'Compute','Click here to examine the Residuals.'),1)
a <- table.row.end(a)
a <- table.row.start(a)
a <-table.element(a,'Skewness-Kurtosis Plot',1,header=TRUE)
a <- table.element(a,hyperlink( paste('https://supernova.wessa.net/rwasp_skewness_kurtosis_plot.wasp?convertgetintopost=1&data=',paste(as.character(mysum$resid),sep='',collapse=' '),sep='') ,'Compute','Click here to examine the Residuals.'),1)
a <- table.row.end(a)
a <- table.row.start(a)
a <-table.element(a,'Harrell-Davis Plot',1,header=TRUE)
a <- table.element(a,hyperlink( paste('https://supernova.wessa.net/rwasp_harrell_davis.wasp?convertgetintopost=1&data=',paste(as.character(mysum$resid),sep='',collapse=' '),sep='') ,'Compute','Click here to examine the Residuals.'),1)
a <- table.row.end(a)
a <- table.row.start(a)
a <-table.element(a,'Bootstrap Plot -- Central Tendency',1,header=TRUE)
a <- table.element(a,hyperlink( paste('https://supernova.wessa.net/rwasp_bootstrapplot1.wasp?convertgetintopost=1&data=',paste(as.character(mysum$resid),sep='',collapse=' '),sep='') ,'Compute','Click here to examine the Residuals.'),1)
a <- table.row.end(a)
a <- table.row.start(a)
a <-table.element(a,'Blocked Bootstrap Plot -- Central Tendency',1,header=TRUE)
a <- table.element(a,hyperlink( paste('https://supernova.wessa.net/rwasp_bootstrapplot.wasp?convertgetintopost=1&data=',paste(as.character(mysum$resid),sep='',collapse=' '),sep='') ,'Compute','Click here to examine the Residuals.'),1)
a <- table.row.end(a)
a <- table.row.start(a)
a <-table.element(a,'(Partial) Autocorrelation Plot',1,header=TRUE)
a <- table.element(a,hyperlink( paste('https://supernova.wessa.net/rwasp_autocorrelation.wasp?convertgetintopost=1&data=',paste(as.character(mysum$resid),sep='',collapse=' '),sep='') ,'Compute','Click here to examine the Residuals.'),1)
a <- table.row.end(a)
a <- table.row.start(a)
a <-table.element(a,'Spectral Analysis',1,header=TRUE)
a <- table.element(a,hyperlink( paste('https://supernova.wessa.net/rwasp_spectrum.wasp?convertgetintopost=1&data=',paste(as.character(mysum$resid),sep='',collapse=' '),sep='') ,'Compute','Click here to examine the Residuals.'),1)
a <- table.row.end(a)
a <- table.row.start(a)
a <-table.element(a,'Tukey lambda PPCC Plot',1,header=TRUE)
a <- table.element(a,hyperlink( paste('https://supernova.wessa.net/rwasp_tukeylambda.wasp?convertgetintopost=1&data=',paste(as.character(mysum$resid),sep='',collapse=' '),sep='') ,'Compute','Click here to examine the Residuals.'),1)
a <- table.row.end(a)
a <- table.row.start(a)
a <-table.element(a,'Box-Cox Normality Plot',1,header=TRUE)
a <- table.element(a,hyperlink( paste('https://supernova.wessa.net/rwasp_boxcoxnorm.wasp?convertgetintopost=1&data=',paste(as.character(mysum$resid),sep='',collapse=' '),sep='') ,'Compute','Click here to examine the Residuals.'),1)
a <- table.row.end(a)
a <- table.row.start(a)
a <- table.element(a,'Summary Statistics',1,header=TRUE)
a <- table.element(a,hyperlink( paste('https://supernova.wessa.net/rwasp_summary1.wasp?convertgetintopost=1&data=',paste(as.character(mysum$resid),sep='',collapse=' '),sep='') ,'Compute','Click here to examine the Residuals.'),1)
a <- table.row.end(a)
a<-table.end(a)
table.save(a,file='mytable7.tab')
if(n < 200) {
a<-table.start()
a<-table.row.start(a)
a<-table.element(a, 'Multiple Linear Regression - Actuals, Interpolation, and Residuals', 4, TRUE)
a<-table.row.end(a)
a<-table.row.start(a)
a<-table.element(a, 'Time or Index', 1, TRUE)
a<-table.element(a, 'Actuals', 1, TRUE)
a<-table.element(a, 'Interpolation
Forecast', 1, TRUE)
a<-table.element(a, 'Residuals
Prediction Error', 1, TRUE)
a<-table.row.end(a)
for (i in 1:n) {
a<-table.row.start(a)
a<-table.element(a,i, 1, TRUE)
a<-table.element(a,formatC(signif(x[i],6),format='g',flag=' '))
a<-table.element(a,formatC(signif(x[i]-mysum$resid[i],6),format='g',flag=' '))
a<-table.element(a,formatC(signif(mysum$resid[i],6),format='g',flag=' '))
a<-table.row.end(a)
}
a<-table.end(a)
table.save(a,file='mytable4.tab')
if (n > n25) {
a<-table.start()
a<-table.row.start(a)
a<-table.element(a,'Goldfeld-Quandt test for Heteroskedasticity',4,TRUE)
a<-table.row.end(a)
a<-table.row.start(a)
a<-table.element(a,'p-values',header=TRUE)
a<-table.element(a,'Alternative Hypothesis',3,header=TRUE)
a<-table.row.end(a)
a<-table.row.start(a)
a<-table.element(a,'breakpoint index',header=TRUE)
a<-table.element(a,'greater',header=TRUE)
a<-table.element(a,'2-sided',header=TRUE)
a<-table.element(a,'less',header=TRUE)
a<-table.row.end(a)
for (mypoint in kp3:nmkm3) {
a<-table.row.start(a)
a<-table.element(a,mypoint,header=TRUE)
a<-table.element(a,formatC(signif(gqarr[mypoint-kp3+1,1],6),format='g',flag=' '))
a<-table.element(a,formatC(signif(gqarr[mypoint-kp3+1,2],6),format='g',flag=' '))
a<-table.element(a,formatC(signif(gqarr[mypoint-kp3+1,3],6),format='g',flag=' '))
a<-table.row.end(a)
}
a<-table.end(a)
table.save(a,file='mytable5.tab')
a<-table.start()
a<-table.row.start(a)
a<-table.element(a,'Meta Analysis of Goldfeld-Quandt test for Heteroskedasticity',4,TRUE)
a<-table.row.end(a)
a<-table.row.start(a)
a<-table.element(a,'Description',header=TRUE)
a<-table.element(a,'# significant tests',header=TRUE)
a<-table.element(a,'% significant tests',header=TRUE)
a<-table.element(a,'OK/NOK',header=TRUE)
a<-table.row.end(a)
a<-table.row.start(a)
a<-table.element(a,'1% type I error level',header=TRUE)
a<-table.element(a,signif(numsignificant1,6))
a<-table.element(a,formatC(signif(numsignificant1/numgqtests,6),format='g',flag=' '))
if (numsignificant1/numgqtests < 0.01) dum <- 'OK' else dum <- 'NOK'
a<-table.element(a,dum)
a<-table.row.end(a)
a<-table.row.start(a)
a<-table.element(a,'5% type I error level',header=TRUE)
a<-table.element(a,signif(numsignificant5,6))
a<-table.element(a,signif(numsignificant5/numgqtests,6))
if (numsignificant5/numgqtests < 0.05) dum <- 'OK' else dum <- 'NOK'
a<-table.element(a,dum)
a<-table.row.end(a)
a<-table.row.start(a)
a<-table.element(a,'10% type I error level',header=TRUE)
a<-table.element(a,signif(numsignificant10,6))
a<-table.element(a,signif(numsignificant10/numgqtests,6))
if (numsignificant10/numgqtests < 0.1) dum <- 'OK' else dum <- 'NOK'
a<-table.element(a,dum)
a<-table.row.end(a)
a<-table.end(a)
table.save(a,file='mytable6.tab')
}
}
a<-table.start()
a<-table.row.start(a)
a<-table.element(a,'Ramsey RESET F-Test for powers (2 and 3) of fitted values',1,TRUE)
a<-table.row.end(a)
a<-table.row.start(a)
reset_test_fitted <- resettest(mylm,power=2:3,type='fitted')
a<-table.element(a,paste('
',RC.texteval('reset_test_fitted'),'
',sep=''))
a<-table.row.end(a)
a<-table.row.start(a)
a<-table.element(a,'Ramsey RESET F-Test for powers (2 and 3) of regressors',1,TRUE)
a<-table.row.end(a)
a<-table.row.start(a)
reset_test_regressors <- resettest(mylm,power=2:3,type='regressor')
a<-table.element(a,paste('
',RC.texteval('reset_test_regressors'),'
',sep=''))
a<-table.row.end(a)
a<-table.row.start(a)
a<-table.element(a,'Ramsey RESET F-Test for powers (2 and 3) of principal components',1,TRUE)
a<-table.row.end(a)
a<-table.row.start(a)
reset_test_principal_components <- resettest(mylm,power=2:3,type='princomp')
a<-table.element(a,paste('
',RC.texteval('reset_test_principal_components'),'
',sep=''))
a<-table.row.end(a)
a<-table.end(a)
table.save(a,file='mytable8.tab')
a<-table.start()
a<-table.row.start(a)
a<-table.element(a,'Variance Inflation Factors (Multicollinearity)',1,TRUE)
a<-table.row.end(a)
a<-table.row.start(a)
vif <- vif(mylm)
a<-table.element(a,paste('
',RC.texteval('vif'),'
',sep=''))
a<-table.row.end(a)
a<-table.end(a)
table.save(a,file='mytable9.tab')