Free Statistics

of Irreproducible Research!

Author's title

Author*The author of this computation has been verified*
R Software Modulerwasp_correlation.wasp
Title produced by softwarePearson Correlation
Date of computationFri, 08 Dec 2017 11:22:56 +0100
Cite this page as followsStatistical Computations at FreeStatistics.org, Office for Research Development and Education, URL https://freestatistics.org/blog/index.php?v=date/2017/Dec/08/t1512728737div65jrwelcv5ma.htm/, Retrieved Tue, 14 May 2024 22:25:13 +0000
Statistical Computations at FreeStatistics.org, Office for Research Development and Education, URL https://freestatistics.org/blog/index.php?pk=308775, Retrieved Tue, 14 May 2024 22:25:13 +0000
QR Codes:

Original text written by user:
IsPrivate?No (this computation is public)
User-defined keywords
Estimated Impact90
Family? (F = Feedback message, R = changed R code, M = changed R Module, P = changed Parameters, D = changed Data)
-       [Pearson Correlation] [energy and popula...] [2017-12-08 10:22:56] [bcddf20144eb569f95336d17c2e1f45a] [Current]
Feedback Forum

Post a new message
Dataseries X:
729
1109
863
4051
1279
10207
2900
5539
1741
2416
7788
2124
2195
4237
3510
862
4222
6828
4016
795
3997
2482
2568
17023
2739
1219
3152
3042
2930
988
4234
10699
505
2148
1470
2275
8329
1390
984
1898
527
5025
6934
2640
2222
15531
1730
4819
6763
2141
3306
3579
2742
5427
3347
284
966
1474
2886
7458
3230
7160
331
Dataseries Y:
2913021
36117637
2877311
8363404
9054332
1240862
9490583
10895586
3722084
7395599
34005274
4417781
1112607
10474410
5547683
84107606
1331475
5363352
65027512
3926000
81776930
11121341
10000023
318041
74567511
30762701
4560155
7623600
59277417
7182390
16321581
2998083
5447900
2097555
4337141
3097282
506953
2070739
3562045
619428
32409639
16615394
4889252
38042794
10573100
1779676
20246871
142849449
27425676
7291436
5391428
2048583
46576897
9378126
7824909
7641630
10639931
72326914
45870700
8270684
62766365
309348193
23606779


Summary of computational transaction
Raw Input view raw input (R code)
Raw Outputview raw output of R engine
Computing time4 seconds
R ServerBig Analytics Cloud Computing Center

\begin{tabular}{lllllllll}
\hline
Summary of computational transaction \tabularnewline
Raw Input view raw input (R code)  \tabularnewline
Raw Outputview raw output of R engine  \tabularnewline
Computing time4 seconds \tabularnewline
R ServerBig Analytics Cloud Computing Center \tabularnewline
\hline
\end{tabular}
%Source: https://freestatistics.org/blog/index.php?pk=308775&T=0

[TABLE]
[ROW]
Summary of computational transaction[/C][/ROW] [ROW]Raw Input[/C] view raw input (R code) [/C][/ROW] [ROW]Raw Output[/C]view raw output of R engine [/C][/ROW] [ROW]Computing time[/C]4 seconds[/C][/ROW] [ROW]R Server[/C]Big Analytics Cloud Computing Center[/C][/ROW] [/TABLE] Source: https://freestatistics.org/blog/index.php?pk=308775&T=0

Globally Unique Identifier (entire table): ba.freestatistics.org/blog/index.php?pk=308775&T=0

As an alternative you can also use a QR Code:  

The GUIDs for individual cells are displayed in the table below:

Summary of computational transaction
Raw Input view raw input (R code)
Raw Outputview raw output of R engine
Computing time4 seconds
R ServerBig Analytics Cloud Computing Center


Pearson Product Moment Correlation - Ungrouped Data
StatisticVariable XVariable Y
Mean3682.6190476190524594402.5555556
Biased Variance10815283.50566892037816067823262
Biased Standard Deviation3288.6598342894845142176.1529422
Covariance6240434394.84409
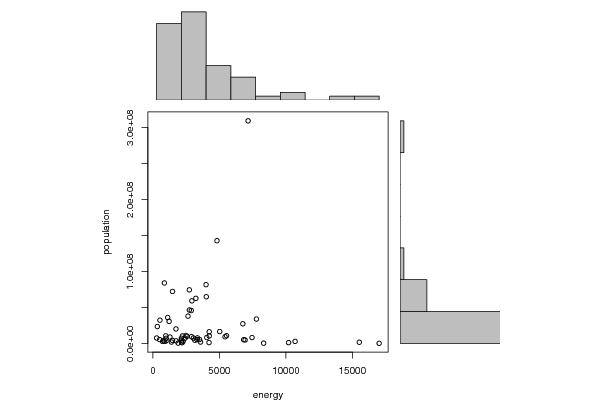
Correlation0.0413679992252343
Determination0.00171131135989898
T-Test0.323371215437988
p-value (2 sided)0.747520123417613
p-value (1 sided)0.373760061708806
95% CI of Correlation[-0.208534416220424, 0.286199616588459]
Degrees of Freedom61
Number of Observations63

\begin{tabular}{lllllllll}
\hline
Pearson Product Moment Correlation - Ungrouped Data \tabularnewline
Statistic & Variable X & Variable Y \tabularnewline
Mean & 3682.61904761905 & 24594402.5555556 \tabularnewline
Biased Variance & 10815283.5056689 & 2037816067823262 \tabularnewline
Biased Standard Deviation & 3288.65983428948 & 45142176.1529422 \tabularnewline
Covariance & 6240434394.84409 \tabularnewline
Correlation & 0.0413679992252343 \tabularnewline
Determination & 0.00171131135989898 \tabularnewline
T-Test & 0.323371215437988 \tabularnewline
p-value (2 sided) & 0.747520123417613 \tabularnewline
p-value (1 sided) & 0.373760061708806 \tabularnewline
95% CI of Correlation & [-0.208534416220424, 0.286199616588459] \tabularnewline
Degrees of Freedom & 61 \tabularnewline
Number of Observations & 63 \tabularnewline
\hline
\end{tabular}
%Source: https://freestatistics.org/blog/index.php?pk=308775&T=1

[TABLE]
[ROW][C]Pearson Product Moment Correlation - Ungrouped Data[/C][/ROW]
[ROW][C]Statistic[/C][C]Variable X[/C][C]Variable Y[/C][/ROW]
[ROW][C]Mean[/C][C]3682.61904761905[/C][C]24594402.5555556[/C][/ROW]
[ROW][C]Biased Variance[/C][C]10815283.5056689[/C][C]2037816067823262[/C][/ROW]
[ROW][C]Biased Standard Deviation[/C][C]3288.65983428948[/C][C]45142176.1529422[/C][/ROW]
[ROW][C]Covariance[/C][C]6240434394.84409[/C][/ROW]
[ROW][C]Correlation[/C][C]0.0413679992252343[/C][/ROW]
[ROW][C]Determination[/C][C]0.00171131135989898[/C][/ROW]
[ROW][C]T-Test[/C][C]0.323371215437988[/C][/ROW]
[ROW][C]p-value (2 sided)[/C][C]0.747520123417613[/C][/ROW]
[ROW][C]p-value (1 sided)[/C][C]0.373760061708806[/C][/ROW]
[ROW][C]95% CI of Correlation[/C][C][-0.208534416220424, 0.286199616588459][/C][/ROW]
[ROW][C]Degrees of Freedom[/C][C]61[/C][/ROW]
[ROW][C]Number of Observations[/C][C]63[/C][/ROW]
[/TABLE]
Source: https://freestatistics.org/blog/index.php?pk=308775&T=1

Globally Unique Identifier (entire table): ba.freestatistics.org/blog/index.php?pk=308775&T=1

As an alternative you can also use a QR Code:  

The GUIDs for individual cells are displayed in the table below:

Pearson Product Moment Correlation - Ungrouped Data
StatisticVariable XVariable Y
Mean3682.6190476190524594402.5555556
Biased Variance10815283.50566892037816067823262
Biased Standard Deviation3288.6598342894845142176.1529422
Covariance6240434394.84409
Correlation0.0413679992252343
Determination0.00171131135989898
T-Test0.323371215437988
p-value (2 sided)0.747520123417613
p-value (1 sided)0.373760061708806
95% CI of Correlation[-0.208534416220424, 0.286199616588459]
Degrees of Freedom61
Number of Observations63


Normality Tests
> jarque.x
	Jarque-Bera Normality Test
data:  x
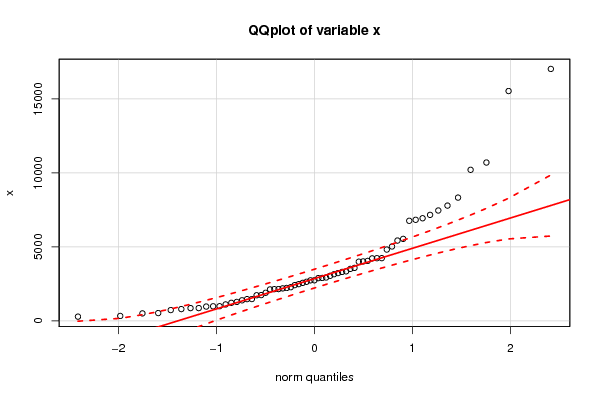
JB = 107.47, p-value < 2.2e-16
alternative hypothesis: greater
> jarque.y
	Jarque-Bera Normality Test
data:  y
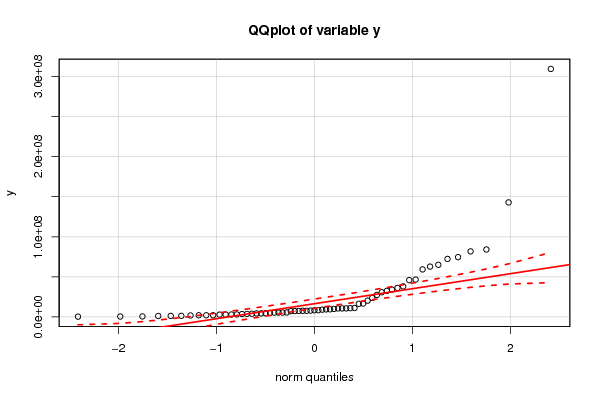
JB = 1595.3, p-value < 2.2e-16
alternative hypothesis: greater
> ad.x
	Anderson-Darling normality test
data:  x
A = 3.5661, p-value = 5.19e-09
> ad.y
	Anderson-Darling normality test
data:  y
A = 8.9932, p-value < 2.2e-16

\begin{tabular}{lllllllll}
\hline
Normality Tests \tabularnewline
> jarque.x
	Jarque-Bera Normality Test
data:  x
JB = 107.47, p-value < 2.2e-16
alternative hypothesis: greater
\tabularnewline
> jarque.y
	Jarque-Bera Normality Test
data:  y
JB = 1595.3, p-value < 2.2e-16
alternative hypothesis: greater
\tabularnewline
> ad.x
	Anderson-Darling normality test
data:  x
A = 3.5661, p-value = 5.19e-09
\tabularnewline
> ad.y
	Anderson-Darling normality test
data:  y
A = 8.9932, p-value < 2.2e-16
\tabularnewline \hline \end{tabular} %Source: https://freestatistics.org/blog/index.php?pk=308775&T=2

[TABLE]
[ROW][C]Normality Tests[/C][/ROW]
[ROW][C]
> jarque.x
	Jarque-Bera Normality Test
data:  x
JB = 107.47, p-value < 2.2e-16
alternative hypothesis: greater
[/C][/ROW] [ROW][C]
> jarque.y
	Jarque-Bera Normality Test
data:  y
JB = 1595.3, p-value < 2.2e-16
alternative hypothesis: greater
[/C][/ROW] [ROW][C]
> ad.x
	Anderson-Darling normality test
data:  x
A = 3.5661, p-value = 5.19e-09
[/C][/ROW] [ROW][C]
> ad.y
	Anderson-Darling normality test
data:  y
A = 8.9932, p-value < 2.2e-16
[/C][/ROW] [/TABLE] Source: https://freestatistics.org/blog/index.php?pk=308775&T=2

Globally Unique Identifier (entire table): ba.freestatistics.org/blog/index.php?pk=308775&T=2

As an alternative you can also use a QR Code:  

The GUIDs for individual cells are displayed in the table below:

Normality Tests
> jarque.x
	Jarque-Bera Normality Test
data:  x
JB = 107.47, p-value < 2.2e-16
alternative hypothesis: greater
> jarque.y
	Jarque-Bera Normality Test
data:  y
JB = 1595.3, p-value < 2.2e-16
alternative hypothesis: greater
> ad.x
	Anderson-Darling normality test
data:  x
A = 3.5661, p-value = 5.19e-09
> ad.y
	Anderson-Darling normality test
data:  y
A = 8.9932, p-value < 2.2e-16


Parameters (Session):
Parameters (R input):
R code (references can be found in the software module):
library(psychometric)
x <- x[!is.na(y)]
y <- y[!is.na(y)]
y <- y[!is.na(x)]
x <- x[!is.na(x)]
bitmap(file='test1.png')
histx <- hist(x, plot=FALSE)
histy <- hist(y, plot=FALSE)
maxcounts <- max(c(histx$counts, histx$counts))
xrange <- c(min(x),max(x))
yrange <- c(min(y),max(y))
nf <- layout(matrix(c(2,0,1,3),2,2,byrow=TRUE), c(3,1), c(1,3), TRUE)
par(mar=c(4,4,1,1))
plot(x, y, xlim=xrange, ylim=yrange, xlab=xlab, ylab=ylab, sub=main)
par(mar=c(0,4,1,1))
barplot(histx$counts, axes=FALSE, ylim=c(0, maxcounts), space=0)
par(mar=c(4,0,1,1))
barplot(histy$counts, axes=FALSE, xlim=c(0, maxcounts), space=0, horiz=TRUE)
dev.off()
lx = length(x)
makebiased = (lx-1)/lx
varx = var(x)*makebiased
vary = var(y)*makebiased
corxy <- cor.test(x,y,method='pearson', na.rm = T)
cxy <- as.matrix(corxy$estimate)[1,1]
load(file='createtable')
a<-table.start()
a<-table.row.start(a)
a<-table.element(a,'Pearson Product Moment Correlation - Ungrouped Data',3,TRUE)
a<-table.row.end(a)
a<-table.row.start(a)
a<-table.element(a,'Statistic',1,TRUE)
a<-table.element(a,'Variable X',1,TRUE)
a<-table.element(a,'Variable Y',1,TRUE)
a<-table.row.end(a)
a<-table.row.start(a)
a<-table.element(a,'Mean',header=TRUE)
a<-table.element(a,mean(x))
a<-table.element(a,mean(y))
a<-table.row.end(a)
a<-table.row.start(a)
a<-table.element(a,'Biased Variance',header=TRUE)
a<-table.element(a,varx)
a<-table.element(a,vary)
a<-table.row.end(a)
a<-table.row.start(a)
a<-table.element(a,'Biased Standard Deviation',header=TRUE)
a<-table.element(a,sqrt(varx))
a<-table.element(a,sqrt(vary))
a<-table.row.end(a)
a<-table.row.start(a)
a<-table.element(a,'Covariance',header=TRUE)
a<-table.element(a,cov(x,y),2)
a<-table.row.end(a)
a<-table.row.start(a)
a<-table.element(a,'Correlation',header=TRUE)
a<-table.element(a,cxy,2)
a<-table.row.end(a)
a<-table.row.start(a)
a<-table.element(a,'Determination',header=TRUE)
a<-table.element(a,cxy*cxy,2)
a<-table.row.end(a)
a<-table.row.start(a)
a<-table.element(a,'T-Test',header=TRUE)
a<-table.element(a,as.matrix(corxy$statistic)[1,1],2)
a<-table.row.end(a)
a<-table.row.start(a)
a<-table.element(a,'p-value (2 sided)',header=TRUE)
a<-table.element(a,(p2 <- as.matrix(corxy$p.value)[1,1]),2)
a<-table.row.end(a)
a<-table.row.start(a)
a<-table.element(a,'p-value (1 sided)',header=TRUE)
a<-table.element(a,p2/2,2)
a<-table.row.end(a)
a<-table.row.start(a)
a<-table.element(a,'95% CI of Correlation',header=TRUE)
a<-table.element(a,paste('[',CIr(r=cxy, n = lx, level = .95)[1],', ', CIr(r=cxy, n = lx, level = .95)[2],']',sep=''),2)
a<-table.row.end(a)
a<-table.row.start(a)
a<-table.element(a,'Degrees of Freedom',header=TRUE)
a<-table.element(a,lx-2,2)
a<-table.row.end(a)
a<-table.row.start(a)
a<-table.element(a,'Number of Observations',header=TRUE)
a<-table.element(a,lx,2)
a<-table.row.end(a)
a<-table.end(a)
table.save(a,file='mytable.tab')
library(moments)
library(nortest)
jarque.x <- jarque.test(x)
jarque.y <- jarque.test(y)
if(lx>7) {
ad.x <- ad.test(x)
ad.y <- ad.test(y)
}
a<-table.start()
a<-table.row.start(a)
a<-table.element(a,'Normality Tests',1,TRUE)
a<-table.row.end(a)
a<-table.row.start(a)
a<-table.element(a,paste('
',RC.texteval('jarque.x'),'
',sep=''))
a<-table.row.end(a)
a<-table.row.start(a)
a<-table.element(a,paste('
',RC.texteval('jarque.y'),'
',sep=''))
a<-table.row.end(a)
if(lx>7) {
a<-table.row.start(a)
a<-table.element(a,paste('
',RC.texteval('ad.x'),'
',sep=''))
a<-table.row.end(a)
a<-table.row.start(a)
a<-table.element(a,paste('
',RC.texteval('ad.y'),'
',sep=''))
a<-table.row.end(a)
}
a<-table.end(a)
table.save(a,file='mytable1.tab')
library(car)
bitmap(file='test2.png')
qqPlot(x,main='QQplot of variable x')
dev.off()
bitmap(file='test3.png')
qqPlot(y,main='QQplot of variable y')
dev.off()