Free Statistics
of Irreproducible Research!
Description of Statistical Computation | ||||||||||||||||||||||||||||||
|---|---|---|---|---|---|---|---|---|---|---|---|---|---|---|---|---|---|---|---|---|---|---|---|---|---|---|---|---|---|---|
| Author's title | ||||||||||||||||||||||||||||||
| Author | *The author of this computation has been verified* | |||||||||||||||||||||||||||||
| R Software Module | rwasp_skewness_kurtosis_plot.wasp | |||||||||||||||||||||||||||||
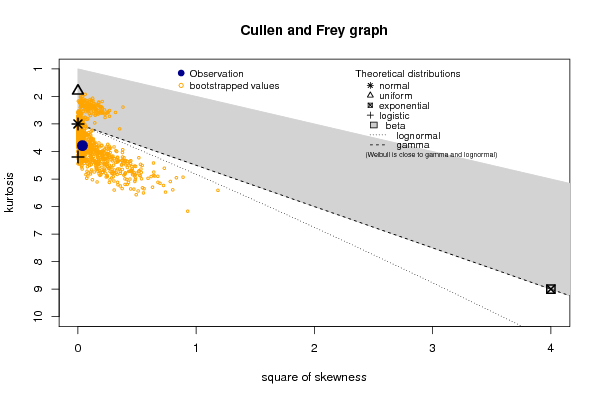
| Title produced by software | Skewness-Kurtosis Plot | |||||||||||||||||||||||||||||
| Date of computation | Fri, 08 Dec 2017 10:00:12 +0100 | |||||||||||||||||||||||||||||
| Cite this page as follows | Statistical Computations at FreeStatistics.org, Office for Research Development and Education, URL https://freestatistics.org/blog/index.php?v=date/2017/Dec/08/t1512724361bk0a8octbt7qkel.htm/, Retrieved Tue, 14 May 2024 11:41:31 +0000 | |||||||||||||||||||||||||||||
| Statistical Computations at FreeStatistics.org, Office for Research Development and Education, URL https://freestatistics.org/blog/index.php?pk=308763, Retrieved Tue, 14 May 2024 11:41:31 +0000 | ||||||||||||||||||||||||||||||
| QR Codes: | ||||||||||||||||||||||||||||||
|
| ||||||||||||||||||||||||||||||
| Original text written by user: | ||||||||||||||||||||||||||||||
| IsPrivate? | No (this computation is public) | |||||||||||||||||||||||||||||
| User-defined keywords | ||||||||||||||||||||||||||||||
| Estimated Impact | 112 | |||||||||||||||||||||||||||||
Tree of Dependent Computations | ||||||||||||||||||||||||||||||
| Family? (F = Feedback message, R = changed R code, M = changed R Module, P = changed Parameters, D = changed Data) | ||||||||||||||||||||||||||||||
| - [Skewness-Kurtosis Plot] [Skewness-Kurtosis...] [2017-12-08 09:00:12] [b9ba5da1e46a180616c603fd7f584a37] [Current] | ||||||||||||||||||||||||||||||
| Feedback Forum | ||||||||||||||||||||||||||||||
Post a new message | ||||||||||||||||||||||||||||||
Dataset | ||||||||||||||||||||||||||||||
| Dataseries X: | ||||||||||||||||||||||||||||||
355 355 670 1910 1000 920 920 920 920 1150 1160 660 920 920 930 1160 1030 920 930 920 1029 1000 1160 1150 858 999 909 999 909 999 670 999 60 670 400 920 617 636 1068 1068 385 920 600 1090 766 636 545 921 1253 900 945 945 600 800 557 530 842 460 644 588 588 588 561 612 531 800 700 1313 700 535 987 740 297 760 470 1100 614 1109 1100 438 800 1000 630 1300 380 959 614 400 400 400 350 869 520 850 900 794 1220 1100 900 1200 900 1238 1200 1100 1110 900 373 696 520 1238 900 1200 900 373 146 445 324 211 447 1185 848 671 760 1176 1360 760 1360 869 720 1360 822 1185 822 1185 2100 868 765 858 808 720 660 1176 160 160 160 210 295 287 197 59 470 680 750 59 1200 88 88 180 | ||||||||||||||||||||||||||||||
Tables (Output of Computation) | ||||||||||||||||||||||||||||||
| ||||||||||||||||||||||||||||||
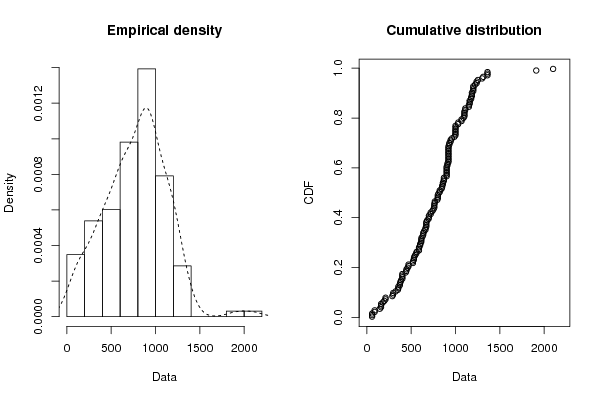
Figures (Output of Computation) | ||||||||||||||||||||||||||||||
Input Parameters & R Code | ||||||||||||||||||||||||||||||
| Parameters (Session): | ||||||||||||||||||||||||||||||
| Parameters (R input): | ||||||||||||||||||||||||||||||
| R code (references can be found in the software module): | ||||||||||||||||||||||||||||||
library(fitdistrplus) | ||||||||||||||||||||||||||||||