Free Statistics

of Irreproducible Research!

Author's title

Author*The author of this computation has been verified*
R Software Modulerwasp_autocorrelation.wasp
Title produced by software(Partial) Autocorrelation Function
Date of computationThu, 07 Dec 2017 11:50:37 +0100
Cite this page as followsStatistical Computations at FreeStatistics.org, Office for Research Development and Education, URL https://freestatistics.org/blog/index.php?v=date/2017/Dec/07/t1512643968yr0ldq7zct0bbbc.htm/, Retrieved Wed, 15 May 2024 23:40:22 +0000
Statistical Computations at FreeStatistics.org, Office for Research Development and Education, URL https://freestatistics.org/blog/index.php?pk=308681, Retrieved Wed, 15 May 2024 23:40:22 +0000
QR Codes:

Original text written by user:
IsPrivate?No (this computation is public)
User-defined keywords
Estimated Impact87
Family? (F = Feedback message, R = changed R code, M = changed R Module, P = changed Parameters, D = changed Data)
-       [(Partial) Autocorrelation Function] [] [2017-12-07 10:50:37] [8329b9b38c877eb1bcf8703660df8d0b] [Current]
Feedback Forum

Post a new message
Dataseries X:
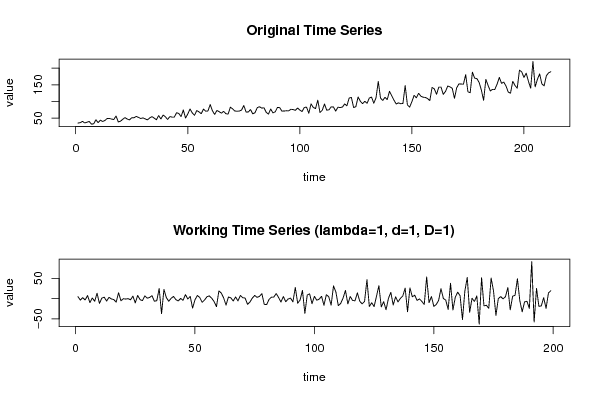
35
36.1
40.1
35.4
37.4
39.9
32
32.6
44.9
36.3
43.7
39.8
42.6
48.6
49.1
46.9
45.7
56.1
38.3
40.6
46.5
51.4
47
44.6
51
51.1
54.9
52.1
48.7
50.5
47.5
44.6
50.3
54.3
50
44.8
57.6
47.2
59.1
53.9
45.7
54.5
52.8
52.9
66
63.7
54.4
74.4
50.1
62.5
77.2
65.6
58.2
72.6
68.6
63.1
76.9
70.6
71.4
90.6
71.9
60.9
72.9
69.2
64.8
70.2
63
62.2
82.8
77.6
71.2
70.6
71.1
74
87.9
68.3
68.1
75.7
62.7
66.2
81.3
84
80
80.8
67.3
61.9
77.2
65.6
68.7
82
81.4
70.9
71.2
71.9
71.6
76.4
75.6
73.2
80.2
74
69.5
82
82.8
64.5
92.6
82
78.4
103.8
66.6
73.3
92.3
73.6
74.9
83.6
83.3
70.9
82.5
81.7
83.1
92.4
86.9
110.1
112.1
81.5
84.3
113.5
100.3
93.2
100.4
94.4
110.2
113
94.6
111
160.1
110.1
102.8
112.4
105.4
130.4
117.2
103.9
92.2
95.8
93.1
93.9
147.6
89.6
83
99.2
118.3
110.9
124.4
115.8
112.7
111.9
108.6
102.5
141.9
137.7
121.3
142.8
143
121.1
130.2
146.3
143.7
139.3
109.3
141.3
152.7
152.2
151.8
180.5
129
126.1
187.9
170
168.4
157.1
133.9
103.1
166.3
148
131.4
136.3
135.8
151.8
172.2
154.4
158
146.2
128
124.7
160.3
148.1
139.7
194
188.7
172.2
184.8
160.5
139.7
219.8
143.9
166.2
182.7
152.7
146.8
177.1
186
189.2


Summary of computational transaction
Raw Input view raw input (R code)
Raw Outputview raw output of R engine
Computing time1 seconds
R ServerBig Analytics Cloud Computing Center

\begin{tabular}{lllllllll}
\hline
Summary of computational transaction \tabularnewline
Raw Input view raw input (R code)  \tabularnewline
Raw Outputview raw output of R engine  \tabularnewline
Computing time1 seconds \tabularnewline
R ServerBig Analytics Cloud Computing Center \tabularnewline
\hline
\end{tabular}
%Source: https://freestatistics.org/blog/index.php?pk=308681&T=0

[TABLE]
[ROW]
Summary of computational transaction[/C][/ROW] [ROW]Raw Input[/C] view raw input (R code) [/C][/ROW] [ROW]Raw Output[/C]view raw output of R engine [/C][/ROW] [ROW]Computing time[/C]1 seconds[/C][/ROW] [ROW]R Server[/C]Big Analytics Cloud Computing Center[/C][/ROW] [/TABLE] Source: https://freestatistics.org/blog/index.php?pk=308681&T=0

Globally Unique Identifier (entire table): ba.freestatistics.org/blog/index.php?pk=308681&T=0

As an alternative you can also use a QR Code:  

The GUIDs for individual cells are displayed in the table below:

Summary of computational transaction
Raw Input view raw input (R code)
Raw Outputview raw output of R engine
Computing time1 seconds
R ServerBig Analytics Cloud Computing Center


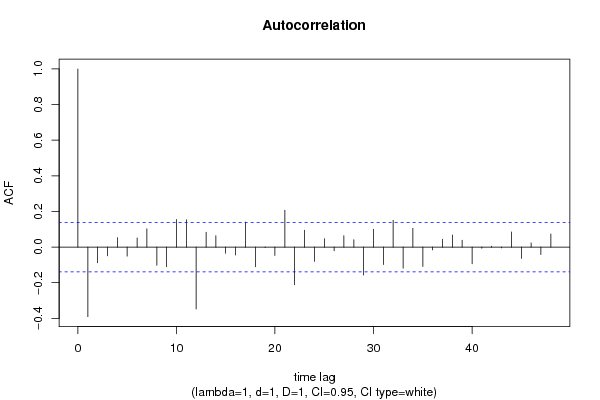
Autocorrelation Function
Time lag kACF(k)T-STATP-value
1-0.390341-5.50640
2-0.088168-1.24380.107525
3-0.04906-0.69210.244849
40.0523260.73810.230647
5-0.050695-0.71510.23768
60.0513720.72470.234746
70.1024491.44520.074985
8-0.101692-1.43450.076493
9-0.110331-1.55640.060599
100.155092.18780.014924
110.1534242.16430.015816
12-0.34764-4.90411e-06
130.0831861.17350.121002
140.0642440.90630.182944
15-0.034129-0.48150.315363
16-0.04392-0.61960.268128
170.1404841.98180.024441
18-0.109862-1.54980.061389
19-0.001777-0.02510.490011
20-0.04645-0.65530.256528
210.2068142.91750.001967
22-0.211351-2.98150.001613
230.0944871.33290.092044
24-0.080227-1.13170.129552
250.0467420.65940.255206
26-0.020333-0.28680.38727
270.0642330.90610.182986
280.0416040.58690.278969
29-0.156234-2.2040.014337
300.1005511.41840.078812
31-0.097226-1.37150.085874
320.1504492.12230.017523
33-0.118921-1.67760.047499
340.105261.48490.069579
35-0.108691-1.53330.063399
36-0.015474-0.21830.413717
370.044350.62560.266137
380.0681840.96180.168646
390.0385410.54370.293632
40-0.093493-1.31890.094361
41-0.006718-0.09480.462296
420.0047680.06730.473222
43-0.00419-0.05910.476465
440.0844541.19140.117463
45-0.063204-0.89160.18684
460.0236020.3330.36976
47-0.041829-0.59010.277905
480.073641.03880.150074

\begin{tabular}{lllllllll}
\hline
Autocorrelation Function \tabularnewline
Time lag k & ACF(k) & T-STAT & P-value \tabularnewline
1 & -0.390341 & -5.5064 & 0 \tabularnewline
2 & -0.088168 & -1.2438 & 0.107525 \tabularnewline
3 & -0.04906 & -0.6921 & 0.244849 \tabularnewline
4 & 0.052326 & 0.7381 & 0.230647 \tabularnewline
5 & -0.050695 & -0.7151 & 0.23768 \tabularnewline
6 & 0.051372 & 0.7247 & 0.234746 \tabularnewline
7 & 0.102449 & 1.4452 & 0.074985 \tabularnewline
8 & -0.101692 & -1.4345 & 0.076493 \tabularnewline
9 & -0.110331 & -1.5564 & 0.060599 \tabularnewline
10 & 0.15509 & 2.1878 & 0.014924 \tabularnewline
11 & 0.153424 & 2.1643 & 0.015816 \tabularnewline
12 & -0.34764 & -4.9041 & 1e-06 \tabularnewline
13 & 0.083186 & 1.1735 & 0.121002 \tabularnewline
14 & 0.064244 & 0.9063 & 0.182944 \tabularnewline
15 & -0.034129 & -0.4815 & 0.315363 \tabularnewline
16 & -0.04392 & -0.6196 & 0.268128 \tabularnewline
17 & 0.140484 & 1.9818 & 0.024441 \tabularnewline
18 & -0.109862 & -1.5498 & 0.061389 \tabularnewline
19 & -0.001777 & -0.0251 & 0.490011 \tabularnewline
20 & -0.04645 & -0.6553 & 0.256528 \tabularnewline
21 & 0.206814 & 2.9175 & 0.001967 \tabularnewline
22 & -0.211351 & -2.9815 & 0.001613 \tabularnewline
23 & 0.094487 & 1.3329 & 0.092044 \tabularnewline
24 & -0.080227 & -1.1317 & 0.129552 \tabularnewline
25 & 0.046742 & 0.6594 & 0.255206 \tabularnewline
26 & -0.020333 & -0.2868 & 0.38727 \tabularnewline
27 & 0.064233 & 0.9061 & 0.182986 \tabularnewline
28 & 0.041604 & 0.5869 & 0.278969 \tabularnewline
29 & -0.156234 & -2.204 & 0.014337 \tabularnewline
30 & 0.100551 & 1.4184 & 0.078812 \tabularnewline
31 & -0.097226 & -1.3715 & 0.085874 \tabularnewline
32 & 0.150449 & 2.1223 & 0.017523 \tabularnewline
33 & -0.118921 & -1.6776 & 0.047499 \tabularnewline
34 & 0.10526 & 1.4849 & 0.069579 \tabularnewline
35 & -0.108691 & -1.5333 & 0.063399 \tabularnewline
36 & -0.015474 & -0.2183 & 0.413717 \tabularnewline
37 & 0.04435 & 0.6256 & 0.266137 \tabularnewline
38 & 0.068184 & 0.9618 & 0.168646 \tabularnewline
39 & 0.038541 & 0.5437 & 0.293632 \tabularnewline
40 & -0.093493 & -1.3189 & 0.094361 \tabularnewline
41 & -0.006718 & -0.0948 & 0.462296 \tabularnewline
42 & 0.004768 & 0.0673 & 0.473222 \tabularnewline
43 & -0.00419 & -0.0591 & 0.476465 \tabularnewline
44 & 0.084454 & 1.1914 & 0.117463 \tabularnewline
45 & -0.063204 & -0.8916 & 0.18684 \tabularnewline
46 & 0.023602 & 0.333 & 0.36976 \tabularnewline
47 & -0.041829 & -0.5901 & 0.277905 \tabularnewline
48 & 0.07364 & 1.0388 & 0.150074 \tabularnewline
\hline
\end{tabular}
%Source: https://freestatistics.org/blog/index.php?pk=308681&T=1

[TABLE]
[ROW][C]Autocorrelation Function[/C][/ROW]
[ROW][C]Time lag k[/C][C]ACF(k)[/C][C]T-STAT[/C][C]P-value[/C][/ROW]
[ROW][C]1[/C][C]-0.390341[/C][C]-5.5064[/C][C]0[/C][/ROW]
[ROW][C]2[/C][C]-0.088168[/C][C]-1.2438[/C][C]0.107525[/C][/ROW]
[ROW][C]3[/C][C]-0.04906[/C][C]-0.6921[/C][C]0.244849[/C][/ROW]
[ROW][C]4[/C][C]0.052326[/C][C]0.7381[/C][C]0.230647[/C][/ROW]
[ROW][C]5[/C][C]-0.050695[/C][C]-0.7151[/C][C]0.23768[/C][/ROW]
[ROW][C]6[/C][C]0.051372[/C][C]0.7247[/C][C]0.234746[/C][/ROW]
[ROW][C]7[/C][C]0.102449[/C][C]1.4452[/C][C]0.074985[/C][/ROW]
[ROW][C]8[/C][C]-0.101692[/C][C]-1.4345[/C][C]0.076493[/C][/ROW]
[ROW][C]9[/C][C]-0.110331[/C][C]-1.5564[/C][C]0.060599[/C][/ROW]
[ROW][C]10[/C][C]0.15509[/C][C]2.1878[/C][C]0.014924[/C][/ROW]
[ROW][C]11[/C][C]0.153424[/C][C]2.1643[/C][C]0.015816[/C][/ROW]
[ROW][C]12[/C][C]-0.34764[/C][C]-4.9041[/C][C]1e-06[/C][/ROW]
[ROW][C]13[/C][C]0.083186[/C][C]1.1735[/C][C]0.121002[/C][/ROW]
[ROW][C]14[/C][C]0.064244[/C][C]0.9063[/C][C]0.182944[/C][/ROW]
[ROW][C]15[/C][C]-0.034129[/C][C]-0.4815[/C][C]0.315363[/C][/ROW]
[ROW][C]16[/C][C]-0.04392[/C][C]-0.6196[/C][C]0.268128[/C][/ROW]
[ROW][C]17[/C][C]0.140484[/C][C]1.9818[/C][C]0.024441[/C][/ROW]
[ROW][C]18[/C][C]-0.109862[/C][C]-1.5498[/C][C]0.061389[/C][/ROW]
[ROW][C]19[/C][C]-0.001777[/C][C]-0.0251[/C][C]0.490011[/C][/ROW]
[ROW][C]20[/C][C]-0.04645[/C][C]-0.6553[/C][C]0.256528[/C][/ROW]
[ROW][C]21[/C][C]0.206814[/C][C]2.9175[/C][C]0.001967[/C][/ROW]
[ROW][C]22[/C][C]-0.211351[/C][C]-2.9815[/C][C]0.001613[/C][/ROW]
[ROW][C]23[/C][C]0.094487[/C][C]1.3329[/C][C]0.092044[/C][/ROW]
[ROW][C]24[/C][C]-0.080227[/C][C]-1.1317[/C][C]0.129552[/C][/ROW]
[ROW][C]25[/C][C]0.046742[/C][C]0.6594[/C][C]0.255206[/C][/ROW]
[ROW][C]26[/C][C]-0.020333[/C][C]-0.2868[/C][C]0.38727[/C][/ROW]
[ROW][C]27[/C][C]0.064233[/C][C]0.9061[/C][C]0.182986[/C][/ROW]
[ROW][C]28[/C][C]0.041604[/C][C]0.5869[/C][C]0.278969[/C][/ROW]
[ROW][C]29[/C][C]-0.156234[/C][C]-2.204[/C][C]0.014337[/C][/ROW]
[ROW][C]30[/C][C]0.100551[/C][C]1.4184[/C][C]0.078812[/C][/ROW]
[ROW][C]31[/C][C]-0.097226[/C][C]-1.3715[/C][C]0.085874[/C][/ROW]
[ROW][C]32[/C][C]0.150449[/C][C]2.1223[/C][C]0.017523[/C][/ROW]
[ROW][C]33[/C][C]-0.118921[/C][C]-1.6776[/C][C]0.047499[/C][/ROW]
[ROW][C]34[/C][C]0.10526[/C][C]1.4849[/C][C]0.069579[/C][/ROW]
[ROW][C]35[/C][C]-0.108691[/C][C]-1.5333[/C][C]0.063399[/C][/ROW]
[ROW][C]36[/C][C]-0.015474[/C][C]-0.2183[/C][C]0.413717[/C][/ROW]
[ROW][C]37[/C][C]0.04435[/C][C]0.6256[/C][C]0.266137[/C][/ROW]
[ROW][C]38[/C][C]0.068184[/C][C]0.9618[/C][C]0.168646[/C][/ROW]
[ROW][C]39[/C][C]0.038541[/C][C]0.5437[/C][C]0.293632[/C][/ROW]
[ROW][C]40[/C][C]-0.093493[/C][C]-1.3189[/C][C]0.094361[/C][/ROW]
[ROW][C]41[/C][C]-0.006718[/C][C]-0.0948[/C][C]0.462296[/C][/ROW]
[ROW][C]42[/C][C]0.004768[/C][C]0.0673[/C][C]0.473222[/C][/ROW]
[ROW][C]43[/C][C]-0.00419[/C][C]-0.0591[/C][C]0.476465[/C][/ROW]
[ROW][C]44[/C][C]0.084454[/C][C]1.1914[/C][C]0.117463[/C][/ROW]
[ROW][C]45[/C][C]-0.063204[/C][C]-0.8916[/C][C]0.18684[/C][/ROW]
[ROW][C]46[/C][C]0.023602[/C][C]0.333[/C][C]0.36976[/C][/ROW]
[ROW][C]47[/C][C]-0.041829[/C][C]-0.5901[/C][C]0.277905[/C][/ROW]
[ROW][C]48[/C][C]0.07364[/C][C]1.0388[/C][C]0.150074[/C][/ROW]
[/TABLE]
Source: https://freestatistics.org/blog/index.php?pk=308681&T=1

Globally Unique Identifier (entire table): ba.freestatistics.org/blog/index.php?pk=308681&T=1

As an alternative you can also use a QR Code:  

The GUIDs for individual cells are displayed in the table below:

Autocorrelation Function
Time lag kACF(k)T-STATP-value
1-0.390341-5.50640
2-0.088168-1.24380.107525
3-0.04906-0.69210.244849
40.0523260.73810.230647
5-0.050695-0.71510.23768
60.0513720.72470.234746
70.1024491.44520.074985
8-0.101692-1.43450.076493
9-0.110331-1.55640.060599
100.155092.18780.014924
110.1534242.16430.015816
12-0.34764-4.90411e-06
130.0831861.17350.121002
140.0642440.90630.182944
15-0.034129-0.48150.315363
16-0.04392-0.61960.268128
170.1404841.98180.024441
18-0.109862-1.54980.061389
19-0.001777-0.02510.490011
20-0.04645-0.65530.256528
210.2068142.91750.001967
22-0.211351-2.98150.001613
230.0944871.33290.092044
24-0.080227-1.13170.129552
250.0467420.65940.255206
26-0.020333-0.28680.38727
270.0642330.90610.182986
280.0416040.58690.278969
29-0.156234-2.2040.014337
300.1005511.41840.078812
31-0.097226-1.37150.085874
320.1504492.12230.017523
33-0.118921-1.67760.047499
340.105261.48490.069579
35-0.108691-1.53330.063399
36-0.015474-0.21830.413717
370.044350.62560.266137
380.0681840.96180.168646
390.0385410.54370.293632
40-0.093493-1.31890.094361
41-0.006718-0.09480.462296
420.0047680.06730.473222
43-0.00419-0.05910.476465
440.0844541.19140.117463
45-0.063204-0.89160.18684
460.0236020.3330.36976
47-0.041829-0.59010.277905
480.073641.03880.150074


Partial Autocorrelation Function
Time lag kPACF(k)T-STATP-value
1-0.390341-5.50640
2-0.283771-4.00314.4e-05
3-0.261758-3.69260.000143
4-0.157941-2.2280.013499
5-0.190344-2.68510.003931
6-0.107187-1.51210.066053
70.0772181.08930.138671
80.0014670.02070.491756
9-0.142255-2.00670.023065
100.0331340.46740.320359
110.2818363.97584.9e-05
12-0.153488-2.16520.015781
13-0.134333-1.8950.029771
14-0.053525-0.75510.225552
15-0.105931-1.49430.068336
16-0.170518-2.40550.008534
17-0.044786-0.63180.264126
18-0.130286-1.83790.033783
190.0167230.23590.406875
20-0.0958-1.35140.089047
210.0646190.91160.181551
22-0.064973-0.91660.180244
230.1639632.3130.010873
24-0.158711-2.23890.013135
25-0.116355-1.64140.051148
26-0.068563-0.96720.167307
27-0.06138-0.86590.193801
28-0.050236-0.70870.239681
29-0.104368-1.47230.071261
30-0.00711-0.10030.460102
31-0.150955-2.12950.017221
320.0144510.20390.419337
33-0.03712-0.52360.300556
340.0006460.00910.496371
35-0.003884-0.05480.47818
36-0.20241-2.85530.002377
37-0.173044-2.44110.007759
38-0.104649-1.47630.070728
390.1121411.58190.057625
40-0.038727-0.54630.29273
410.0039740.05610.477675
420.0064990.09170.463522
43-0.053676-0.75720.224915
440.0485040.68420.24731
45-0.047558-0.67090.251537
460.0243760.34390.365656
47-0.035779-0.50470.307156
480.0009360.01320.494739

\begin{tabular}{lllllllll}
\hline
Partial Autocorrelation Function \tabularnewline
Time lag k & PACF(k) & T-STAT & P-value \tabularnewline
1 & -0.390341 & -5.5064 & 0 \tabularnewline
2 & -0.283771 & -4.0031 & 4.4e-05 \tabularnewline
3 & -0.261758 & -3.6926 & 0.000143 \tabularnewline
4 & -0.157941 & -2.228 & 0.013499 \tabularnewline
5 & -0.190344 & -2.6851 & 0.003931 \tabularnewline
6 & -0.107187 & -1.5121 & 0.066053 \tabularnewline
7 & 0.077218 & 1.0893 & 0.138671 \tabularnewline
8 & 0.001467 & 0.0207 & 0.491756 \tabularnewline
9 & -0.142255 & -2.0067 & 0.023065 \tabularnewline
10 & 0.033134 & 0.4674 & 0.320359 \tabularnewline
11 & 0.281836 & 3.9758 & 4.9e-05 \tabularnewline
12 & -0.153488 & -2.1652 & 0.015781 \tabularnewline
13 & -0.134333 & -1.895 & 0.029771 \tabularnewline
14 & -0.053525 & -0.7551 & 0.225552 \tabularnewline
15 & -0.105931 & -1.4943 & 0.068336 \tabularnewline
16 & -0.170518 & -2.4055 & 0.008534 \tabularnewline
17 & -0.044786 & -0.6318 & 0.264126 \tabularnewline
18 & -0.130286 & -1.8379 & 0.033783 \tabularnewline
19 & 0.016723 & 0.2359 & 0.406875 \tabularnewline
20 & -0.0958 & -1.3514 & 0.089047 \tabularnewline
21 & 0.064619 & 0.9116 & 0.181551 \tabularnewline
22 & -0.064973 & -0.9166 & 0.180244 \tabularnewline
23 & 0.163963 & 2.313 & 0.010873 \tabularnewline
24 & -0.158711 & -2.2389 & 0.013135 \tabularnewline
25 & -0.116355 & -1.6414 & 0.051148 \tabularnewline
26 & -0.068563 & -0.9672 & 0.167307 \tabularnewline
27 & -0.06138 & -0.8659 & 0.193801 \tabularnewline
28 & -0.050236 & -0.7087 & 0.239681 \tabularnewline
29 & -0.104368 & -1.4723 & 0.071261 \tabularnewline
30 & -0.00711 & -0.1003 & 0.460102 \tabularnewline
31 & -0.150955 & -2.1295 & 0.017221 \tabularnewline
32 & 0.014451 & 0.2039 & 0.419337 \tabularnewline
33 & -0.03712 & -0.5236 & 0.300556 \tabularnewline
34 & 0.000646 & 0.0091 & 0.496371 \tabularnewline
35 & -0.003884 & -0.0548 & 0.47818 \tabularnewline
36 & -0.20241 & -2.8553 & 0.002377 \tabularnewline
37 & -0.173044 & -2.4411 & 0.007759 \tabularnewline
38 & -0.104649 & -1.4763 & 0.070728 \tabularnewline
39 & 0.112141 & 1.5819 & 0.057625 \tabularnewline
40 & -0.038727 & -0.5463 & 0.29273 \tabularnewline
41 & 0.003974 & 0.0561 & 0.477675 \tabularnewline
42 & 0.006499 & 0.0917 & 0.463522 \tabularnewline
43 & -0.053676 & -0.7572 & 0.224915 \tabularnewline
44 & 0.048504 & 0.6842 & 0.24731 \tabularnewline
45 & -0.047558 & -0.6709 & 0.251537 \tabularnewline
46 & 0.024376 & 0.3439 & 0.365656 \tabularnewline
47 & -0.035779 & -0.5047 & 0.307156 \tabularnewline
48 & 0.000936 & 0.0132 & 0.494739 \tabularnewline
\hline
\end{tabular}
%Source: https://freestatistics.org/blog/index.php?pk=308681&T=2

[TABLE]
[ROW][C]Partial Autocorrelation Function[/C][/ROW]
[ROW][C]Time lag k[/C][C]PACF(k)[/C][C]T-STAT[/C][C]P-value[/C][/ROW]
[ROW][C]1[/C][C]-0.390341[/C][C]-5.5064[/C][C]0[/C][/ROW]
[ROW][C]2[/C][C]-0.283771[/C][C]-4.0031[/C][C]4.4e-05[/C][/ROW]
[ROW][C]3[/C][C]-0.261758[/C][C]-3.6926[/C][C]0.000143[/C][/ROW]
[ROW][C]4[/C][C]-0.157941[/C][C]-2.228[/C][C]0.013499[/C][/ROW]
[ROW][C]5[/C][C]-0.190344[/C][C]-2.6851[/C][C]0.003931[/C][/ROW]
[ROW][C]6[/C][C]-0.107187[/C][C]-1.5121[/C][C]0.066053[/C][/ROW]
[ROW][C]7[/C][C]0.077218[/C][C]1.0893[/C][C]0.138671[/C][/ROW]
[ROW][C]8[/C][C]0.001467[/C][C]0.0207[/C][C]0.491756[/C][/ROW]
[ROW][C]9[/C][C]-0.142255[/C][C]-2.0067[/C][C]0.023065[/C][/ROW]
[ROW][C]10[/C][C]0.033134[/C][C]0.4674[/C][C]0.320359[/C][/ROW]
[ROW][C]11[/C][C]0.281836[/C][C]3.9758[/C][C]4.9e-05[/C][/ROW]
[ROW][C]12[/C][C]-0.153488[/C][C]-2.1652[/C][C]0.015781[/C][/ROW]
[ROW][C]13[/C][C]-0.134333[/C][C]-1.895[/C][C]0.029771[/C][/ROW]
[ROW][C]14[/C][C]-0.053525[/C][C]-0.7551[/C][C]0.225552[/C][/ROW]
[ROW][C]15[/C][C]-0.105931[/C][C]-1.4943[/C][C]0.068336[/C][/ROW]
[ROW][C]16[/C][C]-0.170518[/C][C]-2.4055[/C][C]0.008534[/C][/ROW]
[ROW][C]17[/C][C]-0.044786[/C][C]-0.6318[/C][C]0.264126[/C][/ROW]
[ROW][C]18[/C][C]-0.130286[/C][C]-1.8379[/C][C]0.033783[/C][/ROW]
[ROW][C]19[/C][C]0.016723[/C][C]0.2359[/C][C]0.406875[/C][/ROW]
[ROW][C]20[/C][C]-0.0958[/C][C]-1.3514[/C][C]0.089047[/C][/ROW]
[ROW][C]21[/C][C]0.064619[/C][C]0.9116[/C][C]0.181551[/C][/ROW]
[ROW][C]22[/C][C]-0.064973[/C][C]-0.9166[/C][C]0.180244[/C][/ROW]
[ROW][C]23[/C][C]0.163963[/C][C]2.313[/C][C]0.010873[/C][/ROW]
[ROW][C]24[/C][C]-0.158711[/C][C]-2.2389[/C][C]0.013135[/C][/ROW]
[ROW][C]25[/C][C]-0.116355[/C][C]-1.6414[/C][C]0.051148[/C][/ROW]
[ROW][C]26[/C][C]-0.068563[/C][C]-0.9672[/C][C]0.167307[/C][/ROW]
[ROW][C]27[/C][C]-0.06138[/C][C]-0.8659[/C][C]0.193801[/C][/ROW]
[ROW][C]28[/C][C]-0.050236[/C][C]-0.7087[/C][C]0.239681[/C][/ROW]
[ROW][C]29[/C][C]-0.104368[/C][C]-1.4723[/C][C]0.071261[/C][/ROW]
[ROW][C]30[/C][C]-0.00711[/C][C]-0.1003[/C][C]0.460102[/C][/ROW]
[ROW][C]31[/C][C]-0.150955[/C][C]-2.1295[/C][C]0.017221[/C][/ROW]
[ROW][C]32[/C][C]0.014451[/C][C]0.2039[/C][C]0.419337[/C][/ROW]
[ROW][C]33[/C][C]-0.03712[/C][C]-0.5236[/C][C]0.300556[/C][/ROW]
[ROW][C]34[/C][C]0.000646[/C][C]0.0091[/C][C]0.496371[/C][/ROW]
[ROW][C]35[/C][C]-0.003884[/C][C]-0.0548[/C][C]0.47818[/C][/ROW]
[ROW][C]36[/C][C]-0.20241[/C][C]-2.8553[/C][C]0.002377[/C][/ROW]
[ROW][C]37[/C][C]-0.173044[/C][C]-2.4411[/C][C]0.007759[/C][/ROW]
[ROW][C]38[/C][C]-0.104649[/C][C]-1.4763[/C][C]0.070728[/C][/ROW]
[ROW][C]39[/C][C]0.112141[/C][C]1.5819[/C][C]0.057625[/C][/ROW]
[ROW][C]40[/C][C]-0.038727[/C][C]-0.5463[/C][C]0.29273[/C][/ROW]
[ROW][C]41[/C][C]0.003974[/C][C]0.0561[/C][C]0.477675[/C][/ROW]
[ROW][C]42[/C][C]0.006499[/C][C]0.0917[/C][C]0.463522[/C][/ROW]
[ROW][C]43[/C][C]-0.053676[/C][C]-0.7572[/C][C]0.224915[/C][/ROW]
[ROW][C]44[/C][C]0.048504[/C][C]0.6842[/C][C]0.24731[/C][/ROW]
[ROW][C]45[/C][C]-0.047558[/C][C]-0.6709[/C][C]0.251537[/C][/ROW]
[ROW][C]46[/C][C]0.024376[/C][C]0.3439[/C][C]0.365656[/C][/ROW]
[ROW][C]47[/C][C]-0.035779[/C][C]-0.5047[/C][C]0.307156[/C][/ROW]
[ROW][C]48[/C][C]0.000936[/C][C]0.0132[/C][C]0.494739[/C][/ROW]
[/TABLE]
Source: https://freestatistics.org/blog/index.php?pk=308681&T=2

Globally Unique Identifier (entire table): ba.freestatistics.org/blog/index.php?pk=308681&T=2

As an alternative you can also use a QR Code:  

The GUIDs for individual cells are displayed in the table below:

Partial Autocorrelation Function
Time lag kPACF(k)T-STATP-value
1-0.390341-5.50640
2-0.283771-4.00314.4e-05
3-0.261758-3.69260.000143
4-0.157941-2.2280.013499
5-0.190344-2.68510.003931
6-0.107187-1.51210.066053
70.0772181.08930.138671
80.0014670.02070.491756
9-0.142255-2.00670.023065
100.0331340.46740.320359
110.2818363.97584.9e-05
12-0.153488-2.16520.015781
13-0.134333-1.8950.029771
14-0.053525-0.75510.225552
15-0.105931-1.49430.068336
16-0.170518-2.40550.008534
17-0.044786-0.63180.264126
18-0.130286-1.83790.033783
190.0167230.23590.406875
20-0.0958-1.35140.089047
210.0646190.91160.181551
22-0.064973-0.91660.180244
230.1639632.3130.010873
24-0.158711-2.23890.013135
25-0.116355-1.64140.051148
26-0.068563-0.96720.167307
27-0.06138-0.86590.193801
28-0.050236-0.70870.239681
29-0.104368-1.47230.071261
30-0.00711-0.10030.460102
31-0.150955-2.12950.017221
320.0144510.20390.419337
33-0.03712-0.52360.300556
340.0006460.00910.496371
35-0.003884-0.05480.47818
36-0.20241-2.85530.002377
37-0.173044-2.44110.007759
38-0.104649-1.47630.070728
390.1121411.58190.057625
40-0.038727-0.54630.29273
410.0039740.05610.477675
420.0064990.09170.463522
43-0.053676-0.75720.224915
440.0485040.68420.24731
45-0.047558-0.67090.251537
460.0243760.34390.365656
47-0.035779-0.50470.307156
480.0009360.01320.494739


Parameters (Session):
par1 = 48 ; par2 = 1 ; par3 = 1 ; par4 = 1 ; par5 = 12 ; par6 = White Noise ; par7 = 0.95 ;
Parameters (R input):
par1 = 48 ; par2 = 1 ; par3 = 1 ; par4 = 1 ; par5 = 12 ; par6 = White Noise ; par7 = 0.95 ; par8 = ;
R code (references can be found in the software module):
if (par1 == 'Default') {
par1 = 10*log10(length(x))
} else {
par1 <- as.numeric(par1)
}
par2 <- as.numeric(par2)
par3 <- as.numeric(par3)
par4 <- as.numeric(par4)
par5 <- as.numeric(par5)
if (par6 == 'White Noise') par6 <- 'white' else par6 <- 'ma'
par7 <- as.numeric(par7)
if (par8 != '') par8 <- as.numeric(par8)
x <- na.omit(x)
ox <- x
if (par8 == '') {
if (par2 == 0) {
x <- log(x)
} else {
x <- (x ^ par2 - 1) / par2
}
} else {
x <- log(x,base=par8)
}
if (par3 > 0) x <- diff(x,lag=1,difference=par3)
if (par4 > 0) x <- diff(x,lag=par5,difference=par4)
bitmap(file='picts.png')
op <- par(mfrow=c(2,1))
plot(ox,type='l',main='Original Time Series',xlab='time',ylab='value')
if (par8=='') {
mytitle <- paste('Working Time Series (lambda=',par2,', d=',par3,', D=',par4,')',sep='')
mysub <- paste('(lambda=',par2,', d=',par3,', D=',par4,', CI=', par7, ', CI type=',par6,')',sep='')
} else {
mytitle <- paste('Working Time Series (base=',par8,', d=',par3,', D=',par4,')',sep='')
mysub <- paste('(base=',par8,', d=',par3,', D=',par4,', CI=', par7, ', CI type=',par6,')',sep='')
}
plot(x,type='l', main=mytitle,xlab='time',ylab='value')
par(op)
dev.off()
bitmap(file='pic1.png')
racf <- acf(x, par1, main='Autocorrelation', xlab='time lag', ylab='ACF', ci.type=par6, ci=par7, sub=mysub)
dev.off()
bitmap(file='pic2.png')
rpacf <- pacf(x,par1,main='Partial Autocorrelation',xlab='lags',ylab='PACF',sub=mysub)
dev.off()
(myacf <- c(racf$acf))
(mypacf <- c(rpacf$acf))
lengthx <- length(x)
sqrtn <- sqrt(lengthx)
load(file='createtable')
a<-table.start()
a<-table.row.start(a)
a<-table.element(a,'Autocorrelation Function',4,TRUE)
a<-table.row.end(a)
a<-table.row.start(a)
a<-table.element(a,'Time lag k',header=TRUE)
a<-table.element(a,'ACF(k)',header=TRUE)
a<-table.element(a,'T-STAT',header=TRUE)
a<-table.element(a,'P-value',header=TRUE)
a<-table.row.end(a)
for (i in 2:(par1+1)) {
a<-table.row.start(a)
a<-table.element(a,i-1,header=TRUE)
a<-table.element(a,round(myacf[i],6))
mytstat <- myacf[i]*sqrtn
a<-table.element(a,round(mytstat,4))
a<-table.element(a,round(1-pt(abs(mytstat),lengthx),6))
a<-table.row.end(a)
}
a<-table.end(a)
table.save(a,file='mytable.tab')
a<-table.start()
a<-table.row.start(a)
a<-table.element(a,'Partial Autocorrelation Function',4,TRUE)
a<-table.row.end(a)
a<-table.row.start(a)
a<-table.element(a,'Time lag k',header=TRUE)
a<-table.element(a,'PACF(k)',header=TRUE)
a<-table.element(a,'T-STAT',header=TRUE)
a<-table.element(a,'P-value',header=TRUE)
a<-table.row.end(a)
for (i in 1:par1) {
a<-table.row.start(a)
a<-table.element(a,i,header=TRUE)
a<-table.element(a,round(mypacf[i],6))
mytstat <- mypacf[i]*sqrtn
a<-table.element(a,round(mytstat,4))
a<-table.element(a,round(1-pt(abs(mytstat),lengthx),6))
a<-table.row.end(a)
}
a<-table.end(a)
table.save(a,file='mytable1.tab')