Free Statistics

of Irreproducible Research!

Author's title

Author*The author of this computation has been verified*
R Software Modulerwasp_autocorrelation.wasp
Title produced by software(Partial) Autocorrelation Function
Date of computationThu, 07 Dec 2017 11:29:52 +0100
Cite this page as followsStatistical Computations at FreeStatistics.org, Office for Research Development and Education, URL https://freestatistics.org/blog/index.php?v=date/2017/Dec/07/t15126432798l5fuwp3k4jouwb.htm/, Retrieved Wed, 15 May 2024 02:55:34 +0000
Statistical Computations at FreeStatistics.org, Office for Research Development and Education, URL https://freestatistics.org/blog/index.php?pk=308674, Retrieved Wed, 15 May 2024 02:55:34 +0000
QR Codes:

Original text written by user:
IsPrivate?No (this computation is public)
User-defined keywords
Estimated Impact108
Family? (F = Feedback message, R = changed R code, M = changed R Module, P = changed Parameters, D = changed Data)
-       [(Partial) Autocorrelation Function] [] [2017-12-07 10:29:52] [8329b9b38c877eb1bcf8703660df8d0b] [Current]
Feedback Forum

Post a new message
Dataseries X:
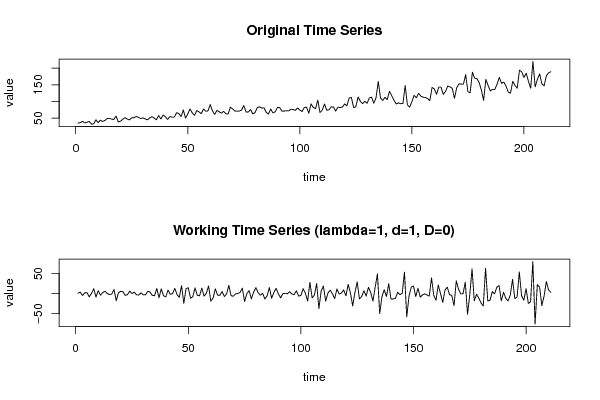
35
36.1
40.1
35.4
37.4
39.9
32
32.6
44.9
36.3
43.7
39.8
42.6
48.6
49.1
46.9
45.7
56.1
38.3
40.6
46.5
51.4
47
44.6
51
51.1
54.9
52.1
48.7
50.5
47.5
44.6
50.3
54.3
50
44.8
57.6
47.2
59.1
53.9
45.7
54.5
52.8
52.9
66
63.7
54.4
74.4
50.1
62.5
77.2
65.6
58.2
72.6
68.6
63.1
76.9
70.6
71.4
90.6
71.9
60.9
72.9
69.2
64.8
70.2
63
62.2
82.8
77.6
71.2
70.6
71.1
74
87.9
68.3
68.1
75.7
62.7
66.2
81.3
84
80
80.8
67.3
61.9
77.2
65.6
68.7
82
81.4
70.9
71.2
71.9
71.6
76.4
75.6
73.2
80.2
74
69.5
82
82.8
64.5
92.6
82
78.4
103.8
66.6
73.3
92.3
73.6
74.9
83.6
83.3
70.9
82.5
81.7
83.1
92.4
86.9
110.1
112.1
81.5
84.3
113.5
100.3
93.2
100.4
94.4
110.2
113
94.6
111
160.1
110.1
102.8
112.4
105.4
130.4
117.2
103.9
92.2
95.8
93.1
93.9
147.6
89.6
83
99.2
118.3
110.9
124.4
115.8
112.7
111.9
108.6
102.5
141.9
137.7
121.3
142.8
143
121.1
130.2
146.3
143.7
139.3
109.3
141.3
152.7
152.2
151.8
180.5
129
126.1
187.9
170
168.4
157.1
133.9
103.1
166.3
148
131.4
136.3
135.8
151.8
172.2
154.4
158
146.2
128
124.7
160.3
148.1
139.7
194
188.7
172.2
184.8
160.5
139.7
219.8
143.9
166.2
182.7
152.7
146.8
177.1
186
189.2


Summary of computational transaction
Raw Input view raw input (R code)
Raw Outputview raw output of R engine
Computing time2 seconds
R ServerBig Analytics Cloud Computing Center

\begin{tabular}{lllllllll}
\hline
Summary of computational transaction \tabularnewline
Raw Input view raw input (R code)  \tabularnewline
Raw Outputview raw output of R engine  \tabularnewline
Computing time2 seconds \tabularnewline
R ServerBig Analytics Cloud Computing Center \tabularnewline
\hline
\end{tabular}
%Source: https://freestatistics.org/blog/index.php?pk=308674&T=0

[TABLE]
[ROW]
Summary of computational transaction[/C][/ROW] [ROW]Raw Input[/C] view raw input (R code) [/C][/ROW] [ROW]Raw Output[/C]view raw output of R engine [/C][/ROW] [ROW]Computing time[/C]2 seconds[/C][/ROW] [ROW]R Server[/C]Big Analytics Cloud Computing Center[/C][/ROW] [/TABLE] Source: https://freestatistics.org/blog/index.php?pk=308674&T=0

Globally Unique Identifier (entire table): ba.freestatistics.org/blog/index.php?pk=308674&T=0

As an alternative you can also use a QR Code:  

The GUIDs for individual cells are displayed in the table below:

Summary of computational transaction
Raw Input view raw input (R code)
Raw Outputview raw output of R engine
Computing time2 seconds
R ServerBig Analytics Cloud Computing Center


Autocorrelation Function
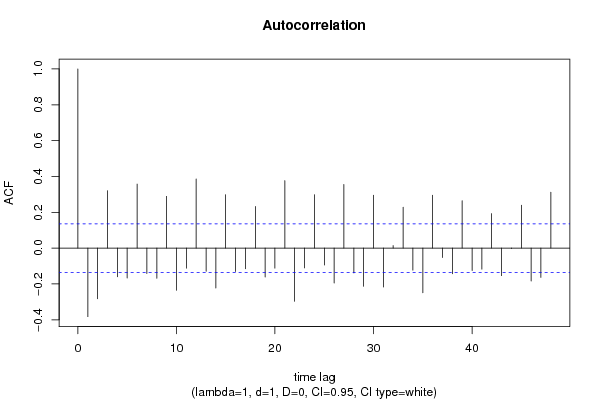
Time lag kACF(k)T-STATP-value
1-0.382685-5.55880
2-0.283218-4.1142.8e-05
30.3203694.65363e-06
4-0.159618-2.31860.010688
5-0.166928-2.42480.00808
60.3569835.18550
7-0.142334-2.06750.019953
8-0.168585-2.44880.007574
90.2889734.19762e-05
10-0.235739-3.42430.00037
11-0.111941-1.6260.052717
120.385765.60350
13-0.129736-1.88450.030434
14-0.222607-3.23360.000709
150.2979714.32831.2e-05
16-0.131084-1.90410.029128
17-0.115537-1.67830.047387
180.2322013.37290.000442
19-0.161165-2.34110.010081
20-0.111799-1.6240.052937
210.3764915.46890
22-0.296717-4.31011.3e-05
23-0.110486-1.60490.055005
240.2980214.3291.2e-05
25-0.094053-1.36620.086666
26-0.194505-2.82530.002588
270.355175.15910
28-0.138353-2.00970.022869
29-0.213495-3.10120.001095
300.2948014.28221.4e-05
31-0.216931-3.15110.000931
320.0138110.20060.420594
330.2281533.31410.000541
34-0.123105-1.78820.037589
35-0.249703-3.62720.00018
360.2947974.28221.4e-05
37-0.052541-0.76320.2231
38-0.142982-2.07690.019509
390.2646393.84418e-05
40-0.125534-1.82350.034823
41-0.117339-1.70440.044885
420.1926112.79780.00281
43-0.153938-2.23610.013197
44-0.002303-0.03350.486671
450.239613.48050.000304
46-0.183296-2.66250.004177
47-0.163701-2.37790.009152
480.3114194.52365e-06

\begin{tabular}{lllllllll}
\hline
Autocorrelation Function \tabularnewline
Time lag k & ACF(k) & T-STAT & P-value \tabularnewline
1 & -0.382685 & -5.5588 & 0 \tabularnewline
2 & -0.283218 & -4.114 & 2.8e-05 \tabularnewline
3 & 0.320369 & 4.6536 & 3e-06 \tabularnewline
4 & -0.159618 & -2.3186 & 0.010688 \tabularnewline
5 & -0.166928 & -2.4248 & 0.00808 \tabularnewline
6 & 0.356983 & 5.1855 & 0 \tabularnewline
7 & -0.142334 & -2.0675 & 0.019953 \tabularnewline
8 & -0.168585 & -2.4488 & 0.007574 \tabularnewline
9 & 0.288973 & 4.1976 & 2e-05 \tabularnewline
10 & -0.235739 & -3.4243 & 0.00037 \tabularnewline
11 & -0.111941 & -1.626 & 0.052717 \tabularnewline
12 & 0.38576 & 5.6035 & 0 \tabularnewline
13 & -0.129736 & -1.8845 & 0.030434 \tabularnewline
14 & -0.222607 & -3.2336 & 0.000709 \tabularnewline
15 & 0.297971 & 4.3283 & 1.2e-05 \tabularnewline
16 & -0.131084 & -1.9041 & 0.029128 \tabularnewline
17 & -0.115537 & -1.6783 & 0.047387 \tabularnewline
18 & 0.232201 & 3.3729 & 0.000442 \tabularnewline
19 & -0.161165 & -2.3411 & 0.010081 \tabularnewline
20 & -0.111799 & -1.624 & 0.052937 \tabularnewline
21 & 0.376491 & 5.4689 & 0 \tabularnewline
22 & -0.296717 & -4.3101 & 1.3e-05 \tabularnewline
23 & -0.110486 & -1.6049 & 0.055005 \tabularnewline
24 & 0.298021 & 4.329 & 1.2e-05 \tabularnewline
25 & -0.094053 & -1.3662 & 0.086666 \tabularnewline
26 & -0.194505 & -2.8253 & 0.002588 \tabularnewline
27 & 0.35517 & 5.1591 & 0 \tabularnewline
28 & -0.138353 & -2.0097 & 0.022869 \tabularnewline
29 & -0.213495 & -3.1012 & 0.001095 \tabularnewline
30 & 0.294801 & 4.2822 & 1.4e-05 \tabularnewline
31 & -0.216931 & -3.1511 & 0.000931 \tabularnewline
32 & 0.013811 & 0.2006 & 0.420594 \tabularnewline
33 & 0.228153 & 3.3141 & 0.000541 \tabularnewline
34 & -0.123105 & -1.7882 & 0.037589 \tabularnewline
35 & -0.249703 & -3.6272 & 0.00018 \tabularnewline
36 & 0.294797 & 4.2822 & 1.4e-05 \tabularnewline
37 & -0.052541 & -0.7632 & 0.2231 \tabularnewline
38 & -0.142982 & -2.0769 & 0.019509 \tabularnewline
39 & 0.264639 & 3.8441 & 8e-05 \tabularnewline
40 & -0.125534 & -1.8235 & 0.034823 \tabularnewline
41 & -0.117339 & -1.7044 & 0.044885 \tabularnewline
42 & 0.192611 & 2.7978 & 0.00281 \tabularnewline
43 & -0.153938 & -2.2361 & 0.013197 \tabularnewline
44 & -0.002303 & -0.0335 & 0.486671 \tabularnewline
45 & 0.23961 & 3.4805 & 0.000304 \tabularnewline
46 & -0.183296 & -2.6625 & 0.004177 \tabularnewline
47 & -0.163701 & -2.3779 & 0.009152 \tabularnewline
48 & 0.311419 & 4.5236 & 5e-06 \tabularnewline
\hline
\end{tabular}
%Source: https://freestatistics.org/blog/index.php?pk=308674&T=1

[TABLE]
[ROW][C]Autocorrelation Function[/C][/ROW]
[ROW][C]Time lag k[/C][C]ACF(k)[/C][C]T-STAT[/C][C]P-value[/C][/ROW]
[ROW][C]1[/C][C]-0.382685[/C][C]-5.5588[/C][C]0[/C][/ROW]
[ROW][C]2[/C][C]-0.283218[/C][C]-4.114[/C][C]2.8e-05[/C][/ROW]
[ROW][C]3[/C][C]0.320369[/C][C]4.6536[/C][C]3e-06[/C][/ROW]
[ROW][C]4[/C][C]-0.159618[/C][C]-2.3186[/C][C]0.010688[/C][/ROW]
[ROW][C]5[/C][C]-0.166928[/C][C]-2.4248[/C][C]0.00808[/C][/ROW]
[ROW][C]6[/C][C]0.356983[/C][C]5.1855[/C][C]0[/C][/ROW]
[ROW][C]7[/C][C]-0.142334[/C][C]-2.0675[/C][C]0.019953[/C][/ROW]
[ROW][C]8[/C][C]-0.168585[/C][C]-2.4488[/C][C]0.007574[/C][/ROW]
[ROW][C]9[/C][C]0.288973[/C][C]4.1976[/C][C]2e-05[/C][/ROW]
[ROW][C]10[/C][C]-0.235739[/C][C]-3.4243[/C][C]0.00037[/C][/ROW]
[ROW][C]11[/C][C]-0.111941[/C][C]-1.626[/C][C]0.052717[/C][/ROW]
[ROW][C]12[/C][C]0.38576[/C][C]5.6035[/C][C]0[/C][/ROW]
[ROW][C]13[/C][C]-0.129736[/C][C]-1.8845[/C][C]0.030434[/C][/ROW]
[ROW][C]14[/C][C]-0.222607[/C][C]-3.2336[/C][C]0.000709[/C][/ROW]
[ROW][C]15[/C][C]0.297971[/C][C]4.3283[/C][C]1.2e-05[/C][/ROW]
[ROW][C]16[/C][C]-0.131084[/C][C]-1.9041[/C][C]0.029128[/C][/ROW]
[ROW][C]17[/C][C]-0.115537[/C][C]-1.6783[/C][C]0.047387[/C][/ROW]
[ROW][C]18[/C][C]0.232201[/C][C]3.3729[/C][C]0.000442[/C][/ROW]
[ROW][C]19[/C][C]-0.161165[/C][C]-2.3411[/C][C]0.010081[/C][/ROW]
[ROW][C]20[/C][C]-0.111799[/C][C]-1.624[/C][C]0.052937[/C][/ROW]
[ROW][C]21[/C][C]0.376491[/C][C]5.4689[/C][C]0[/C][/ROW]
[ROW][C]22[/C][C]-0.296717[/C][C]-4.3101[/C][C]1.3e-05[/C][/ROW]
[ROW][C]23[/C][C]-0.110486[/C][C]-1.6049[/C][C]0.055005[/C][/ROW]
[ROW][C]24[/C][C]0.298021[/C][C]4.329[/C][C]1.2e-05[/C][/ROW]
[ROW][C]25[/C][C]-0.094053[/C][C]-1.3662[/C][C]0.086666[/C][/ROW]
[ROW][C]26[/C][C]-0.194505[/C][C]-2.8253[/C][C]0.002588[/C][/ROW]
[ROW][C]27[/C][C]0.35517[/C][C]5.1591[/C][C]0[/C][/ROW]
[ROW][C]28[/C][C]-0.138353[/C][C]-2.0097[/C][C]0.022869[/C][/ROW]
[ROW][C]29[/C][C]-0.213495[/C][C]-3.1012[/C][C]0.001095[/C][/ROW]
[ROW][C]30[/C][C]0.294801[/C][C]4.2822[/C][C]1.4e-05[/C][/ROW]
[ROW][C]31[/C][C]-0.216931[/C][C]-3.1511[/C][C]0.000931[/C][/ROW]
[ROW][C]32[/C][C]0.013811[/C][C]0.2006[/C][C]0.420594[/C][/ROW]
[ROW][C]33[/C][C]0.228153[/C][C]3.3141[/C][C]0.000541[/C][/ROW]
[ROW][C]34[/C][C]-0.123105[/C][C]-1.7882[/C][C]0.037589[/C][/ROW]
[ROW][C]35[/C][C]-0.249703[/C][C]-3.6272[/C][C]0.00018[/C][/ROW]
[ROW][C]36[/C][C]0.294797[/C][C]4.2822[/C][C]1.4e-05[/C][/ROW]
[ROW][C]37[/C][C]-0.052541[/C][C]-0.7632[/C][C]0.2231[/C][/ROW]
[ROW][C]38[/C][C]-0.142982[/C][C]-2.0769[/C][C]0.019509[/C][/ROW]
[ROW][C]39[/C][C]0.264639[/C][C]3.8441[/C][C]8e-05[/C][/ROW]
[ROW][C]40[/C][C]-0.125534[/C][C]-1.8235[/C][C]0.034823[/C][/ROW]
[ROW][C]41[/C][C]-0.117339[/C][C]-1.7044[/C][C]0.044885[/C][/ROW]
[ROW][C]42[/C][C]0.192611[/C][C]2.7978[/C][C]0.00281[/C][/ROW]
[ROW][C]43[/C][C]-0.153938[/C][C]-2.2361[/C][C]0.013197[/C][/ROW]
[ROW][C]44[/C][C]-0.002303[/C][C]-0.0335[/C][C]0.486671[/C][/ROW]
[ROW][C]45[/C][C]0.23961[/C][C]3.4805[/C][C]0.000304[/C][/ROW]
[ROW][C]46[/C][C]-0.183296[/C][C]-2.6625[/C][C]0.004177[/C][/ROW]
[ROW][C]47[/C][C]-0.163701[/C][C]-2.3779[/C][C]0.009152[/C][/ROW]
[ROW][C]48[/C][C]0.311419[/C][C]4.5236[/C][C]5e-06[/C][/ROW]
[/TABLE]
Source: https://freestatistics.org/blog/index.php?pk=308674&T=1

Globally Unique Identifier (entire table): ba.freestatistics.org/blog/index.php?pk=308674&T=1

As an alternative you can also use a QR Code:  

The GUIDs for individual cells are displayed in the table below:

Autocorrelation Function
Time lag kACF(k)T-STATP-value
1-0.382685-5.55880
2-0.283218-4.1142.8e-05
30.3203694.65363e-06
4-0.159618-2.31860.010688
5-0.166928-2.42480.00808
60.3569835.18550
7-0.142334-2.06750.019953
8-0.168585-2.44880.007574
90.2889734.19762e-05
10-0.235739-3.42430.00037
11-0.111941-1.6260.052717
120.385765.60350
13-0.129736-1.88450.030434
14-0.222607-3.23360.000709
150.2979714.32831.2e-05
16-0.131084-1.90410.029128
17-0.115537-1.67830.047387
180.2322013.37290.000442
19-0.161165-2.34110.010081
20-0.111799-1.6240.052937
210.3764915.46890
22-0.296717-4.31011.3e-05
23-0.110486-1.60490.055005
240.2980214.3291.2e-05
25-0.094053-1.36620.086666
26-0.194505-2.82530.002588
270.355175.15910
28-0.138353-2.00970.022869
29-0.213495-3.10120.001095
300.2948014.28221.4e-05
31-0.216931-3.15110.000931
320.0138110.20060.420594
330.2281533.31410.000541
34-0.123105-1.78820.037589
35-0.249703-3.62720.00018
360.2947974.28221.4e-05
37-0.052541-0.76320.2231
38-0.142982-2.07690.019509
390.2646393.84418e-05
40-0.125534-1.82350.034823
41-0.117339-1.70440.044885
420.1926112.79780.00281
43-0.153938-2.23610.013197
44-0.002303-0.03350.486671
450.239613.48050.000304
46-0.183296-2.66250.004177
47-0.163701-2.37790.009152
480.3114194.52365e-06


Partial Autocorrelation Function
Time lag kPACF(k)T-STATP-value
1-0.382685-5.55880
2-0.503386-7.31210
3-0.055254-0.80260.211553
4-0.218956-3.18050.000846
5-0.319046-4.63443e-06
60.029350.42630.335151
7-0.048473-0.70410.24107
8-0.102629-1.49080.068757
90.0839821.21990.11193
10-0.17952-2.60770.004884
11-0.232003-3.370.000447
120.023840.34630.364735
130.0660390.95930.169258
14-0.068634-0.9970.15996
150.0547480.79530.21368
160.0303490.44080.329888
170.0644760.93660.175025
180.0356070.51720.302773
19-0.098557-1.43160.076865
20-0.149316-2.16890.015603
210.1711092.48550.006857
22-0.071405-1.03720.150412
23-0.09082-1.31920.09426
24-0.121518-1.76510.039493
250.0225430.32750.371823
26-0.114242-1.65950.049255
270.0902651.31120.095611
280.0679940.98770.162224
29-0.036908-0.53610.296222
300.0474940.68990.245511
31-0.131221-1.90610.028999
320.0473450.68770.246189
33-0.062952-0.91440.180768
340.1058371.53740.062851
35-0.12046-1.74980.040804
36-0.088417-1.28430.100216
370.0057040.08290.467023
38-0.034525-0.50150.308267
390.0544690.79120.214857
40-0.032862-0.47740.316803
410.0789531.14690.12637
420.0186270.27060.393494
43-0.031867-0.46290.321958
440.0629070.91380.180938
450.0720061.04590.148393
460.0726781.05570.146153
47-0.025195-0.3660.357374
480.1003631.45790.073184

\begin{tabular}{lllllllll}
\hline
Partial Autocorrelation Function \tabularnewline
Time lag k & PACF(k) & T-STAT & P-value \tabularnewline
1 & -0.382685 & -5.5588 & 0 \tabularnewline
2 & -0.503386 & -7.3121 & 0 \tabularnewline
3 & -0.055254 & -0.8026 & 0.211553 \tabularnewline
4 & -0.218956 & -3.1805 & 0.000846 \tabularnewline
5 & -0.319046 & -4.6344 & 3e-06 \tabularnewline
6 & 0.02935 & 0.4263 & 0.335151 \tabularnewline
7 & -0.048473 & -0.7041 & 0.24107 \tabularnewline
8 & -0.102629 & -1.4908 & 0.068757 \tabularnewline
9 & 0.083982 & 1.2199 & 0.11193 \tabularnewline
10 & -0.17952 & -2.6077 & 0.004884 \tabularnewline
11 & -0.232003 & -3.37 & 0.000447 \tabularnewline
12 & 0.02384 & 0.3463 & 0.364735 \tabularnewline
13 & 0.066039 & 0.9593 & 0.169258 \tabularnewline
14 & -0.068634 & -0.997 & 0.15996 \tabularnewline
15 & 0.054748 & 0.7953 & 0.21368 \tabularnewline
16 & 0.030349 & 0.4408 & 0.329888 \tabularnewline
17 & 0.064476 & 0.9366 & 0.175025 \tabularnewline
18 & 0.035607 & 0.5172 & 0.302773 \tabularnewline
19 & -0.098557 & -1.4316 & 0.076865 \tabularnewline
20 & -0.149316 & -2.1689 & 0.015603 \tabularnewline
21 & 0.171109 & 2.4855 & 0.006857 \tabularnewline
22 & -0.071405 & -1.0372 & 0.150412 \tabularnewline
23 & -0.09082 & -1.3192 & 0.09426 \tabularnewline
24 & -0.121518 & -1.7651 & 0.039493 \tabularnewline
25 & 0.022543 & 0.3275 & 0.371823 \tabularnewline
26 & -0.114242 & -1.6595 & 0.049255 \tabularnewline
27 & 0.090265 & 1.3112 & 0.095611 \tabularnewline
28 & 0.067994 & 0.9877 & 0.162224 \tabularnewline
29 & -0.036908 & -0.5361 & 0.296222 \tabularnewline
30 & 0.047494 & 0.6899 & 0.245511 \tabularnewline
31 & -0.131221 & -1.9061 & 0.028999 \tabularnewline
32 & 0.047345 & 0.6877 & 0.246189 \tabularnewline
33 & -0.062952 & -0.9144 & 0.180768 \tabularnewline
34 & 0.105837 & 1.5374 & 0.062851 \tabularnewline
35 & -0.12046 & -1.7498 & 0.040804 \tabularnewline
36 & -0.088417 & -1.2843 & 0.100216 \tabularnewline
37 & 0.005704 & 0.0829 & 0.467023 \tabularnewline
38 & -0.034525 & -0.5015 & 0.308267 \tabularnewline
39 & 0.054469 & 0.7912 & 0.214857 \tabularnewline
40 & -0.032862 & -0.4774 & 0.316803 \tabularnewline
41 & 0.078953 & 1.1469 & 0.12637 \tabularnewline
42 & 0.018627 & 0.2706 & 0.393494 \tabularnewline
43 & -0.031867 & -0.4629 & 0.321958 \tabularnewline
44 & 0.062907 & 0.9138 & 0.180938 \tabularnewline
45 & 0.072006 & 1.0459 & 0.148393 \tabularnewline
46 & 0.072678 & 1.0557 & 0.146153 \tabularnewline
47 & -0.025195 & -0.366 & 0.357374 \tabularnewline
48 & 0.100363 & 1.4579 & 0.073184 \tabularnewline
\hline
\end{tabular}
%Source: https://freestatistics.org/blog/index.php?pk=308674&T=2

[TABLE]
[ROW][C]Partial Autocorrelation Function[/C][/ROW]
[ROW][C]Time lag k[/C][C]PACF(k)[/C][C]T-STAT[/C][C]P-value[/C][/ROW]
[ROW][C]1[/C][C]-0.382685[/C][C]-5.5588[/C][C]0[/C][/ROW]
[ROW][C]2[/C][C]-0.503386[/C][C]-7.3121[/C][C]0[/C][/ROW]
[ROW][C]3[/C][C]-0.055254[/C][C]-0.8026[/C][C]0.211553[/C][/ROW]
[ROW][C]4[/C][C]-0.218956[/C][C]-3.1805[/C][C]0.000846[/C][/ROW]
[ROW][C]5[/C][C]-0.319046[/C][C]-4.6344[/C][C]3e-06[/C][/ROW]
[ROW][C]6[/C][C]0.02935[/C][C]0.4263[/C][C]0.335151[/C][/ROW]
[ROW][C]7[/C][C]-0.048473[/C][C]-0.7041[/C][C]0.24107[/C][/ROW]
[ROW][C]8[/C][C]-0.102629[/C][C]-1.4908[/C][C]0.068757[/C][/ROW]
[ROW][C]9[/C][C]0.083982[/C][C]1.2199[/C][C]0.11193[/C][/ROW]
[ROW][C]10[/C][C]-0.17952[/C][C]-2.6077[/C][C]0.004884[/C][/ROW]
[ROW][C]11[/C][C]-0.232003[/C][C]-3.37[/C][C]0.000447[/C][/ROW]
[ROW][C]12[/C][C]0.02384[/C][C]0.3463[/C][C]0.364735[/C][/ROW]
[ROW][C]13[/C][C]0.066039[/C][C]0.9593[/C][C]0.169258[/C][/ROW]
[ROW][C]14[/C][C]-0.068634[/C][C]-0.997[/C][C]0.15996[/C][/ROW]
[ROW][C]15[/C][C]0.054748[/C][C]0.7953[/C][C]0.21368[/C][/ROW]
[ROW][C]16[/C][C]0.030349[/C][C]0.4408[/C][C]0.329888[/C][/ROW]
[ROW][C]17[/C][C]0.064476[/C][C]0.9366[/C][C]0.175025[/C][/ROW]
[ROW][C]18[/C][C]0.035607[/C][C]0.5172[/C][C]0.302773[/C][/ROW]
[ROW][C]19[/C][C]-0.098557[/C][C]-1.4316[/C][C]0.076865[/C][/ROW]
[ROW][C]20[/C][C]-0.149316[/C][C]-2.1689[/C][C]0.015603[/C][/ROW]
[ROW][C]21[/C][C]0.171109[/C][C]2.4855[/C][C]0.006857[/C][/ROW]
[ROW][C]22[/C][C]-0.071405[/C][C]-1.0372[/C][C]0.150412[/C][/ROW]
[ROW][C]23[/C][C]-0.09082[/C][C]-1.3192[/C][C]0.09426[/C][/ROW]
[ROW][C]24[/C][C]-0.121518[/C][C]-1.7651[/C][C]0.039493[/C][/ROW]
[ROW][C]25[/C][C]0.022543[/C][C]0.3275[/C][C]0.371823[/C][/ROW]
[ROW][C]26[/C][C]-0.114242[/C][C]-1.6595[/C][C]0.049255[/C][/ROW]
[ROW][C]27[/C][C]0.090265[/C][C]1.3112[/C][C]0.095611[/C][/ROW]
[ROW][C]28[/C][C]0.067994[/C][C]0.9877[/C][C]0.162224[/C][/ROW]
[ROW][C]29[/C][C]-0.036908[/C][C]-0.5361[/C][C]0.296222[/C][/ROW]
[ROW][C]30[/C][C]0.047494[/C][C]0.6899[/C][C]0.245511[/C][/ROW]
[ROW][C]31[/C][C]-0.131221[/C][C]-1.9061[/C][C]0.028999[/C][/ROW]
[ROW][C]32[/C][C]0.047345[/C][C]0.6877[/C][C]0.246189[/C][/ROW]
[ROW][C]33[/C][C]-0.062952[/C][C]-0.9144[/C][C]0.180768[/C][/ROW]
[ROW][C]34[/C][C]0.105837[/C][C]1.5374[/C][C]0.062851[/C][/ROW]
[ROW][C]35[/C][C]-0.12046[/C][C]-1.7498[/C][C]0.040804[/C][/ROW]
[ROW][C]36[/C][C]-0.088417[/C][C]-1.2843[/C][C]0.100216[/C][/ROW]
[ROW][C]37[/C][C]0.005704[/C][C]0.0829[/C][C]0.467023[/C][/ROW]
[ROW][C]38[/C][C]-0.034525[/C][C]-0.5015[/C][C]0.308267[/C][/ROW]
[ROW][C]39[/C][C]0.054469[/C][C]0.7912[/C][C]0.214857[/C][/ROW]
[ROW][C]40[/C][C]-0.032862[/C][C]-0.4774[/C][C]0.316803[/C][/ROW]
[ROW][C]41[/C][C]0.078953[/C][C]1.1469[/C][C]0.12637[/C][/ROW]
[ROW][C]42[/C][C]0.018627[/C][C]0.2706[/C][C]0.393494[/C][/ROW]
[ROW][C]43[/C][C]-0.031867[/C][C]-0.4629[/C][C]0.321958[/C][/ROW]
[ROW][C]44[/C][C]0.062907[/C][C]0.9138[/C][C]0.180938[/C][/ROW]
[ROW][C]45[/C][C]0.072006[/C][C]1.0459[/C][C]0.148393[/C][/ROW]
[ROW][C]46[/C][C]0.072678[/C][C]1.0557[/C][C]0.146153[/C][/ROW]
[ROW][C]47[/C][C]-0.025195[/C][C]-0.366[/C][C]0.357374[/C][/ROW]
[ROW][C]48[/C][C]0.100363[/C][C]1.4579[/C][C]0.073184[/C][/ROW]
[/TABLE]
Source: https://freestatistics.org/blog/index.php?pk=308674&T=2

Globally Unique Identifier (entire table): ba.freestatistics.org/blog/index.php?pk=308674&T=2

As an alternative you can also use a QR Code:  

The GUIDs for individual cells are displayed in the table below:

Partial Autocorrelation Function
Time lag kPACF(k)T-STATP-value
1-0.382685-5.55880
2-0.503386-7.31210
3-0.055254-0.80260.211553
4-0.218956-3.18050.000846
5-0.319046-4.63443e-06
60.029350.42630.335151
7-0.048473-0.70410.24107
8-0.102629-1.49080.068757
90.0839821.21990.11193
10-0.17952-2.60770.004884
11-0.232003-3.370.000447
120.023840.34630.364735
130.0660390.95930.169258
14-0.068634-0.9970.15996
150.0547480.79530.21368
160.0303490.44080.329888
170.0644760.93660.175025
180.0356070.51720.302773
19-0.098557-1.43160.076865
20-0.149316-2.16890.015603
210.1711092.48550.006857
22-0.071405-1.03720.150412
23-0.09082-1.31920.09426
24-0.121518-1.76510.039493
250.0225430.32750.371823
26-0.114242-1.65950.049255
270.0902651.31120.095611
280.0679940.98770.162224
29-0.036908-0.53610.296222
300.0474940.68990.245511
31-0.131221-1.90610.028999
320.0473450.68770.246189
33-0.062952-0.91440.180768
340.1058371.53740.062851
35-0.12046-1.74980.040804
36-0.088417-1.28430.100216
370.0057040.08290.467023
38-0.034525-0.50150.308267
390.0544690.79120.214857
40-0.032862-0.47740.316803
410.0789531.14690.12637
420.0186270.27060.393494
43-0.031867-0.46290.321958
440.0629070.91380.180938
450.0720061.04590.148393
460.0726781.05570.146153
47-0.025195-0.3660.357374
480.1003631.45790.073184


Parameters (Session):
par1 = 48 ; par2 = 1 ; par3 = 1 ; par4 = 0 ; par5 = 12 ; par6 = White Noise ; par7 = 0.95 ;
Parameters (R input):
par1 = 48 ; par2 = 1 ; par3 = 1 ; par4 = 0 ; par5 = 12 ; par6 = White Noise ; par7 = 0.95 ; par8 = ;
R code (references can be found in the software module):
par8 <- ''
par7 <- '0.95'
par6 <- 'White Noise'
par5 <- '12'
par4 <- '0'
par3 <- '1'
par2 <- '1'
par1 <- 'Default'
if (par1 == 'Default') {
par1 = 10*log10(length(x))
} else {
par1 <- as.numeric(par1)
}
par2 <- as.numeric(par2)
par3 <- as.numeric(par3)
par4 <- as.numeric(par4)
par5 <- as.numeric(par5)
if (par6 == 'White Noise') par6 <- 'white' else par6 <- 'ma'
par7 <- as.numeric(par7)
if (par8 != '') par8 <- as.numeric(par8)
x <- na.omit(x)
ox <- x
if (par8 == '') {
if (par2 == 0) {
x <- log(x)
} else {
x <- (x ^ par2 - 1) / par2
}
} else {
x <- log(x,base=par8)
}
if (par3 > 0) x <- diff(x,lag=1,difference=par3)
if (par4 > 0) x <- diff(x,lag=par5,difference=par4)
bitmap(file='picts.png')
op <- par(mfrow=c(2,1))
plot(ox,type='l',main='Original Time Series',xlab='time',ylab='value')
if (par8=='') {
mytitle <- paste('Working Time Series (lambda=',par2,', d=',par3,', D=',par4,')',sep='')
mysub <- paste('(lambda=',par2,', d=',par3,', D=',par4,', CI=', par7, ', CI type=',par6,')',sep='')
} else {
mytitle <- paste('Working Time Series (base=',par8,', d=',par3,', D=',par4,')',sep='')
mysub <- paste('(base=',par8,', d=',par3,', D=',par4,', CI=', par7, ', CI type=',par6,')',sep='')
}
plot(x,type='l', main=mytitle,xlab='time',ylab='value')
par(op)
dev.off()
bitmap(file='pic1.png')
racf <- acf(x, par1, main='Autocorrelation', xlab='time lag', ylab='ACF', ci.type=par6, ci=par7, sub=mysub)
dev.off()
bitmap(file='pic2.png')
rpacf <- pacf(x,par1,main='Partial Autocorrelation',xlab='lags',ylab='PACF',sub=mysub)
dev.off()
(myacf <- c(racf$acf))
(mypacf <- c(rpacf$acf))
lengthx <- length(x)
sqrtn <- sqrt(lengthx)
load(file='createtable')
a<-table.start()
a<-table.row.start(a)
a<-table.element(a,'Autocorrelation Function',4,TRUE)
a<-table.row.end(a)
a<-table.row.start(a)
a<-table.element(a,'Time lag k',header=TRUE)
a<-table.element(a,'ACF(k)',header=TRUE)
a<-table.element(a,'T-STAT',header=TRUE)
a<-table.element(a,'P-value',header=TRUE)
a<-table.row.end(a)
for (i in 2:(par1+1)) {
a<-table.row.start(a)
a<-table.element(a,i-1,header=TRUE)
a<-table.element(a,round(myacf[i],6))
mytstat <- myacf[i]*sqrtn
a<-table.element(a,round(mytstat,4))
a<-table.element(a,round(1-pt(abs(mytstat),lengthx),6))
a<-table.row.end(a)
}
a<-table.end(a)
table.save(a,file='mytable.tab')
a<-table.start()
a<-table.row.start(a)
a<-table.element(a,'Partial Autocorrelation Function',4,TRUE)
a<-table.row.end(a)
a<-table.row.start(a)
a<-table.element(a,'Time lag k',header=TRUE)
a<-table.element(a,'PACF(k)',header=TRUE)
a<-table.element(a,'T-STAT',header=TRUE)
a<-table.element(a,'P-value',header=TRUE)
a<-table.row.end(a)
for (i in 1:par1) {
a<-table.row.start(a)
a<-table.element(a,i,header=TRUE)
a<-table.element(a,round(mypacf[i],6))
mytstat <- mypacf[i]*sqrtn
a<-table.element(a,round(mytstat,4))
a<-table.element(a,round(1-pt(abs(mytstat),lengthx),6))
a<-table.row.end(a)
}
a<-table.end(a)
table.save(a,file='mytable1.tab')