Free Statistics

of Irreproducible Research!

Author's title

Author*The author of this computation has been verified*
R Software Modulerwasp_autocorrelation.wasp
Title produced by software(Partial) Autocorrelation Function
Date of computationWed, 06 Dec 2017 17:57:57 +0100
Cite this page as followsStatistical Computations at FreeStatistics.org, Office for Research Development and Education, URL https://freestatistics.org/blog/index.php?v=date/2017/Dec/06/t1512579522fog8rcc440ybj8y.htm/, Retrieved Mon, 13 May 2024 23:16:29 +0000
Statistical Computations at FreeStatistics.org, Office for Research Development and Education, URL https://freestatistics.org/blog/index.php?pk=308626, Retrieved Mon, 13 May 2024 23:16:29 +0000
QR Codes:

Original text written by user:
IsPrivate?No (this computation is public)
User-defined keywords
Estimated Impact92
Family? (F = Feedback message, R = changed R code, M = changed R Module, P = changed Parameters, D = changed Data)
-       [(Partial) Autocorrelation Function] [autocorrelation (...] [2017-12-06 16:57:57] [33956d13de8d8b5d5d1b78ead3554acb] [Current]
Feedback Forum

Post a new message
Dataseries X:
53.1
64.1
75.3
66
73.6
73.2
53.5
60.6
73
72.4
75.8
79.6
77.8
75.7
88.5
72.9
80.8
86.6
63.8
69.2
76.5
77.1
75.3
69.5
64.3
66.7
77.3
75.3
73.4
78
61
58.4
73.4
82.3
72.2
76
64.3
70.8
74
71.4
70.1
77.6
61.2
52.1
74.4
73.1
70.9
80.7
62.9
69.3
82.3
76.2
70.8
87.3
62
66.9
84.4
82.6
77.7
87
76
76.3
88.8
81.2
74.5
98.1
63.3
67.7
85.8
78.6
87.2
106.4
75
80.4
94.8
77
91
96.7
69.2
69.5
93.7
98.5
93.3
100.4
87.4
89
106.1
92.5
96.6
113.3
87.6
89.2
115.6
133.2
111.1
113.1
102
109.3
111.1
116.8
107.5
120.5
95.5
87.9
118.6
116.3
98.8
102.9
80.4
87
97.4
87.2
110.6
101.1
69.1
77.4
95
93.2
96.3
93.9
78.5
90
109.2
94.3
93.1
114.5
78.5
88.3
114.8
112.2
106.9
119.7
97.1
106.3
131.7
106.7
124
117.2
87.8
91.9
125.1
115.4
117.7
124.3
104.8
109.6
139.5
105.3
112.4
128.9
91.6
98.7
117.8
117.4
110.5
103.1
95.8
98.2
117.2
108.5
113.2
120.2
102.8
89.4
119.8
126.9
114.4
117.4
109.4
111.1
121
116.6
119.5
121.2
101
92.7
125.5
123.4
110.3
118.8
97.1
107.6
131
117.9
111
131.4
101.8
93.9
138.5
131.1
124.9
126.6
102.7
121.6
132.8
123
116
135
93.7
98.4
129.8
121.9
124.8
126.9
102
117.7
144.8
113.3
129.3
135.7
94.3
106


Summary of computational transaction
Raw Input view raw input (R code)
Raw Outputview raw output of R engine
Computing time2 seconds
R ServerBig Analytics Cloud Computing Center

\begin{tabular}{lllllllll}
\hline
Summary of computational transaction \tabularnewline
Raw Input view raw input (R code)  \tabularnewline
Raw Outputview raw output of R engine  \tabularnewline
Computing time2 seconds \tabularnewline
R ServerBig Analytics Cloud Computing Center \tabularnewline
\hline
\end{tabular}
%Source: https://freestatistics.org/blog/index.php?pk=308626&T=0

[TABLE]
[ROW]
Summary of computational transaction[/C][/ROW] [ROW]Raw Input[/C] view raw input (R code) [/C][/ROW] [ROW]Raw Output[/C]view raw output of R engine [/C][/ROW] [ROW]Computing time[/C]2 seconds[/C][/ROW] [ROW]R Server[/C]Big Analytics Cloud Computing Center[/C][/ROW] [/TABLE] Source: https://freestatistics.org/blog/index.php?pk=308626&T=0

Globally Unique Identifier (entire table): ba.freestatistics.org/blog/index.php?pk=308626&T=0

As an alternative you can also use a QR Code:  

The GUIDs for individual cells are displayed in the table below:

Summary of computational transaction
Raw Input view raw input (R code)
Raw Outputview raw output of R engine
Computing time2 seconds
R ServerBig Analytics Cloud Computing Center


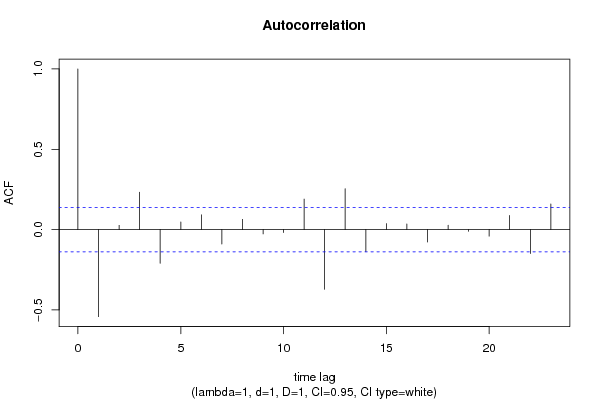
Autocorrelation Function
Time lag kACF(k)T-STATP-value
1-0.54211-7.64740
20.026310.37110.355463
30.2322493.27630.00062
4-0.209399-2.95390.001758
50.0467390.65930.255221
60.0914881.29060.09917
7-0.089561-1.26340.103959
80.0637860.89980.184653
9-0.027059-0.38170.351541
10-0.018393-0.25950.39777
110.18952.67320.004068
12-0.371624-5.24240
130.2540663.5840.000213
14-0.136073-1.91950.028173
150.036990.52180.301194
160.0351420.49570.310314
17-0.077233-1.08950.138625
180.027150.3830.351065
19-0.010473-0.14770.441347
20-0.040734-0.57460.283097
210.0872581.23090.109901
22-0.149497-2.10890.018101
230.1595992.25140.012726

\begin{tabular}{lllllllll}
\hline
Autocorrelation Function \tabularnewline
Time lag k & ACF(k) & T-STAT & P-value \tabularnewline
1 & -0.54211 & -7.6474 & 0 \tabularnewline
2 & 0.02631 & 0.3711 & 0.355463 \tabularnewline
3 & 0.232249 & 3.2763 & 0.00062 \tabularnewline
4 & -0.209399 & -2.9539 & 0.001758 \tabularnewline
5 & 0.046739 & 0.6593 & 0.255221 \tabularnewline
6 & 0.091488 & 1.2906 & 0.09917 \tabularnewline
7 & -0.089561 & -1.2634 & 0.103959 \tabularnewline
8 & 0.063786 & 0.8998 & 0.184653 \tabularnewline
9 & -0.027059 & -0.3817 & 0.351541 \tabularnewline
10 & -0.018393 & -0.2595 & 0.39777 \tabularnewline
11 & 0.1895 & 2.6732 & 0.004068 \tabularnewline
12 & -0.371624 & -5.2424 & 0 \tabularnewline
13 & 0.254066 & 3.584 & 0.000213 \tabularnewline
14 & -0.136073 & -1.9195 & 0.028173 \tabularnewline
15 & 0.03699 & 0.5218 & 0.301194 \tabularnewline
16 & 0.035142 & 0.4957 & 0.310314 \tabularnewline
17 & -0.077233 & -1.0895 & 0.138625 \tabularnewline
18 & 0.02715 & 0.383 & 0.351065 \tabularnewline
19 & -0.010473 & -0.1477 & 0.441347 \tabularnewline
20 & -0.040734 & -0.5746 & 0.283097 \tabularnewline
21 & 0.087258 & 1.2309 & 0.109901 \tabularnewline
22 & -0.149497 & -2.1089 & 0.018101 \tabularnewline
23 & 0.159599 & 2.2514 & 0.012726 \tabularnewline
\hline
\end{tabular}
%Source: https://freestatistics.org/blog/index.php?pk=308626&T=1

[TABLE]
[ROW][C]Autocorrelation Function[/C][/ROW]
[ROW][C]Time lag k[/C][C]ACF(k)[/C][C]T-STAT[/C][C]P-value[/C][/ROW]
[ROW][C]1[/C][C]-0.54211[/C][C]-7.6474[/C][C]0[/C][/ROW]
[ROW][C]2[/C][C]0.02631[/C][C]0.3711[/C][C]0.355463[/C][/ROW]
[ROW][C]3[/C][C]0.232249[/C][C]3.2763[/C][C]0.00062[/C][/ROW]
[ROW][C]4[/C][C]-0.209399[/C][C]-2.9539[/C][C]0.001758[/C][/ROW]
[ROW][C]5[/C][C]0.046739[/C][C]0.6593[/C][C]0.255221[/C][/ROW]
[ROW][C]6[/C][C]0.091488[/C][C]1.2906[/C][C]0.09917[/C][/ROW]
[ROW][C]7[/C][C]-0.089561[/C][C]-1.2634[/C][C]0.103959[/C][/ROW]
[ROW][C]8[/C][C]0.063786[/C][C]0.8998[/C][C]0.184653[/C][/ROW]
[ROW][C]9[/C][C]-0.027059[/C][C]-0.3817[/C][C]0.351541[/C][/ROW]
[ROW][C]10[/C][C]-0.018393[/C][C]-0.2595[/C][C]0.39777[/C][/ROW]
[ROW][C]11[/C][C]0.1895[/C][C]2.6732[/C][C]0.004068[/C][/ROW]
[ROW][C]12[/C][C]-0.371624[/C][C]-5.2424[/C][C]0[/C][/ROW]
[ROW][C]13[/C][C]0.254066[/C][C]3.584[/C][C]0.000213[/C][/ROW]
[ROW][C]14[/C][C]-0.136073[/C][C]-1.9195[/C][C]0.028173[/C][/ROW]
[ROW][C]15[/C][C]0.03699[/C][C]0.5218[/C][C]0.301194[/C][/ROW]
[ROW][C]16[/C][C]0.035142[/C][C]0.4957[/C][C]0.310314[/C][/ROW]
[ROW][C]17[/C][C]-0.077233[/C][C]-1.0895[/C][C]0.138625[/C][/ROW]
[ROW][C]18[/C][C]0.02715[/C][C]0.383[/C][C]0.351065[/C][/ROW]
[ROW][C]19[/C][C]-0.010473[/C][C]-0.1477[/C][C]0.441347[/C][/ROW]
[ROW][C]20[/C][C]-0.040734[/C][C]-0.5746[/C][C]0.283097[/C][/ROW]
[ROW][C]21[/C][C]0.087258[/C][C]1.2309[/C][C]0.109901[/C][/ROW]
[ROW][C]22[/C][C]-0.149497[/C][C]-2.1089[/C][C]0.018101[/C][/ROW]
[ROW][C]23[/C][C]0.159599[/C][C]2.2514[/C][C]0.012726[/C][/ROW]
[/TABLE]
Source: https://freestatistics.org/blog/index.php?pk=308626&T=1

Globally Unique Identifier (entire table): ba.freestatistics.org/blog/index.php?pk=308626&T=1

As an alternative you can also use a QR Code:  

The GUIDs for individual cells are displayed in the table below:

Autocorrelation Function
Time lag kACF(k)T-STATP-value
1-0.54211-7.64740
20.026310.37110.355463
30.2322493.27630.00062
4-0.209399-2.95390.001758
50.0467390.65930.255221
60.0914881.29060.09917
7-0.089561-1.26340.103959
80.0637860.89980.184653
9-0.027059-0.38170.351541
10-0.018393-0.25950.39777
110.18952.67320.004068
12-0.371624-5.24240
130.2540663.5840.000213
14-0.136073-1.91950.028173
150.036990.52180.301194
160.0351420.49570.310314
17-0.077233-1.08950.138625
180.027150.3830.351065
19-0.010473-0.14770.441347
20-0.040734-0.57460.283097
210.0872581.23090.109901
22-0.149497-2.10890.018101
230.1595992.25140.012726


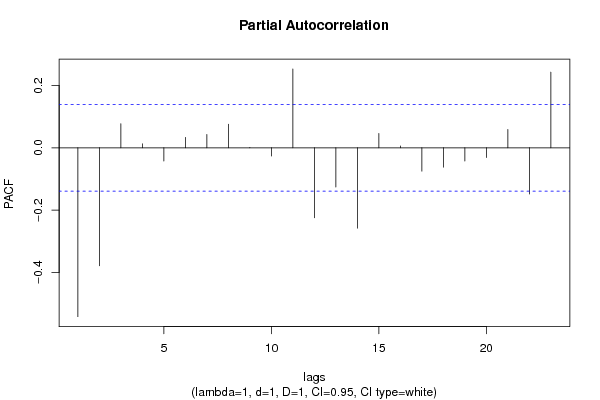
Partial Autocorrelation Function
Time lag kPACF(k)T-STATP-value
1-0.54211-7.64740
2-0.378937-5.34560
30.0768791.08450.139725
40.0126160.1780.429462
5-0.042592-0.60080.274317
60.0332540.46910.319754
70.0428050.60380.273318
80.0756051.06650.143736
90.0007530.01060.495767
10-0.026672-0.37630.353563
110.2529783.56870.000225
12-0.224665-3.16930.000885
13-0.12597-1.7770.038546
14-0.258031-3.640.000174
150.0458470.64670.25927
160.0056770.08010.468127
17-0.075091-1.05930.145376
18-0.06211-0.87620.190997
19-0.042449-0.59880.27499
20-0.031293-0.44140.329684
210.0588280.82990.203805
22-0.14822-2.09090.018904
230.2426863.42350.000375

\begin{tabular}{lllllllll}
\hline
Partial Autocorrelation Function \tabularnewline
Time lag k & PACF(k) & T-STAT & P-value \tabularnewline
1 & -0.54211 & -7.6474 & 0 \tabularnewline
2 & -0.378937 & -5.3456 & 0 \tabularnewline
3 & 0.076879 & 1.0845 & 0.139725 \tabularnewline
4 & 0.012616 & 0.178 & 0.429462 \tabularnewline
5 & -0.042592 & -0.6008 & 0.274317 \tabularnewline
6 & 0.033254 & 0.4691 & 0.319754 \tabularnewline
7 & 0.042805 & 0.6038 & 0.273318 \tabularnewline
8 & 0.075605 & 1.0665 & 0.143736 \tabularnewline
9 & 0.000753 & 0.0106 & 0.495767 \tabularnewline
10 & -0.026672 & -0.3763 & 0.353563 \tabularnewline
11 & 0.252978 & 3.5687 & 0.000225 \tabularnewline
12 & -0.224665 & -3.1693 & 0.000885 \tabularnewline
13 & -0.12597 & -1.777 & 0.038546 \tabularnewline
14 & -0.258031 & -3.64 & 0.000174 \tabularnewline
15 & 0.045847 & 0.6467 & 0.25927 \tabularnewline
16 & 0.005677 & 0.0801 & 0.468127 \tabularnewline
17 & -0.075091 & -1.0593 & 0.145376 \tabularnewline
18 & -0.06211 & -0.8762 & 0.190997 \tabularnewline
19 & -0.042449 & -0.5988 & 0.27499 \tabularnewline
20 & -0.031293 & -0.4414 & 0.329684 \tabularnewline
21 & 0.058828 & 0.8299 & 0.203805 \tabularnewline
22 & -0.14822 & -2.0909 & 0.018904 \tabularnewline
23 & 0.242686 & 3.4235 & 0.000375 \tabularnewline
\hline
\end{tabular}
%Source: https://freestatistics.org/blog/index.php?pk=308626&T=2

[TABLE]
[ROW][C]Partial Autocorrelation Function[/C][/ROW]
[ROW][C]Time lag k[/C][C]PACF(k)[/C][C]T-STAT[/C][C]P-value[/C][/ROW]
[ROW][C]1[/C][C]-0.54211[/C][C]-7.6474[/C][C]0[/C][/ROW]
[ROW][C]2[/C][C]-0.378937[/C][C]-5.3456[/C][C]0[/C][/ROW]
[ROW][C]3[/C][C]0.076879[/C][C]1.0845[/C][C]0.139725[/C][/ROW]
[ROW][C]4[/C][C]0.012616[/C][C]0.178[/C][C]0.429462[/C][/ROW]
[ROW][C]5[/C][C]-0.042592[/C][C]-0.6008[/C][C]0.274317[/C][/ROW]
[ROW][C]6[/C][C]0.033254[/C][C]0.4691[/C][C]0.319754[/C][/ROW]
[ROW][C]7[/C][C]0.042805[/C][C]0.6038[/C][C]0.273318[/C][/ROW]
[ROW][C]8[/C][C]0.075605[/C][C]1.0665[/C][C]0.143736[/C][/ROW]
[ROW][C]9[/C][C]0.000753[/C][C]0.0106[/C][C]0.495767[/C][/ROW]
[ROW][C]10[/C][C]-0.026672[/C][C]-0.3763[/C][C]0.353563[/C][/ROW]
[ROW][C]11[/C][C]0.252978[/C][C]3.5687[/C][C]0.000225[/C][/ROW]
[ROW][C]12[/C][C]-0.224665[/C][C]-3.1693[/C][C]0.000885[/C][/ROW]
[ROW][C]13[/C][C]-0.12597[/C][C]-1.777[/C][C]0.038546[/C][/ROW]
[ROW][C]14[/C][C]-0.258031[/C][C]-3.64[/C][C]0.000174[/C][/ROW]
[ROW][C]15[/C][C]0.045847[/C][C]0.6467[/C][C]0.25927[/C][/ROW]
[ROW][C]16[/C][C]0.005677[/C][C]0.0801[/C][C]0.468127[/C][/ROW]
[ROW][C]17[/C][C]-0.075091[/C][C]-1.0593[/C][C]0.145376[/C][/ROW]
[ROW][C]18[/C][C]-0.06211[/C][C]-0.8762[/C][C]0.190997[/C][/ROW]
[ROW][C]19[/C][C]-0.042449[/C][C]-0.5988[/C][C]0.27499[/C][/ROW]
[ROW][C]20[/C][C]-0.031293[/C][C]-0.4414[/C][C]0.329684[/C][/ROW]
[ROW][C]21[/C][C]0.058828[/C][C]0.8299[/C][C]0.203805[/C][/ROW]
[ROW][C]22[/C][C]-0.14822[/C][C]-2.0909[/C][C]0.018904[/C][/ROW]
[ROW][C]23[/C][C]0.242686[/C][C]3.4235[/C][C]0.000375[/C][/ROW]
[/TABLE]
Source: https://freestatistics.org/blog/index.php?pk=308626&T=2

Globally Unique Identifier (entire table): ba.freestatistics.org/blog/index.php?pk=308626&T=2

As an alternative you can also use a QR Code:  

The GUIDs for individual cells are displayed in the table below:

Partial Autocorrelation Function
Time lag kPACF(k)T-STATP-value
1-0.54211-7.64740
2-0.378937-5.34560
30.0768791.08450.139725
40.0126160.1780.429462
5-0.042592-0.60080.274317
60.0332540.46910.319754
70.0428050.60380.273318
80.0756051.06650.143736
90.0007530.01060.495767
10-0.026672-0.37630.353563
110.2529783.56870.000225
12-0.224665-3.16930.000885
13-0.12597-1.7770.038546
14-0.258031-3.640.000174
150.0458470.64670.25927
160.0056770.08010.468127
17-0.075091-1.05930.145376
18-0.06211-0.87620.190997
19-0.042449-0.59880.27499
20-0.031293-0.44140.329684
210.0588280.82990.203805
22-0.14822-2.09090.018904
230.2426863.42350.000375


Parameters (Session):
par1 = Default ; par2 = 1 ; par3 = 1 ; par4 = 1 ; par5 = 12 ; par6 = White Noise ; par7 = 0.95 ;
Parameters (R input):
par1 = Default ; par2 = 1 ; par3 = 1 ; par4 = 1 ; par5 = 12 ; par6 = White Noise ; par7 = 0.95 ; par8 = ;
R code (references can be found in the software module):
if (par1 == 'Default') {
par1 = 10*log10(length(x))
} else {
par1 <- as.numeric(par1)
}
par2 <- as.numeric(par2)
par3 <- as.numeric(par3)
par4 <- as.numeric(par4)
par5 <- as.numeric(par5)
if (par6 == 'White Noise') par6 <- 'white' else par6 <- 'ma'
par7 <- as.numeric(par7)
if (par8 != '') par8 <- as.numeric(par8)
x <- na.omit(x)
ox <- x
if (par8 == '') {
if (par2 == 0) {
x <- log(x)
} else {
x <- (x ^ par2 - 1) / par2
}
} else {
x <- log(x,base=par8)
}
if (par3 > 0) x <- diff(x,lag=1,difference=par3)
if (par4 > 0) x <- diff(x,lag=par5,difference=par4)
bitmap(file='picts.png')
op <- par(mfrow=c(2,1))
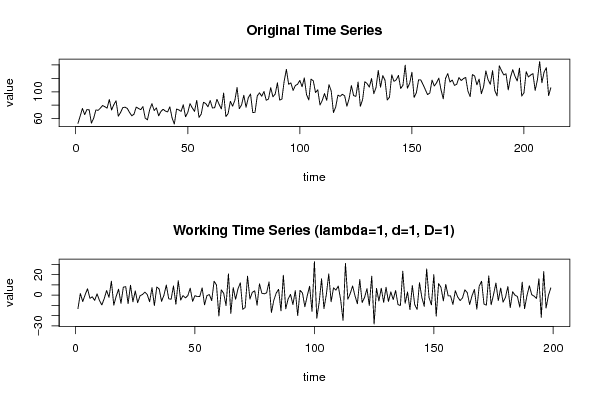
plot(ox,type='l',main='Original Time Series',xlab='time',ylab='value')
if (par8=='') {
mytitle <- paste('Working Time Series (lambda=',par2,', d=',par3,', D=',par4,')',sep='')
mysub <- paste('(lambda=',par2,', d=',par3,', D=',par4,', CI=', par7, ', CI type=',par6,')',sep='')
} else {
mytitle <- paste('Working Time Series (base=',par8,', d=',par3,', D=',par4,')',sep='')
mysub <- paste('(base=',par8,', d=',par3,', D=',par4,', CI=', par7, ', CI type=',par6,')',sep='')
}
plot(x,type='l', main=mytitle,xlab='time',ylab='value')
par(op)
dev.off()
bitmap(file='pic1.png')
racf <- acf(x, par1, main='Autocorrelation', xlab='time lag', ylab='ACF', ci.type=par6, ci=par7, sub=mysub)
dev.off()
bitmap(file='pic2.png')
rpacf <- pacf(x,par1,main='Partial Autocorrelation',xlab='lags',ylab='PACF',sub=mysub)
dev.off()
(myacf <- c(racf$acf))
(mypacf <- c(rpacf$acf))
lengthx <- length(x)
sqrtn <- sqrt(lengthx)
load(file='createtable')
a<-table.start()
a<-table.row.start(a)
a<-table.element(a,'Autocorrelation Function',4,TRUE)
a<-table.row.end(a)
a<-table.row.start(a)
a<-table.element(a,'Time lag k',header=TRUE)
a<-table.element(a,'ACF(k)',header=TRUE)
a<-table.element(a,'T-STAT',header=TRUE)
a<-table.element(a,'P-value',header=TRUE)
a<-table.row.end(a)
for (i in 2:(par1+1)) {
a<-table.row.start(a)
a<-table.element(a,i-1,header=TRUE)
a<-table.element(a,round(myacf[i],6))
mytstat <- myacf[i]*sqrtn
a<-table.element(a,round(mytstat,4))
a<-table.element(a,round(1-pt(abs(mytstat),lengthx),6))
a<-table.row.end(a)
}
a<-table.end(a)
table.save(a,file='mytable.tab')
a<-table.start()
a<-table.row.start(a)
a<-table.element(a,'Partial Autocorrelation Function',4,TRUE)
a<-table.row.end(a)
a<-table.row.start(a)
a<-table.element(a,'Time lag k',header=TRUE)
a<-table.element(a,'PACF(k)',header=TRUE)
a<-table.element(a,'T-STAT',header=TRUE)
a<-table.element(a,'P-value',header=TRUE)
a<-table.row.end(a)
for (i in 1:par1) {
a<-table.row.start(a)
a<-table.element(a,i,header=TRUE)
a<-table.element(a,round(mypacf[i],6))
mytstat <- mypacf[i]*sqrtn
a<-table.element(a,round(mytstat,4))
a<-table.element(a,round(1-pt(abs(mytstat),lengthx),6))
a<-table.row.end(a)
}
a<-table.end(a)
table.save(a,file='mytable1.tab')