Free Statistics

of Irreproducible Research!

Author's title

Author*The author of this computation has been verified*
R Software Modulerwasp_autocorrelation.wasp
Title produced by software(Partial) Autocorrelation Function
Date of computationWed, 06 Dec 2017 17:56:27 +0100
Cite this page as followsStatistical Computations at FreeStatistics.org, Office for Research Development and Education, URL https://freestatistics.org/blog/index.php?v=date/2017/Dec/06/t1512579417cth5ej0jgfh49b8.htm/, Retrieved Tue, 14 May 2024 21:39:19 +0000
Statistical Computations at FreeStatistics.org, Office for Research Development and Education, URL https://freestatistics.org/blog/index.php?pk=308625, Retrieved Tue, 14 May 2024 21:39:19 +0000
QR Codes:

Original text written by user:
IsPrivate?No (this computation is public)
User-defined keywords
Estimated Impact104
Family? (F = Feedback message, R = changed R code, M = changed R Module, P = changed Parameters, D = changed Data)
-       [(Partial) Autocorrelation Function] [autocorrelation (...] [2017-12-06 16:56:27] [33956d13de8d8b5d5d1b78ead3554acb] [Current]
Feedback Forum

Post a new message
Dataseries X:
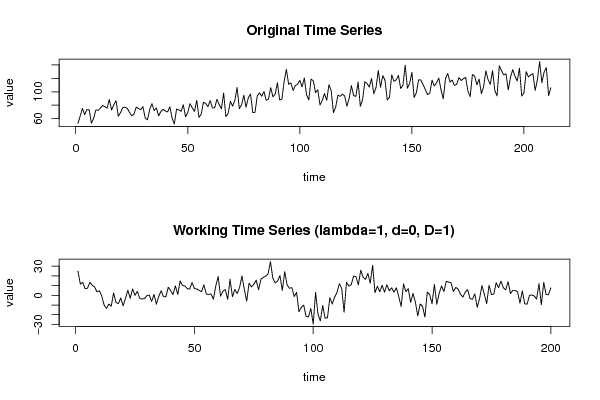
53.1
64.1
75.3
66
73.6
73.2
53.5
60.6
73
72.4
75.8
79.6
77.8
75.7
88.5
72.9
80.8
86.6
63.8
69.2
76.5
77.1
75.3
69.5
64.3
66.7
77.3
75.3
73.4
78
61
58.4
73.4
82.3
72.2
76
64.3
70.8
74
71.4
70.1
77.6
61.2
52.1
74.4
73.1
70.9
80.7
62.9
69.3
82.3
76.2
70.8
87.3
62
66.9
84.4
82.6
77.7
87
76
76.3
88.8
81.2
74.5
98.1
63.3
67.7
85.8
78.6
87.2
106.4
75
80.4
94.8
77
91
96.7
69.2
69.5
93.7
98.5
93.3
100.4
87.4
89
106.1
92.5
96.6
113.3
87.6
89.2
115.6
133.2
111.1
113.1
102
109.3
111.1
116.8
107.5
120.5
95.5
87.9
118.6
116.3
98.8
102.9
80.4
87
97.4
87.2
110.6
101.1
69.1
77.4
95
93.2
96.3
93.9
78.5
90
109.2
94.3
93.1
114.5
78.5
88.3
114.8
112.2
106.9
119.7
97.1
106.3
131.7
106.7
124
117.2
87.8
91.9
125.1
115.4
117.7
124.3
104.8
109.6
139.5
105.3
112.4
128.9
91.6
98.7
117.8
117.4
110.5
103.1
95.8
98.2
117.2
108.5
113.2
120.2
102.8
89.4
119.8
126.9
114.4
117.4
109.4
111.1
121
116.6
119.5
121.2
101
92.7
125.5
123.4
110.3
118.8
97.1
107.6
131
117.9
111
131.4
101.8
93.9
138.5
131.1
124.9
126.6
102.7
121.6
132.8
123
116
135
93.7
98.4
129.8
121.9
124.8
126.9
102
117.7
144.8
113.3
129.3
135.7
94.3
106


Summary of computational transaction
Raw Input view raw input (R code)
Raw Outputview raw output of R engine
Computing time2 seconds
R ServerBig Analytics Cloud Computing Center

\begin{tabular}{lllllllll}
\hline
Summary of computational transaction \tabularnewline
Raw Input view raw input (R code)  \tabularnewline
Raw Outputview raw output of R engine  \tabularnewline
Computing time2 seconds \tabularnewline
R ServerBig Analytics Cloud Computing Center \tabularnewline
\hline
\end{tabular}
%Source: https://freestatistics.org/blog/index.php?pk=308625&T=0

[TABLE]
[ROW]
Summary of computational transaction[/C][/ROW] [ROW]Raw Input[/C] view raw input (R code) [/C][/ROW] [ROW]Raw Output[/C]view raw output of R engine [/C][/ROW] [ROW]Computing time[/C]2 seconds[/C][/ROW] [ROW]R Server[/C]Big Analytics Cloud Computing Center[/C][/ROW] [/TABLE] Source: https://freestatistics.org/blog/index.php?pk=308625&T=0

Globally Unique Identifier (entire table): ba.freestatistics.org/blog/index.php?pk=308625&T=0

As an alternative you can also use a QR Code:  

The GUIDs for individual cells are displayed in the table below:

Summary of computational transaction
Raw Input view raw input (R code)
Raw Outputview raw output of R engine
Computing time2 seconds
R ServerBig Analytics Cloud Computing Center


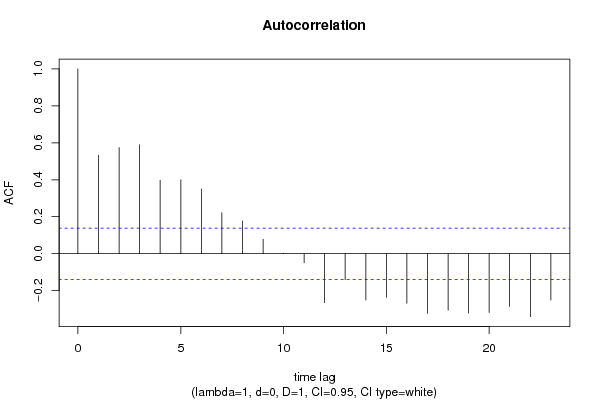
Autocorrelation Function
Time lag kACF(k)T-STATP-value
10.5324927.53060
20.5739898.11740
30.5898818.34220
40.3969775.61410
50.3995585.65060
60.3494284.94171e-06
70.2215983.13390.000992
80.1765542.49680.006669
90.0777671.09980.136373
100.0026470.03740.485091
11-0.049083-0.69410.244201
12-0.265136-3.74960.000116
13-0.140859-1.99210.023863
14-0.250551-3.54330.000246
15-0.236038-3.33810.000503
16-0.268297-3.79439.8e-05
17-0.3235-4.5754e-06
18-0.306325-4.33211.2e-05
19-0.321682-4.54935e-06
20-0.318317-4.50176e-06
21-0.285305-4.03483.9e-05
22-0.34108-4.82361e-06
23-0.251104-3.55120.000239

\begin{tabular}{lllllllll}
\hline
Autocorrelation Function \tabularnewline
Time lag k & ACF(k) & T-STAT & P-value \tabularnewline
1 & 0.532492 & 7.5306 & 0 \tabularnewline
2 & 0.573989 & 8.1174 & 0 \tabularnewline
3 & 0.589881 & 8.3422 & 0 \tabularnewline
4 & 0.396977 & 5.6141 & 0 \tabularnewline
5 & 0.399558 & 5.6506 & 0 \tabularnewline
6 & 0.349428 & 4.9417 & 1e-06 \tabularnewline
7 & 0.221598 & 3.1339 & 0.000992 \tabularnewline
8 & 0.176554 & 2.4968 & 0.006669 \tabularnewline
9 & 0.077767 & 1.0998 & 0.136373 \tabularnewline
10 & 0.002647 & 0.0374 & 0.485091 \tabularnewline
11 & -0.049083 & -0.6941 & 0.244201 \tabularnewline
12 & -0.265136 & -3.7496 & 0.000116 \tabularnewline
13 & -0.140859 & -1.9921 & 0.023863 \tabularnewline
14 & -0.250551 & -3.5433 & 0.000246 \tabularnewline
15 & -0.236038 & -3.3381 & 0.000503 \tabularnewline
16 & -0.268297 & -3.7943 & 9.8e-05 \tabularnewline
17 & -0.3235 & -4.575 & 4e-06 \tabularnewline
18 & -0.306325 & -4.3321 & 1.2e-05 \tabularnewline
19 & -0.321682 & -4.5493 & 5e-06 \tabularnewline
20 & -0.318317 & -4.5017 & 6e-06 \tabularnewline
21 & -0.285305 & -4.0348 & 3.9e-05 \tabularnewline
22 & -0.34108 & -4.8236 & 1e-06 \tabularnewline
23 & -0.251104 & -3.5512 & 0.000239 \tabularnewline
\hline
\end{tabular}
%Source: https://freestatistics.org/blog/index.php?pk=308625&T=1

[TABLE]
[ROW][C]Autocorrelation Function[/C][/ROW]
[ROW][C]Time lag k[/C][C]ACF(k)[/C][C]T-STAT[/C][C]P-value[/C][/ROW]
[ROW][C]1[/C][C]0.532492[/C][C]7.5306[/C][C]0[/C][/ROW]
[ROW][C]2[/C][C]0.573989[/C][C]8.1174[/C][C]0[/C][/ROW]
[ROW][C]3[/C][C]0.589881[/C][C]8.3422[/C][C]0[/C][/ROW]
[ROW][C]4[/C][C]0.396977[/C][C]5.6141[/C][C]0[/C][/ROW]
[ROW][C]5[/C][C]0.399558[/C][C]5.6506[/C][C]0[/C][/ROW]
[ROW][C]6[/C][C]0.349428[/C][C]4.9417[/C][C]1e-06[/C][/ROW]
[ROW][C]7[/C][C]0.221598[/C][C]3.1339[/C][C]0.000992[/C][/ROW]
[ROW][C]8[/C][C]0.176554[/C][C]2.4968[/C][C]0.006669[/C][/ROW]
[ROW][C]9[/C][C]0.077767[/C][C]1.0998[/C][C]0.136373[/C][/ROW]
[ROW][C]10[/C][C]0.002647[/C][C]0.0374[/C][C]0.485091[/C][/ROW]
[ROW][C]11[/C][C]-0.049083[/C][C]-0.6941[/C][C]0.244201[/C][/ROW]
[ROW][C]12[/C][C]-0.265136[/C][C]-3.7496[/C][C]0.000116[/C][/ROW]
[ROW][C]13[/C][C]-0.140859[/C][C]-1.9921[/C][C]0.023863[/C][/ROW]
[ROW][C]14[/C][C]-0.250551[/C][C]-3.5433[/C][C]0.000246[/C][/ROW]
[ROW][C]15[/C][C]-0.236038[/C][C]-3.3381[/C][C]0.000503[/C][/ROW]
[ROW][C]16[/C][C]-0.268297[/C][C]-3.7943[/C][C]9.8e-05[/C][/ROW]
[ROW][C]17[/C][C]-0.3235[/C][C]-4.575[/C][C]4e-06[/C][/ROW]
[ROW][C]18[/C][C]-0.306325[/C][C]-4.3321[/C][C]1.2e-05[/C][/ROW]
[ROW][C]19[/C][C]-0.321682[/C][C]-4.5493[/C][C]5e-06[/C][/ROW]
[ROW][C]20[/C][C]-0.318317[/C][C]-4.5017[/C][C]6e-06[/C][/ROW]
[ROW][C]21[/C][C]-0.285305[/C][C]-4.0348[/C][C]3.9e-05[/C][/ROW]
[ROW][C]22[/C][C]-0.34108[/C][C]-4.8236[/C][C]1e-06[/C][/ROW]
[ROW][C]23[/C][C]-0.251104[/C][C]-3.5512[/C][C]0.000239[/C][/ROW]
[/TABLE]
Source: https://freestatistics.org/blog/index.php?pk=308625&T=1

Globally Unique Identifier (entire table): ba.freestatistics.org/blog/index.php?pk=308625&T=1

As an alternative you can also use a QR Code:  

The GUIDs for individual cells are displayed in the table below:

Autocorrelation Function
Time lag kACF(k)T-STATP-value
10.5324927.53060
20.5739898.11740
30.5898818.34220
40.3969775.61410
50.3995585.65060
60.3494284.94171e-06
70.2215983.13390.000992
80.1765542.49680.006669
90.0777671.09980.136373
100.0026470.03740.485091
11-0.049083-0.69410.244201
12-0.265136-3.74960.000116
13-0.140859-1.99210.023863
14-0.250551-3.54330.000246
15-0.236038-3.33810.000503
16-0.268297-3.79439.8e-05
17-0.3235-4.5754e-06
18-0.306325-4.33211.2e-05
19-0.321682-4.54935e-06
20-0.318317-4.50176e-06
21-0.285305-4.03483.9e-05
22-0.34108-4.82361e-06
23-0.251104-3.55120.000239


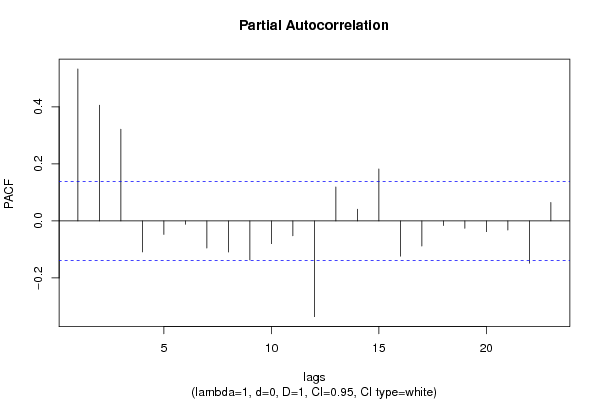
Partial Autocorrelation Function
Time lag kPACF(k)T-STATP-value
10.5324927.53060
20.4053895.73310
30.3211494.54175e-06
4-0.10863-1.53630.063028
5-0.047168-0.66710.252752
6-0.011874-0.16790.433409
7-0.095197-1.34630.089868
8-0.109233-1.54480.06199
9-0.136651-1.93250.027353
10-0.07963-1.12610.13073
11-0.05191-0.73410.231868
12-0.335506-4.74482e-06
130.119111.68450.046825
140.0409860.57960.281407
150.1821732.57630.005353
16-0.123455-1.74590.04118
17-0.087935-1.24360.107554
18-0.016024-0.22660.410479
19-0.025727-0.36380.358181
20-0.037562-0.53120.297933
21-0.032127-0.45430.325035
22-0.147878-2.09130.018881
230.0647840.91620.180335

\begin{tabular}{lllllllll}
\hline
Partial Autocorrelation Function \tabularnewline
Time lag k & PACF(k) & T-STAT & P-value \tabularnewline
1 & 0.532492 & 7.5306 & 0 \tabularnewline
2 & 0.405389 & 5.7331 & 0 \tabularnewline
3 & 0.321149 & 4.5417 & 5e-06 \tabularnewline
4 & -0.10863 & -1.5363 & 0.063028 \tabularnewline
5 & -0.047168 & -0.6671 & 0.252752 \tabularnewline
6 & -0.011874 & -0.1679 & 0.433409 \tabularnewline
7 & -0.095197 & -1.3463 & 0.089868 \tabularnewline
8 & -0.109233 & -1.5448 & 0.06199 \tabularnewline
9 & -0.136651 & -1.9325 & 0.027353 \tabularnewline
10 & -0.07963 & -1.1261 & 0.13073 \tabularnewline
11 & -0.05191 & -0.7341 & 0.231868 \tabularnewline
12 & -0.335506 & -4.7448 & 2e-06 \tabularnewline
13 & 0.11911 & 1.6845 & 0.046825 \tabularnewline
14 & 0.040986 & 0.5796 & 0.281407 \tabularnewline
15 & 0.182173 & 2.5763 & 0.005353 \tabularnewline
16 & -0.123455 & -1.7459 & 0.04118 \tabularnewline
17 & -0.087935 & -1.2436 & 0.107554 \tabularnewline
18 & -0.016024 & -0.2266 & 0.410479 \tabularnewline
19 & -0.025727 & -0.3638 & 0.358181 \tabularnewline
20 & -0.037562 & -0.5312 & 0.297933 \tabularnewline
21 & -0.032127 & -0.4543 & 0.325035 \tabularnewline
22 & -0.147878 & -2.0913 & 0.018881 \tabularnewline
23 & 0.064784 & 0.9162 & 0.180335 \tabularnewline
\hline
\end{tabular}
%Source: https://freestatistics.org/blog/index.php?pk=308625&T=2

[TABLE]
[ROW][C]Partial Autocorrelation Function[/C][/ROW]
[ROW][C]Time lag k[/C][C]PACF(k)[/C][C]T-STAT[/C][C]P-value[/C][/ROW]
[ROW][C]1[/C][C]0.532492[/C][C]7.5306[/C][C]0[/C][/ROW]
[ROW][C]2[/C][C]0.405389[/C][C]5.7331[/C][C]0[/C][/ROW]
[ROW][C]3[/C][C]0.321149[/C][C]4.5417[/C][C]5e-06[/C][/ROW]
[ROW][C]4[/C][C]-0.10863[/C][C]-1.5363[/C][C]0.063028[/C][/ROW]
[ROW][C]5[/C][C]-0.047168[/C][C]-0.6671[/C][C]0.252752[/C][/ROW]
[ROW][C]6[/C][C]-0.011874[/C][C]-0.1679[/C][C]0.433409[/C][/ROW]
[ROW][C]7[/C][C]-0.095197[/C][C]-1.3463[/C][C]0.089868[/C][/ROW]
[ROW][C]8[/C][C]-0.109233[/C][C]-1.5448[/C][C]0.06199[/C][/ROW]
[ROW][C]9[/C][C]-0.136651[/C][C]-1.9325[/C][C]0.027353[/C][/ROW]
[ROW][C]10[/C][C]-0.07963[/C][C]-1.1261[/C][C]0.13073[/C][/ROW]
[ROW][C]11[/C][C]-0.05191[/C][C]-0.7341[/C][C]0.231868[/C][/ROW]
[ROW][C]12[/C][C]-0.335506[/C][C]-4.7448[/C][C]2e-06[/C][/ROW]
[ROW][C]13[/C][C]0.11911[/C][C]1.6845[/C][C]0.046825[/C][/ROW]
[ROW][C]14[/C][C]0.040986[/C][C]0.5796[/C][C]0.281407[/C][/ROW]
[ROW][C]15[/C][C]0.182173[/C][C]2.5763[/C][C]0.005353[/C][/ROW]
[ROW][C]16[/C][C]-0.123455[/C][C]-1.7459[/C][C]0.04118[/C][/ROW]
[ROW][C]17[/C][C]-0.087935[/C][C]-1.2436[/C][C]0.107554[/C][/ROW]
[ROW][C]18[/C][C]-0.016024[/C][C]-0.2266[/C][C]0.410479[/C][/ROW]
[ROW][C]19[/C][C]-0.025727[/C][C]-0.3638[/C][C]0.358181[/C][/ROW]
[ROW][C]20[/C][C]-0.037562[/C][C]-0.5312[/C][C]0.297933[/C][/ROW]
[ROW][C]21[/C][C]-0.032127[/C][C]-0.4543[/C][C]0.325035[/C][/ROW]
[ROW][C]22[/C][C]-0.147878[/C][C]-2.0913[/C][C]0.018881[/C][/ROW]
[ROW][C]23[/C][C]0.064784[/C][C]0.9162[/C][C]0.180335[/C][/ROW]
[/TABLE]
Source: https://freestatistics.org/blog/index.php?pk=308625&T=2

Globally Unique Identifier (entire table): ba.freestatistics.org/blog/index.php?pk=308625&T=2

As an alternative you can also use a QR Code:  

The GUIDs for individual cells are displayed in the table below:

Partial Autocorrelation Function
Time lag kPACF(k)T-STATP-value
10.5324927.53060
20.4053895.73310
30.3211494.54175e-06
4-0.10863-1.53630.063028
5-0.047168-0.66710.252752
6-0.011874-0.16790.433409
7-0.095197-1.34630.089868
8-0.109233-1.54480.06199
9-0.136651-1.93250.027353
10-0.07963-1.12610.13073
11-0.05191-0.73410.231868
12-0.335506-4.74482e-06
130.119111.68450.046825
140.0409860.57960.281407
150.1821732.57630.005353
16-0.123455-1.74590.04118
17-0.087935-1.24360.107554
18-0.016024-0.22660.410479
19-0.025727-0.36380.358181
20-0.037562-0.53120.297933
21-0.032127-0.45430.325035
22-0.147878-2.09130.018881
230.0647840.91620.180335


Parameters (Session):
par1 = Default ; par2 = 1 ; par3 = 0 ; par4 = 1 ; par5 = 12 ; par6 = White Noise ; par7 = 0.95 ;
Parameters (R input):
par1 = Default ; par2 = 1 ; par3 = 0 ; par4 = 1 ; par5 = 12 ; par6 = White Noise ; par7 = 0.95 ; par8 = ;
R code (references can be found in the software module):
if (par1 == 'Default') {
par1 = 10*log10(length(x))
} else {
par1 <- as.numeric(par1)
}
par2 <- as.numeric(par2)
par3 <- as.numeric(par3)
par4 <- as.numeric(par4)
par5 <- as.numeric(par5)
if (par6 == 'White Noise') par6 <- 'white' else par6 <- 'ma'
par7 <- as.numeric(par7)
if (par8 != '') par8 <- as.numeric(par8)
x <- na.omit(x)
ox <- x
if (par8 == '') {
if (par2 == 0) {
x <- log(x)
} else {
x <- (x ^ par2 - 1) / par2
}
} else {
x <- log(x,base=par8)
}
if (par3 > 0) x <- diff(x,lag=1,difference=par3)
if (par4 > 0) x <- diff(x,lag=par5,difference=par4)
bitmap(file='picts.png')
op <- par(mfrow=c(2,1))
plot(ox,type='l',main='Original Time Series',xlab='time',ylab='value')
if (par8=='') {
mytitle <- paste('Working Time Series (lambda=',par2,', d=',par3,', D=',par4,')',sep='')
mysub <- paste('(lambda=',par2,', d=',par3,', D=',par4,', CI=', par7, ', CI type=',par6,')',sep='')
} else {
mytitle <- paste('Working Time Series (base=',par8,', d=',par3,', D=',par4,')',sep='')
mysub <- paste('(base=',par8,', d=',par3,', D=',par4,', CI=', par7, ', CI type=',par6,')',sep='')
}
plot(x,type='l', main=mytitle,xlab='time',ylab='value')
par(op)
dev.off()
bitmap(file='pic1.png')
racf <- acf(x, par1, main='Autocorrelation', xlab='time lag', ylab='ACF', ci.type=par6, ci=par7, sub=mysub)
dev.off()
bitmap(file='pic2.png')
rpacf <- pacf(x,par1,main='Partial Autocorrelation',xlab='lags',ylab='PACF',sub=mysub)
dev.off()
(myacf <- c(racf$acf))
(mypacf <- c(rpacf$acf))
lengthx <- length(x)
sqrtn <- sqrt(lengthx)
load(file='createtable')
a<-table.start()
a<-table.row.start(a)
a<-table.element(a,'Autocorrelation Function',4,TRUE)
a<-table.row.end(a)
a<-table.row.start(a)
a<-table.element(a,'Time lag k',header=TRUE)
a<-table.element(a,'ACF(k)',header=TRUE)
a<-table.element(a,'T-STAT',header=TRUE)
a<-table.element(a,'P-value',header=TRUE)
a<-table.row.end(a)
for (i in 2:(par1+1)) {
a<-table.row.start(a)
a<-table.element(a,i-1,header=TRUE)
a<-table.element(a,round(myacf[i],6))
mytstat <- myacf[i]*sqrtn
a<-table.element(a,round(mytstat,4))
a<-table.element(a,round(1-pt(abs(mytstat),lengthx),6))
a<-table.row.end(a)
}
a<-table.end(a)
table.save(a,file='mytable.tab')
a<-table.start()
a<-table.row.start(a)
a<-table.element(a,'Partial Autocorrelation Function',4,TRUE)
a<-table.row.end(a)
a<-table.row.start(a)
a<-table.element(a,'Time lag k',header=TRUE)
a<-table.element(a,'PACF(k)',header=TRUE)
a<-table.element(a,'T-STAT',header=TRUE)
a<-table.element(a,'P-value',header=TRUE)
a<-table.row.end(a)
for (i in 1:par1) {
a<-table.row.start(a)
a<-table.element(a,i,header=TRUE)
a<-table.element(a,round(mypacf[i],6))
mytstat <- mypacf[i]*sqrtn
a<-table.element(a,round(mytstat,4))
a<-table.element(a,round(1-pt(abs(mytstat),lengthx),6))
a<-table.row.end(a)
}
a<-table.end(a)
table.save(a,file='mytable1.tab')