Free Statistics

of Irreproducible Research!

Author's title

Author*The author of this computation has been verified*
R Software Modulerwasp_multipleregression.wasp
Title produced by softwareMultiple Regression
Date of computationWed, 06 Dec 2017 14:37:37 +0100
Cite this page as followsStatistical Computations at FreeStatistics.org, Office for Research Development and Education, URL https://freestatistics.org/blog/index.php?v=date/2017/Dec/06/t1512567491duow0sm8sphrnns.htm/, Retrieved Tue, 14 May 2024 19:17:07 +0000
Statistical Computations at FreeStatistics.org, Office for Research Development and Education, URL https://freestatistics.org/blog/index.php?pk=308613, Retrieved Tue, 14 May 2024 19:17:07 +0000
QR Codes:

Original text written by user:
IsPrivate?No (this computation is public)
User-defined keywords
Estimated Impact115
Family? (F = Feedback message, R = changed R code, M = changed R Module, P = changed Parameters, D = changed Data)
-       [Multiple Regression] [Dataset 2: saldo'...] [2017-12-06 13:37:37] [4bbd12ea3a6c2ab532848261ff0d9984] [Current]
Feedback Forum

Post a new message
Dataseries X:
-49	-47	57	-39
2 874	-2 613	3 376	3 637
-34	99	1	66
37	-29	45	53
45	-32	29	42
-110	191	44	125
46	151	60	257
24	162	67	253
38	25	115	178
9	74	4	87
-43	39	14	10
10	87	58	155
-100	-229	331	2
38	35	5	78
24	-160	96	-40
20	-25	48	43
32	45	23	100
-26	-37	174	111
-42	-29	14	-57
-15	112	1	98
-64	117	32	85
-21	265	-31	213
64	-94	13	-17
-22	294	22	294
5	153	37	195
97	45	93	235
-19	66	28	75
-93	206	-20	93
36	-81	78	33
-45	86	54	95
-18	165	35	182
-70	179	15	124
-44	76	60	92
-36	-7	54	11
-22	251	85	314
-19	283	108	372
482	299	369	1 150
-22	41	28	47
-58	162	50	154
2	144	40	186
-31	101	17	87
28	-7	51	72
56	185	103	344
21	-114	208	115
17	-13	28	32
43	122	29	194
49	8	21	78
4	69	34	107
-6	193	146	333
-1	13	26	38
-67	70	69	72
-9	9	39	39
-53	-5	-23	-81
73	-124	170	119
7	46	20	73
4	111	56	171
9	-20	16	5
-12	78	28	94
17	-79	43	-19
-8	-8	143	127
64	63	12	139
-8	85	63	140
69	-137	140	72
31	-82	141	90
43	-32	44	55
116	-212	591	495
24	-32	9	1
41	24	5	70
-9	-24	20	-13
-35	46	10	21


Summary of computational transaction
Raw Input view raw input (R code)
Raw Outputview raw output of R engine
Computing time10 seconds
R ServerBig Analytics Cloud Computing Center

\begin{tabular}{lllllllll}
\hline
Summary of computational transaction \tabularnewline
Raw Input view raw input (R code)  \tabularnewline
Raw Outputview raw output of R engine  \tabularnewline
Computing time10 seconds \tabularnewline
R ServerBig Analytics Cloud Computing Center \tabularnewline
\hline
\end{tabular}
%Source: https://freestatistics.org/blog/index.php?pk=308613&T=0

[TABLE]
[ROW]
Summary of computational transaction[/C][/ROW] [ROW]Raw Input[/C] view raw input (R code) [/C][/ROW] [ROW]Raw Output[/C]view raw output of R engine [/C][/ROW] [ROW]Computing time[/C]10 seconds[/C][/ROW] [ROW]R Server[/C]Big Analytics Cloud Computing Center[/C][/ROW] [/TABLE] Source: https://freestatistics.org/blog/index.php?pk=308613&T=0

Globally Unique Identifier (entire table): ba.freestatistics.org/blog/index.php?pk=308613&T=0

As an alternative you can also use a QR Code:  

The GUIDs for individual cells are displayed in the table below:

Summary of computational transaction
Raw Input view raw input (R code)
Raw Outputview raw output of R engine
Computing time10 seconds
R ServerBig Analytics Cloud Computing Center


Multiple Linear Regression - Estimated Regression Equation
4[t] = + 81.3384 -0.125542`1`[t] + 0.67628`2`[t] -0.238009`3`[t] + e[t]

\begin{tabular}{lllllllll}
\hline
Multiple Linear Regression - Estimated Regression Equation \tabularnewline
4[t] =  +  81.3384 -0.125542`1`[t] +  0.67628`2`[t] -0.238009`3`[t]  + e[t] \tabularnewline
 \tabularnewline
\hline
\end{tabular}
%Source: https://freestatistics.org/blog/index.php?pk=308613&T=1

[TABLE]
[ROW][C]Multiple Linear Regression - Estimated Regression Equation[/C][/ROW]
[ROW][C]4[t] =  +  81.3384 -0.125542`1`[t] +  0.67628`2`[t] -0.238009`3`[t]  + e[t][/C][/ROW]
[ROW][C][/C][/ROW]
[/TABLE]
Source: https://freestatistics.org/blog/index.php?pk=308613&T=1

Globally Unique Identifier (entire table): ba.freestatistics.org/blog/index.php?pk=308613&T=1

As an alternative you can also use a QR Code:  

The GUIDs for individual cells are displayed in the table below:

Multiple Linear Regression - Estimated Regression Equation
4[t] = + 81.3384 -0.125542`1`[t] + 0.67628`2`[t] -0.238009`3`[t] + e[t]


Multiple Linear Regression - Ordinary Least Squares
VariableParameterS.D.T-STATH0: parameter = 02-tail p-value1-tail p-value
(Intercept)+81.34 14.38+5.6540e+00 3.632e-07 1.816e-07
`1`-0.1255 0.09751-1.2880e+00 0.2024 0.1012
`2`+0.6763 0.07741+8.7360e+00 1.283e-12 6.416e-13
`3`-0.238 0.1255-1.8970e+00 0.06226 0.03113

\begin{tabular}{lllllllll}
\hline
Multiple Linear Regression - Ordinary Least Squares \tabularnewline
Variable & Parameter & S.D. & T-STATH0: parameter = 0 & 2-tail p-value & 1-tail p-value \tabularnewline
(Intercept) & +81.34 &  14.38 & +5.6540e+00 &  3.632e-07 &  1.816e-07 \tabularnewline
`1` & -0.1255 &  0.09751 & -1.2880e+00 &  0.2024 &  0.1012 \tabularnewline
`2` & +0.6763 &  0.07741 & +8.7360e+00 &  1.283e-12 &  6.416e-13 \tabularnewline
`3` & -0.238 &  0.1255 & -1.8970e+00 &  0.06226 &  0.03113 \tabularnewline
\hline
\end{tabular}
%Source: https://freestatistics.org/blog/index.php?pk=308613&T=2

[TABLE]
[ROW][C]Multiple Linear Regression - Ordinary Least Squares[/C][/ROW]
[ROW][C]Variable[/C][C]Parameter[/C][C]S.D.[/C][C]T-STATH0: parameter = 0[/C][C]2-tail p-value[/C][C]1-tail p-value[/C][/ROW]
[ROW][C](Intercept)[/C][C]+81.34[/C][C] 14.38[/C][C]+5.6540e+00[/C][C] 3.632e-07[/C][C] 1.816e-07[/C][/ROW]
[ROW][C]`1`[/C][C]-0.1255[/C][C] 0.09751[/C][C]-1.2880e+00[/C][C] 0.2024[/C][C] 0.1012[/C][/ROW]
[ROW][C]`2`[/C][C]+0.6763[/C][C] 0.07741[/C][C]+8.7360e+00[/C][C] 1.283e-12[/C][C] 6.416e-13[/C][/ROW]
[ROW][C]`3`[/C][C]-0.238[/C][C] 0.1255[/C][C]-1.8970e+00[/C][C] 0.06226[/C][C] 0.03113[/C][/ROW]
[/TABLE]
Source: https://freestatistics.org/blog/index.php?pk=308613&T=2

Globally Unique Identifier (entire table): ba.freestatistics.org/blog/index.php?pk=308613&T=2

As an alternative you can also use a QR Code:  

The GUIDs for individual cells are displayed in the table below:

Multiple Linear Regression - Ordinary Least Squares
VariableParameterS.D.T-STATH0: parameter = 02-tail p-value1-tail p-value
(Intercept)+81.34 14.38+5.6540e+00 3.632e-07 1.816e-07
`1`-0.1255 0.09751-1.2880e+00 0.2024 0.1012
`2`+0.6763 0.07741+8.7360e+00 1.283e-12 6.416e-13
`3`-0.238 0.1255-1.8970e+00 0.06226 0.03113


Multiple Linear Regression - Regression Statistics
Multiple R 0.7601
R-squared 0.5778
Adjusted R-squared 0.5586
F-TEST (value) 30.1
F-TEST (DF numerator)3
F-TEST (DF denominator)66
p-value 2.213e-12
Multiple Linear Regression - Residual Statistics
Residual Standard Deviation 92.25
Sum Squared Residuals 5.617e+05

\begin{tabular}{lllllllll}
\hline
Multiple Linear Regression - Regression Statistics \tabularnewline
Multiple R &  0.7601 \tabularnewline
R-squared &  0.5778 \tabularnewline
Adjusted R-squared &  0.5586 \tabularnewline
F-TEST (value) &  30.1 \tabularnewline
F-TEST (DF numerator) & 3 \tabularnewline
F-TEST (DF denominator) & 66 \tabularnewline
p-value &  2.213e-12 \tabularnewline
Multiple Linear Regression - Residual Statistics \tabularnewline
Residual Standard Deviation &  92.25 \tabularnewline
Sum Squared Residuals &  5.617e+05 \tabularnewline
\hline
\end{tabular}
%Source: https://freestatistics.org/blog/index.php?pk=308613&T=3

[TABLE]
[ROW][C]Multiple Linear Regression - Regression Statistics[/C][/ROW]
[ROW][C]Multiple R[/C][C] 0.7601[/C][/ROW]
[ROW][C]R-squared[/C][C] 0.5778[/C][/ROW]
[ROW][C]Adjusted R-squared[/C][C] 0.5586[/C][/ROW]
[ROW][C]F-TEST (value)[/C][C] 30.1[/C][/ROW]
[ROW][C]F-TEST (DF numerator)[/C][C]3[/C][/ROW]
[ROW][C]F-TEST (DF denominator)[/C][C]66[/C][/ROW]
[ROW][C]p-value[/C][C] 2.213e-12[/C][/ROW]
[ROW][C]Multiple Linear Regression - Residual Statistics[/C][/ROW]
[ROW][C]Residual Standard Deviation[/C][C] 92.25[/C][/ROW]
[ROW][C]Sum Squared Residuals[/C][C] 5.617e+05[/C][/ROW]
[/TABLE]
Source: https://freestatistics.org/blog/index.php?pk=308613&T=3

Globally Unique Identifier (entire table): ba.freestatistics.org/blog/index.php?pk=308613&T=3

As an alternative you can also use a QR Code:  

The GUIDs for individual cells are displayed in the table below:

Multiple Linear Regression - Regression Statistics
Multiple R 0.7601
R-squared 0.5778
Adjusted R-squared 0.5586
F-TEST (value) 30.1
F-TEST (DF numerator)3
F-TEST (DF denominator)66
p-value 2.213e-12
Multiple Linear Regression - Residual Statistics
Residual Standard Deviation 92.25
Sum Squared Residuals 5.617e+05


Menu of Residual Diagnostics
DescriptionLink
HistogramCompute
Central TendencyCompute
QQ PlotCompute
Kernel Density PlotCompute
Skewness/Kurtosis TestCompute
Skewness-Kurtosis PlotCompute
Harrell-Davis PlotCompute
Bootstrap Plot -- Central TendencyCompute
Blocked Bootstrap Plot -- Central TendencyCompute
(Partial) Autocorrelation PlotCompute
Spectral AnalysisCompute
Tukey lambda PPCC PlotCompute
Box-Cox Normality PlotCompute
Summary StatisticsCompute

\begin{tabular}{lllllllll}
\hline
Menu of Residual Diagnostics \tabularnewline
Description & Link \tabularnewline
Histogram & Compute \tabularnewline
Central Tendency & Compute \tabularnewline
QQ Plot & Compute \tabularnewline
Kernel Density Plot & Compute \tabularnewline
Skewness/Kurtosis Test & Compute \tabularnewline
Skewness-Kurtosis Plot & Compute \tabularnewline
Harrell-Davis Plot & Compute \tabularnewline
Bootstrap Plot -- Central Tendency & Compute \tabularnewline
Blocked Bootstrap Plot -- Central Tendency & Compute \tabularnewline
(Partial) Autocorrelation Plot & Compute \tabularnewline
Spectral Analysis & Compute \tabularnewline
Tukey lambda PPCC Plot & Compute \tabularnewline
Box-Cox Normality Plot & Compute \tabularnewline
Summary Statistics & Compute \tabularnewline
\hline
\end{tabular}
%Source: https://freestatistics.org/blog/index.php?pk=308613&T=4

[TABLE]
[ROW][C]Menu of Residual Diagnostics[/C][/ROW]
[ROW][C]Description[/C][C]Link[/C][/ROW]
[ROW][C]Histogram[/C][C]Compute[/C][/ROW]
[ROW][C]Central Tendency[/C][C]Compute[/C][/ROW]
[ROW][C]QQ Plot[/C][C]Compute[/C][/ROW]
[ROW][C]Kernel Density Plot[/C][C]Compute[/C][/ROW]
[ROW][C]Skewness/Kurtosis Test[/C][C]Compute[/C][/ROW]
[ROW][C]Skewness-Kurtosis Plot[/C][C]Compute[/C][/ROW]
[ROW][C]Harrell-Davis Plot[/C][C]Compute[/C][/ROW]
[ROW][C]Bootstrap Plot -- Central Tendency[/C][C]Compute[/C][/ROW]
[ROW][C]Blocked Bootstrap Plot -- Central Tendency[/C][C]Compute[/C][/ROW]
[ROW][C](Partial) Autocorrelation Plot[/C][C]Compute[/C][/ROW]
[ROW][C]Spectral Analysis[/C][C]Compute[/C][/ROW]
[ROW][C]Tukey lambda PPCC Plot[/C][C]Compute[/C][/ROW]
[ROW][C]Box-Cox Normality Plot[/C][C]Compute[/C][/ROW]
[ROW][C]Summary Statistics[/C][C]Compute[/C][/ROW]
[/TABLE]
Source: https://freestatistics.org/blog/index.php?pk=308613&T=4

Globally Unique Identifier (entire table): ba.freestatistics.org/blog/index.php?pk=308613&T=4

As an alternative you can also use a QR Code:  

The GUIDs for individual cells are displayed in the table below:

Menu of Residual Diagnostics
DescriptionLink
HistogramCompute
Central TendencyCompute
QQ PlotCompute
Kernel Density PlotCompute
Skewness/Kurtosis TestCompute
Skewness-Kurtosis PlotCompute
Harrell-Davis PlotCompute
Bootstrap Plot -- Central TendencyCompute
Blocked Bootstrap Plot -- Central TendencyCompute
(Partial) Autocorrelation PlotCompute
Spectral AnalysisCompute
Tukey lambda PPCC PlotCompute
Box-Cox Normality PlotCompute
Summary StatisticsCompute


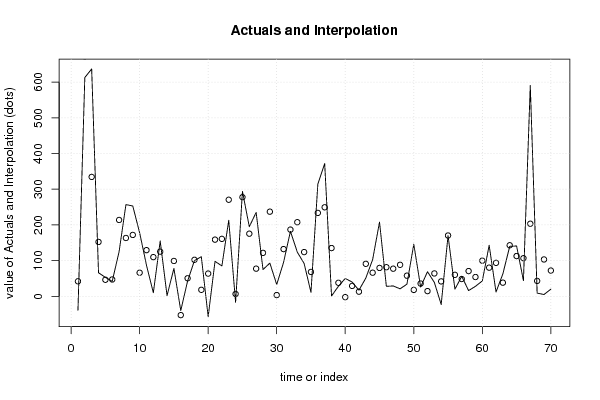
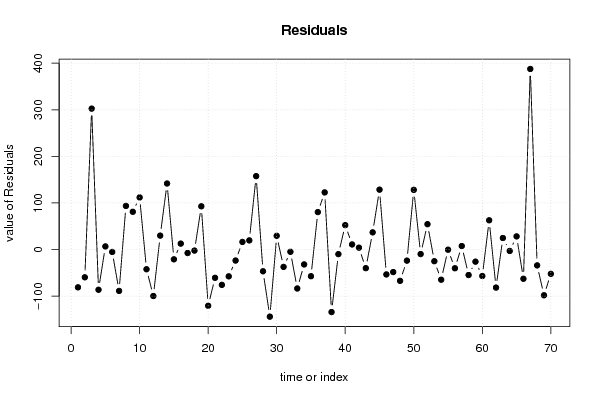
Multiple Linear Regression - Actuals, Interpolation, and Residuals
Time or IndexActualsInterpolationForecastResidualsPrediction Error
1-39 42.14-81.14
2 613 672.6-59.63
3 637 334.5 302.5
4 66 152.3-86.32
5 53 46.37 6.629
6 42 47.15-5.146
7 125 213.8-88.85
8 257 163.4 93.6
9 253 171.9 81.06
10 178 66.1 111.9
11 87 129.3-42.3
12 10 109.8-99.78
13 155 125.1 29.89
14 2-139.8 141.8
15 78 99.05-21.05
16-40-52.73 12.73
17 43 50.5-7.496
18 100 102.3-2.279
19 111 18.17 92.83
20-57 63.67-120.7
21 98 158.7-60.73
22 85 160.9-75.88
23 213 270.6-57.57
24-17 6.639-23.64
25 294 277.7 16.31
26 195 175.4 19.62
27 235 77.46 157.5
28 75 121.7-46.69
29 93 237.1-144.1
30 33 3.475 29.52
31 95 132.3-37.3
32 182 186.9-4.854
33 124 207.6-83.61
34 92 124-31.98
35 11 68.27-57.27
36 314 233.6 80.38
37 372 249.4 122.6
38 1 135.2-134.2
39 28 37.87-9.871
40 50-2.344 52.34
41 40 29.08 10.92
42 17 12.98 4.016
43 51 91.02-40.02
44 103 66.14 36.86
45 208 79.49 128.5
46 28 81.49-53.49
47 29 77.36-48.36
48 21 88.22-67.22
49 34 57.83-23.83
50 146 17.91 128.1
51 26 35.76-9.762
52 69 14.6 54.4
53 39 64.07-25.07
54-23 41.79-64.79
55 170 170.4-0.3888
56 20 60.18-40.18
57 56 48.46 7.54
58 16 70.72-54.72
59 28 54.03-26.03
60 43 99.84-56.84
61 143 80.22 62.78
62 12 93.68-81.68
63 63 38.25 24.75
64 140 143-3.033
65 141 112.8 28.22
66 44 106.7-62.74
67 591 203.3 387.7
68 9 43.04-34.04
69 5 103.2-98.23
70 20 72.18-52.18

\begin{tabular}{lllllllll}
\hline
Multiple Linear Regression - Actuals, Interpolation, and Residuals \tabularnewline
Time or Index & Actuals & InterpolationForecast & ResidualsPrediction Error \tabularnewline
1 & -39 &  42.14 & -81.14 \tabularnewline
2 &  613 &  672.6 & -59.63 \tabularnewline
3 &  637 &  334.5 &  302.5 \tabularnewline
4 &  66 &  152.3 & -86.32 \tabularnewline
5 &  53 &  46.37 &  6.629 \tabularnewline
6 &  42 &  47.15 & -5.146 \tabularnewline
7 &  125 &  213.8 & -88.85 \tabularnewline
8 &  257 &  163.4 &  93.6 \tabularnewline
9 &  253 &  171.9 &  81.06 \tabularnewline
10 &  178 &  66.1 &  111.9 \tabularnewline
11 &  87 &  129.3 & -42.3 \tabularnewline
12 &  10 &  109.8 & -99.78 \tabularnewline
13 &  155 &  125.1 &  29.89 \tabularnewline
14 &  2 & -139.8 &  141.8 \tabularnewline
15 &  78 &  99.05 & -21.05 \tabularnewline
16 & -40 & -52.73 &  12.73 \tabularnewline
17 &  43 &  50.5 & -7.496 \tabularnewline
18 &  100 &  102.3 & -2.279 \tabularnewline
19 &  111 &  18.17 &  92.83 \tabularnewline
20 & -57 &  63.67 & -120.7 \tabularnewline
21 &  98 &  158.7 & -60.73 \tabularnewline
22 &  85 &  160.9 & -75.88 \tabularnewline
23 &  213 &  270.6 & -57.57 \tabularnewline
24 & -17 &  6.639 & -23.64 \tabularnewline
25 &  294 &  277.7 &  16.31 \tabularnewline
26 &  195 &  175.4 &  19.62 \tabularnewline
27 &  235 &  77.46 &  157.5 \tabularnewline
28 &  75 &  121.7 & -46.69 \tabularnewline
29 &  93 &  237.1 & -144.1 \tabularnewline
30 &  33 &  3.475 &  29.52 \tabularnewline
31 &  95 &  132.3 & -37.3 \tabularnewline
32 &  182 &  186.9 & -4.854 \tabularnewline
33 &  124 &  207.6 & -83.61 \tabularnewline
34 &  92 &  124 & -31.98 \tabularnewline
35 &  11 &  68.27 & -57.27 \tabularnewline
36 &  314 &  233.6 &  80.38 \tabularnewline
37 &  372 &  249.4 &  122.6 \tabularnewline
38 &  1 &  135.2 & -134.2 \tabularnewline
39 &  28 &  37.87 & -9.871 \tabularnewline
40 &  50 & -2.344 &  52.34 \tabularnewline
41 &  40 &  29.08 &  10.92 \tabularnewline
42 &  17 &  12.98 &  4.016 \tabularnewline
43 &  51 &  91.02 & -40.02 \tabularnewline
44 &  103 &  66.14 &  36.86 \tabularnewline
45 &  208 &  79.49 &  128.5 \tabularnewline
46 &  28 &  81.49 & -53.49 \tabularnewline
47 &  29 &  77.36 & -48.36 \tabularnewline
48 &  21 &  88.22 & -67.22 \tabularnewline
49 &  34 &  57.83 & -23.83 \tabularnewline
50 &  146 &  17.91 &  128.1 \tabularnewline
51 &  26 &  35.76 & -9.762 \tabularnewline
52 &  69 &  14.6 &  54.4 \tabularnewline
53 &  39 &  64.07 & -25.07 \tabularnewline
54 & -23 &  41.79 & -64.79 \tabularnewline
55 &  170 &  170.4 & -0.3888 \tabularnewline
56 &  20 &  60.18 & -40.18 \tabularnewline
57 &  56 &  48.46 &  7.54 \tabularnewline
58 &  16 &  70.72 & -54.72 \tabularnewline
59 &  28 &  54.03 & -26.03 \tabularnewline
60 &  43 &  99.84 & -56.84 \tabularnewline
61 &  143 &  80.22 &  62.78 \tabularnewline
62 &  12 &  93.68 & -81.68 \tabularnewline
63 &  63 &  38.25 &  24.75 \tabularnewline
64 &  140 &  143 & -3.033 \tabularnewline
65 &  141 &  112.8 &  28.22 \tabularnewline
66 &  44 &  106.7 & -62.74 \tabularnewline
67 &  591 &  203.3 &  387.7 \tabularnewline
68 &  9 &  43.04 & -34.04 \tabularnewline
69 &  5 &  103.2 & -98.23 \tabularnewline
70 &  20 &  72.18 & -52.18 \tabularnewline
\hline
\end{tabular}
%Source: https://freestatistics.org/blog/index.php?pk=308613&T=5

[TABLE]
[ROW][C]Multiple Linear Regression - Actuals, Interpolation, and Residuals[/C][/ROW]
[ROW][C]Time or Index[/C][C]Actuals[/C][C]InterpolationForecast[/C][C]ResidualsPrediction Error[/C][/ROW]
[ROW][C]1[/C][C]-39[/C][C] 42.14[/C][C]-81.14[/C][/ROW]
[ROW][C]2[/C][C] 613[/C][C] 672.6[/C][C]-59.63[/C][/ROW]
[ROW][C]3[/C][C] 637[/C][C] 334.5[/C][C] 302.5[/C][/ROW]
[ROW][C]4[/C][C] 66[/C][C] 152.3[/C][C]-86.32[/C][/ROW]
[ROW][C]5[/C][C] 53[/C][C] 46.37[/C][C] 6.629[/C][/ROW]
[ROW][C]6[/C][C] 42[/C][C] 47.15[/C][C]-5.146[/C][/ROW]
[ROW][C]7[/C][C] 125[/C][C] 213.8[/C][C]-88.85[/C][/ROW]
[ROW][C]8[/C][C] 257[/C][C] 163.4[/C][C] 93.6[/C][/ROW]
[ROW][C]9[/C][C] 253[/C][C] 171.9[/C][C] 81.06[/C][/ROW]
[ROW][C]10[/C][C] 178[/C][C] 66.1[/C][C] 111.9[/C][/ROW]
[ROW][C]11[/C][C] 87[/C][C] 129.3[/C][C]-42.3[/C][/ROW]
[ROW][C]12[/C][C] 10[/C][C] 109.8[/C][C]-99.78[/C][/ROW]
[ROW][C]13[/C][C] 155[/C][C] 125.1[/C][C] 29.89[/C][/ROW]
[ROW][C]14[/C][C] 2[/C][C]-139.8[/C][C] 141.8[/C][/ROW]
[ROW][C]15[/C][C] 78[/C][C] 99.05[/C][C]-21.05[/C][/ROW]
[ROW][C]16[/C][C]-40[/C][C]-52.73[/C][C] 12.73[/C][/ROW]
[ROW][C]17[/C][C] 43[/C][C] 50.5[/C][C]-7.496[/C][/ROW]
[ROW][C]18[/C][C] 100[/C][C] 102.3[/C][C]-2.279[/C][/ROW]
[ROW][C]19[/C][C] 111[/C][C] 18.17[/C][C] 92.83[/C][/ROW]
[ROW][C]20[/C][C]-57[/C][C] 63.67[/C][C]-120.7[/C][/ROW]
[ROW][C]21[/C][C] 98[/C][C] 158.7[/C][C]-60.73[/C][/ROW]
[ROW][C]22[/C][C] 85[/C][C] 160.9[/C][C]-75.88[/C][/ROW]
[ROW][C]23[/C][C] 213[/C][C] 270.6[/C][C]-57.57[/C][/ROW]
[ROW][C]24[/C][C]-17[/C][C] 6.639[/C][C]-23.64[/C][/ROW]
[ROW][C]25[/C][C] 294[/C][C] 277.7[/C][C] 16.31[/C][/ROW]
[ROW][C]26[/C][C] 195[/C][C] 175.4[/C][C] 19.62[/C][/ROW]
[ROW][C]27[/C][C] 235[/C][C] 77.46[/C][C] 157.5[/C][/ROW]
[ROW][C]28[/C][C] 75[/C][C] 121.7[/C][C]-46.69[/C][/ROW]
[ROW][C]29[/C][C] 93[/C][C] 237.1[/C][C]-144.1[/C][/ROW]
[ROW][C]30[/C][C] 33[/C][C] 3.475[/C][C] 29.52[/C][/ROW]
[ROW][C]31[/C][C] 95[/C][C] 132.3[/C][C]-37.3[/C][/ROW]
[ROW][C]32[/C][C] 182[/C][C] 186.9[/C][C]-4.854[/C][/ROW]
[ROW][C]33[/C][C] 124[/C][C] 207.6[/C][C]-83.61[/C][/ROW]
[ROW][C]34[/C][C] 92[/C][C] 124[/C][C]-31.98[/C][/ROW]
[ROW][C]35[/C][C] 11[/C][C] 68.27[/C][C]-57.27[/C][/ROW]
[ROW][C]36[/C][C] 314[/C][C] 233.6[/C][C] 80.38[/C][/ROW]
[ROW][C]37[/C][C] 372[/C][C] 249.4[/C][C] 122.6[/C][/ROW]
[ROW][C]38[/C][C] 1[/C][C] 135.2[/C][C]-134.2[/C][/ROW]
[ROW][C]39[/C][C] 28[/C][C] 37.87[/C][C]-9.871[/C][/ROW]
[ROW][C]40[/C][C] 50[/C][C]-2.344[/C][C] 52.34[/C][/ROW]
[ROW][C]41[/C][C] 40[/C][C] 29.08[/C][C] 10.92[/C][/ROW]
[ROW][C]42[/C][C] 17[/C][C] 12.98[/C][C] 4.016[/C][/ROW]
[ROW][C]43[/C][C] 51[/C][C] 91.02[/C][C]-40.02[/C][/ROW]
[ROW][C]44[/C][C] 103[/C][C] 66.14[/C][C] 36.86[/C][/ROW]
[ROW][C]45[/C][C] 208[/C][C] 79.49[/C][C] 128.5[/C][/ROW]
[ROW][C]46[/C][C] 28[/C][C] 81.49[/C][C]-53.49[/C][/ROW]
[ROW][C]47[/C][C] 29[/C][C] 77.36[/C][C]-48.36[/C][/ROW]
[ROW][C]48[/C][C] 21[/C][C] 88.22[/C][C]-67.22[/C][/ROW]
[ROW][C]49[/C][C] 34[/C][C] 57.83[/C][C]-23.83[/C][/ROW]
[ROW][C]50[/C][C] 146[/C][C] 17.91[/C][C] 128.1[/C][/ROW]
[ROW][C]51[/C][C] 26[/C][C] 35.76[/C][C]-9.762[/C][/ROW]
[ROW][C]52[/C][C] 69[/C][C] 14.6[/C][C] 54.4[/C][/ROW]
[ROW][C]53[/C][C] 39[/C][C] 64.07[/C][C]-25.07[/C][/ROW]
[ROW][C]54[/C][C]-23[/C][C] 41.79[/C][C]-64.79[/C][/ROW]
[ROW][C]55[/C][C] 170[/C][C] 170.4[/C][C]-0.3888[/C][/ROW]
[ROW][C]56[/C][C] 20[/C][C] 60.18[/C][C]-40.18[/C][/ROW]
[ROW][C]57[/C][C] 56[/C][C] 48.46[/C][C] 7.54[/C][/ROW]
[ROW][C]58[/C][C] 16[/C][C] 70.72[/C][C]-54.72[/C][/ROW]
[ROW][C]59[/C][C] 28[/C][C] 54.03[/C][C]-26.03[/C][/ROW]
[ROW][C]60[/C][C] 43[/C][C] 99.84[/C][C]-56.84[/C][/ROW]
[ROW][C]61[/C][C] 143[/C][C] 80.22[/C][C] 62.78[/C][/ROW]
[ROW][C]62[/C][C] 12[/C][C] 93.68[/C][C]-81.68[/C][/ROW]
[ROW][C]63[/C][C] 63[/C][C] 38.25[/C][C] 24.75[/C][/ROW]
[ROW][C]64[/C][C] 140[/C][C] 143[/C][C]-3.033[/C][/ROW]
[ROW][C]65[/C][C] 141[/C][C] 112.8[/C][C] 28.22[/C][/ROW]
[ROW][C]66[/C][C] 44[/C][C] 106.7[/C][C]-62.74[/C][/ROW]
[ROW][C]67[/C][C] 591[/C][C] 203.3[/C][C] 387.7[/C][/ROW]
[ROW][C]68[/C][C] 9[/C][C] 43.04[/C][C]-34.04[/C][/ROW]
[ROW][C]69[/C][C] 5[/C][C] 103.2[/C][C]-98.23[/C][/ROW]
[ROW][C]70[/C][C] 20[/C][C] 72.18[/C][C]-52.18[/C][/ROW]
[/TABLE]
Source: https://freestatistics.org/blog/index.php?pk=308613&T=5

Globally Unique Identifier (entire table): ba.freestatistics.org/blog/index.php?pk=308613&T=5

As an alternative you can also use a QR Code:  

The GUIDs for individual cells are displayed in the table below:

Multiple Linear Regression - Actuals, Interpolation, and Residuals
Time or IndexActualsInterpolationForecastResidualsPrediction Error
1-39 42.14-81.14
2 613 672.6-59.63
3 637 334.5 302.5
4 66 152.3-86.32
5 53 46.37 6.629
6 42 47.15-5.146
7 125 213.8-88.85
8 257 163.4 93.6
9 253 171.9 81.06
10 178 66.1 111.9
11 87 129.3-42.3
12 10 109.8-99.78
13 155 125.1 29.89
14 2-139.8 141.8
15 78 99.05-21.05
16-40-52.73 12.73
17 43 50.5-7.496
18 100 102.3-2.279
19 111 18.17 92.83
20-57 63.67-120.7
21 98 158.7-60.73
22 85 160.9-75.88
23 213 270.6-57.57
24-17 6.639-23.64
25 294 277.7 16.31
26 195 175.4 19.62
27 235 77.46 157.5
28 75 121.7-46.69
29 93 237.1-144.1
30 33 3.475 29.52
31 95 132.3-37.3
32 182 186.9-4.854
33 124 207.6-83.61
34 92 124-31.98
35 11 68.27-57.27
36 314 233.6 80.38
37 372 249.4 122.6
38 1 135.2-134.2
39 28 37.87-9.871
40 50-2.344 52.34
41 40 29.08 10.92
42 17 12.98 4.016
43 51 91.02-40.02
44 103 66.14 36.86
45 208 79.49 128.5
46 28 81.49-53.49
47 29 77.36-48.36
48 21 88.22-67.22
49 34 57.83-23.83
50 146 17.91 128.1
51 26 35.76-9.762
52 69 14.6 54.4
53 39 64.07-25.07
54-23 41.79-64.79
55 170 170.4-0.3888
56 20 60.18-40.18
57 56 48.46 7.54
58 16 70.72-54.72
59 28 54.03-26.03
60 43 99.84-56.84
61 143 80.22 62.78
62 12 93.68-81.68
63 63 38.25 24.75
64 140 143-3.033
65 141 112.8 28.22
66 44 106.7-62.74
67 591 203.3 387.7
68 9 43.04-34.04
69 5 103.2-98.23
70 20 72.18-52.18


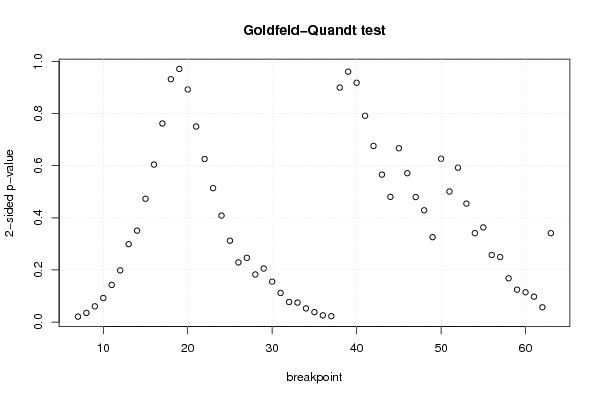
Goldfeld-Quandt test for Heteroskedasticity
p-valuesAlternative Hypothesis
breakpoint indexgreater2-sidedless
7 0.9895 0.02107 0.01053
8 0.9823 0.03539 0.01769
9 0.9696 0.06072 0.03036
10 0.9537 0.0925 0.04625
11 0.9286 0.1427 0.07137
12 0.9007 0.1986 0.09931
13 0.8505 0.299 0.1495
14 0.8245 0.351 0.1755
15 0.7634 0.4732 0.2366
16 0.6979 0.6042 0.3021
17 0.6191 0.7617 0.3809
18 0.5343 0.9314 0.4657
19 0.4854 0.9709 0.5146
20 0.4461 0.8922 0.5539
21 0.375 0.7501 0.625
22 0.3128 0.6256 0.6872
23 0.2569 0.5137 0.7431
24 0.2043 0.4085 0.7957
25 0.1562 0.3124 0.8438
26 0.1146 0.2291 0.8854
27 0.1233 0.2467 0.8767
28 0.0914 0.1828 0.9086
29 0.1028 0.2057 0.8972
30 0.07766 0.1553 0.9223
31 0.05596 0.1119 0.944
32 0.03863 0.07725 0.9614
33 0.03745 0.07489 0.9626
34 0.02646 0.05293 0.9735
35 0.01923 0.03845 0.9808
36 0.013 0.026 0.987
37 0.01143 0.02286 0.9886
38 0.5502 0.8995 0.4498
39 0.4802 0.9604 0.5198
40 0.4589 0.9178 0.5411
41 0.3957 0.7914 0.6043
42 0.3378 0.6756 0.6622
43 0.2829 0.5658 0.7171
44 0.2402 0.4805 0.7598
45 0.3334 0.6667 0.6666
46 0.2855 0.5711 0.7145
47 0.2398 0.4797 0.7602
48 0.2145 0.4289 0.7855
49 0.1629 0.3259 0.8371
50 0.3133 0.6266 0.6867
51 0.2505 0.5009 0.7495
52 0.2961 0.5922 0.7039
53 0.2273 0.4545 0.7727
54 0.1706 0.3412 0.8294
55 0.1816 0.3633 0.8184
56 0.1288 0.2575 0.8712
57 0.1249 0.2498 0.8751
58 0.08409 0.1682 0.9159
59 0.06229 0.1246 0.9377
60 0.0573 0.1146 0.9427
61 0.0489 0.09781 0.9511
62 0.02846 0.05691 0.9715
63 0.1706 0.3411 0.8294

\begin{tabular}{lllllllll}
\hline
Goldfeld-Quandt test for Heteroskedasticity \tabularnewline
p-values & Alternative Hypothesis \tabularnewline
breakpoint index & greater & 2-sided & less \tabularnewline
7 &  0.9895 &  0.02107 &  0.01053 \tabularnewline
8 &  0.9823 &  0.03539 &  0.01769 \tabularnewline
9 &  0.9696 &  0.06072 &  0.03036 \tabularnewline
10 &  0.9537 &  0.0925 &  0.04625 \tabularnewline
11 &  0.9286 &  0.1427 &  0.07137 \tabularnewline
12 &  0.9007 &  0.1986 &  0.09931 \tabularnewline
13 &  0.8505 &  0.299 &  0.1495 \tabularnewline
14 &  0.8245 &  0.351 &  0.1755 \tabularnewline
15 &  0.7634 &  0.4732 &  0.2366 \tabularnewline
16 &  0.6979 &  0.6042 &  0.3021 \tabularnewline
17 &  0.6191 &  0.7617 &  0.3809 \tabularnewline
18 &  0.5343 &  0.9314 &  0.4657 \tabularnewline
19 &  0.4854 &  0.9709 &  0.5146 \tabularnewline
20 &  0.4461 &  0.8922 &  0.5539 \tabularnewline
21 &  0.375 &  0.7501 &  0.625 \tabularnewline
22 &  0.3128 &  0.6256 &  0.6872 \tabularnewline
23 &  0.2569 &  0.5137 &  0.7431 \tabularnewline
24 &  0.2043 &  0.4085 &  0.7957 \tabularnewline
25 &  0.1562 &  0.3124 &  0.8438 \tabularnewline
26 &  0.1146 &  0.2291 &  0.8854 \tabularnewline
27 &  0.1233 &  0.2467 &  0.8767 \tabularnewline
28 &  0.0914 &  0.1828 &  0.9086 \tabularnewline
29 &  0.1028 &  0.2057 &  0.8972 \tabularnewline
30 &  0.07766 &  0.1553 &  0.9223 \tabularnewline
31 &  0.05596 &  0.1119 &  0.944 \tabularnewline
32 &  0.03863 &  0.07725 &  0.9614 \tabularnewline
33 &  0.03745 &  0.07489 &  0.9626 \tabularnewline
34 &  0.02646 &  0.05293 &  0.9735 \tabularnewline
35 &  0.01923 &  0.03845 &  0.9808 \tabularnewline
36 &  0.013 &  0.026 &  0.987 \tabularnewline
37 &  0.01143 &  0.02286 &  0.9886 \tabularnewline
38 &  0.5502 &  0.8995 &  0.4498 \tabularnewline
39 &  0.4802 &  0.9604 &  0.5198 \tabularnewline
40 &  0.4589 &  0.9178 &  0.5411 \tabularnewline
41 &  0.3957 &  0.7914 &  0.6043 \tabularnewline
42 &  0.3378 &  0.6756 &  0.6622 \tabularnewline
43 &  0.2829 &  0.5658 &  0.7171 \tabularnewline
44 &  0.2402 &  0.4805 &  0.7598 \tabularnewline
45 &  0.3334 &  0.6667 &  0.6666 \tabularnewline
46 &  0.2855 &  0.5711 &  0.7145 \tabularnewline
47 &  0.2398 &  0.4797 &  0.7602 \tabularnewline
48 &  0.2145 &  0.4289 &  0.7855 \tabularnewline
49 &  0.1629 &  0.3259 &  0.8371 \tabularnewline
50 &  0.3133 &  0.6266 &  0.6867 \tabularnewline
51 &  0.2505 &  0.5009 &  0.7495 \tabularnewline
52 &  0.2961 &  0.5922 &  0.7039 \tabularnewline
53 &  0.2273 &  0.4545 &  0.7727 \tabularnewline
54 &  0.1706 &  0.3412 &  0.8294 \tabularnewline
55 &  0.1816 &  0.3633 &  0.8184 \tabularnewline
56 &  0.1288 &  0.2575 &  0.8712 \tabularnewline
57 &  0.1249 &  0.2498 &  0.8751 \tabularnewline
58 &  0.08409 &  0.1682 &  0.9159 \tabularnewline
59 &  0.06229 &  0.1246 &  0.9377 \tabularnewline
60 &  0.0573 &  0.1146 &  0.9427 \tabularnewline
61 &  0.0489 &  0.09781 &  0.9511 \tabularnewline
62 &  0.02846 &  0.05691 &  0.9715 \tabularnewline
63 &  0.1706 &  0.3411 &  0.8294 \tabularnewline
\hline
\end{tabular}
%Source: https://freestatistics.org/blog/index.php?pk=308613&T=6

[TABLE]
[ROW][C]Goldfeld-Quandt test for Heteroskedasticity[/C][/ROW]
[ROW][C]p-values[/C][C]Alternative Hypothesis[/C][/ROW]
[ROW][C]breakpoint index[/C][C]greater[/C][C]2-sided[/C][C]less[/C][/ROW]
[ROW][C]7[/C][C] 0.9895[/C][C] 0.02107[/C][C] 0.01053[/C][/ROW]
[ROW][C]8[/C][C] 0.9823[/C][C] 0.03539[/C][C] 0.01769[/C][/ROW]
[ROW][C]9[/C][C] 0.9696[/C][C] 0.06072[/C][C] 0.03036[/C][/ROW]
[ROW][C]10[/C][C] 0.9537[/C][C] 0.0925[/C][C] 0.04625[/C][/ROW]
[ROW][C]11[/C][C] 0.9286[/C][C] 0.1427[/C][C] 0.07137[/C][/ROW]
[ROW][C]12[/C][C] 0.9007[/C][C] 0.1986[/C][C] 0.09931[/C][/ROW]
[ROW][C]13[/C][C] 0.8505[/C][C] 0.299[/C][C] 0.1495[/C][/ROW]
[ROW][C]14[/C][C] 0.8245[/C][C] 0.351[/C][C] 0.1755[/C][/ROW]
[ROW][C]15[/C][C] 0.7634[/C][C] 0.4732[/C][C] 0.2366[/C][/ROW]
[ROW][C]16[/C][C] 0.6979[/C][C] 0.6042[/C][C] 0.3021[/C][/ROW]
[ROW][C]17[/C][C] 0.6191[/C][C] 0.7617[/C][C] 0.3809[/C][/ROW]
[ROW][C]18[/C][C] 0.5343[/C][C] 0.9314[/C][C] 0.4657[/C][/ROW]
[ROW][C]19[/C][C] 0.4854[/C][C] 0.9709[/C][C] 0.5146[/C][/ROW]
[ROW][C]20[/C][C] 0.4461[/C][C] 0.8922[/C][C] 0.5539[/C][/ROW]
[ROW][C]21[/C][C] 0.375[/C][C] 0.7501[/C][C] 0.625[/C][/ROW]
[ROW][C]22[/C][C] 0.3128[/C][C] 0.6256[/C][C] 0.6872[/C][/ROW]
[ROW][C]23[/C][C] 0.2569[/C][C] 0.5137[/C][C] 0.7431[/C][/ROW]
[ROW][C]24[/C][C] 0.2043[/C][C] 0.4085[/C][C] 0.7957[/C][/ROW]
[ROW][C]25[/C][C] 0.1562[/C][C] 0.3124[/C][C] 0.8438[/C][/ROW]
[ROW][C]26[/C][C] 0.1146[/C][C] 0.2291[/C][C] 0.8854[/C][/ROW]
[ROW][C]27[/C][C] 0.1233[/C][C] 0.2467[/C][C] 0.8767[/C][/ROW]
[ROW][C]28[/C][C] 0.0914[/C][C] 0.1828[/C][C] 0.9086[/C][/ROW]
[ROW][C]29[/C][C] 0.1028[/C][C] 0.2057[/C][C] 0.8972[/C][/ROW]
[ROW][C]30[/C][C] 0.07766[/C][C] 0.1553[/C][C] 0.9223[/C][/ROW]
[ROW][C]31[/C][C] 0.05596[/C][C] 0.1119[/C][C] 0.944[/C][/ROW]
[ROW][C]32[/C][C] 0.03863[/C][C] 0.07725[/C][C] 0.9614[/C][/ROW]
[ROW][C]33[/C][C] 0.03745[/C][C] 0.07489[/C][C] 0.9626[/C][/ROW]
[ROW][C]34[/C][C] 0.02646[/C][C] 0.05293[/C][C] 0.9735[/C][/ROW]
[ROW][C]35[/C][C] 0.01923[/C][C] 0.03845[/C][C] 0.9808[/C][/ROW]
[ROW][C]36[/C][C] 0.013[/C][C] 0.026[/C][C] 0.987[/C][/ROW]
[ROW][C]37[/C][C] 0.01143[/C][C] 0.02286[/C][C] 0.9886[/C][/ROW]
[ROW][C]38[/C][C] 0.5502[/C][C] 0.8995[/C][C] 0.4498[/C][/ROW]
[ROW][C]39[/C][C] 0.4802[/C][C] 0.9604[/C][C] 0.5198[/C][/ROW]
[ROW][C]40[/C][C] 0.4589[/C][C] 0.9178[/C][C] 0.5411[/C][/ROW]
[ROW][C]41[/C][C] 0.3957[/C][C] 0.7914[/C][C] 0.6043[/C][/ROW]
[ROW][C]42[/C][C] 0.3378[/C][C] 0.6756[/C][C] 0.6622[/C][/ROW]
[ROW][C]43[/C][C] 0.2829[/C][C] 0.5658[/C][C] 0.7171[/C][/ROW]
[ROW][C]44[/C][C] 0.2402[/C][C] 0.4805[/C][C] 0.7598[/C][/ROW]
[ROW][C]45[/C][C] 0.3334[/C][C] 0.6667[/C][C] 0.6666[/C][/ROW]
[ROW][C]46[/C][C] 0.2855[/C][C] 0.5711[/C][C] 0.7145[/C][/ROW]
[ROW][C]47[/C][C] 0.2398[/C][C] 0.4797[/C][C] 0.7602[/C][/ROW]
[ROW][C]48[/C][C] 0.2145[/C][C] 0.4289[/C][C] 0.7855[/C][/ROW]
[ROW][C]49[/C][C] 0.1629[/C][C] 0.3259[/C][C] 0.8371[/C][/ROW]
[ROW][C]50[/C][C] 0.3133[/C][C] 0.6266[/C][C] 0.6867[/C][/ROW]
[ROW][C]51[/C][C] 0.2505[/C][C] 0.5009[/C][C] 0.7495[/C][/ROW]
[ROW][C]52[/C][C] 0.2961[/C][C] 0.5922[/C][C] 0.7039[/C][/ROW]
[ROW][C]53[/C][C] 0.2273[/C][C] 0.4545[/C][C] 0.7727[/C][/ROW]
[ROW][C]54[/C][C] 0.1706[/C][C] 0.3412[/C][C] 0.8294[/C][/ROW]
[ROW][C]55[/C][C] 0.1816[/C][C] 0.3633[/C][C] 0.8184[/C][/ROW]
[ROW][C]56[/C][C] 0.1288[/C][C] 0.2575[/C][C] 0.8712[/C][/ROW]
[ROW][C]57[/C][C] 0.1249[/C][C] 0.2498[/C][C] 0.8751[/C][/ROW]
[ROW][C]58[/C][C] 0.08409[/C][C] 0.1682[/C][C] 0.9159[/C][/ROW]
[ROW][C]59[/C][C] 0.06229[/C][C] 0.1246[/C][C] 0.9377[/C][/ROW]
[ROW][C]60[/C][C] 0.0573[/C][C] 0.1146[/C][C] 0.9427[/C][/ROW]
[ROW][C]61[/C][C] 0.0489[/C][C] 0.09781[/C][C] 0.9511[/C][/ROW]
[ROW][C]62[/C][C] 0.02846[/C][C] 0.05691[/C][C] 0.9715[/C][/ROW]
[ROW][C]63[/C][C] 0.1706[/C][C] 0.3411[/C][C] 0.8294[/C][/ROW]
[/TABLE]
Source: https://freestatistics.org/blog/index.php?pk=308613&T=6

Globally Unique Identifier (entire table): ba.freestatistics.org/blog/index.php?pk=308613&T=6

As an alternative you can also use a QR Code:  

The GUIDs for individual cells are displayed in the table below:

Goldfeld-Quandt test for Heteroskedasticity
p-valuesAlternative Hypothesis
breakpoint indexgreater2-sidedless
7 0.9895 0.02107 0.01053
8 0.9823 0.03539 0.01769
9 0.9696 0.06072 0.03036
10 0.9537 0.0925 0.04625
11 0.9286 0.1427 0.07137
12 0.9007 0.1986 0.09931
13 0.8505 0.299 0.1495
14 0.8245 0.351 0.1755
15 0.7634 0.4732 0.2366
16 0.6979 0.6042 0.3021
17 0.6191 0.7617 0.3809
18 0.5343 0.9314 0.4657
19 0.4854 0.9709 0.5146
20 0.4461 0.8922 0.5539
21 0.375 0.7501 0.625
22 0.3128 0.6256 0.6872
23 0.2569 0.5137 0.7431
24 0.2043 0.4085 0.7957
25 0.1562 0.3124 0.8438
26 0.1146 0.2291 0.8854
27 0.1233 0.2467 0.8767
28 0.0914 0.1828 0.9086
29 0.1028 0.2057 0.8972
30 0.07766 0.1553 0.9223
31 0.05596 0.1119 0.944
32 0.03863 0.07725 0.9614
33 0.03745 0.07489 0.9626
34 0.02646 0.05293 0.9735
35 0.01923 0.03845 0.9808
36 0.013 0.026 0.987
37 0.01143 0.02286 0.9886
38 0.5502 0.8995 0.4498
39 0.4802 0.9604 0.5198
40 0.4589 0.9178 0.5411
41 0.3957 0.7914 0.6043
42 0.3378 0.6756 0.6622
43 0.2829 0.5658 0.7171
44 0.2402 0.4805 0.7598
45 0.3334 0.6667 0.6666
46 0.2855 0.5711 0.7145
47 0.2398 0.4797 0.7602
48 0.2145 0.4289 0.7855
49 0.1629 0.3259 0.8371
50 0.3133 0.6266 0.6867
51 0.2505 0.5009 0.7495
52 0.2961 0.5922 0.7039
53 0.2273 0.4545 0.7727
54 0.1706 0.3412 0.8294
55 0.1816 0.3633 0.8184
56 0.1288 0.2575 0.8712
57 0.1249 0.2498 0.8751
58 0.08409 0.1682 0.9159
59 0.06229 0.1246 0.9377
60 0.0573 0.1146 0.9427
61 0.0489 0.09781 0.9511
62 0.02846 0.05691 0.9715
63 0.1706 0.3411 0.8294


Meta Analysis of Goldfeld-Quandt test for Heteroskedasticity
Description# significant tests% significant testsOK/NOK
1% type I error level0 0OK
5% type I error level50.0877193NOK
10% type I error level120.210526NOK

\begin{tabular}{lllllllll}
\hline
Meta Analysis of Goldfeld-Quandt test for Heteroskedasticity \tabularnewline
Description & # significant tests & % significant tests & OK/NOK \tabularnewline
1% type I error level & 0 &  0 & OK \tabularnewline
5% type I error level & 5 & 0.0877193 & NOK \tabularnewline
10% type I error level & 12 & 0.210526 & NOK \tabularnewline
\hline
\end{tabular}
%Source: https://freestatistics.org/blog/index.php?pk=308613&T=7

[TABLE]
[ROW][C]Meta Analysis of Goldfeld-Quandt test for Heteroskedasticity[/C][/ROW]
[ROW][C]Description[/C][C]# significant tests[/C][C]% significant tests[/C][C]OK/NOK[/C][/ROW]
[ROW][C]1% type I error level[/C][C]0[/C][C] 0[/C][C]OK[/C][/ROW]
[ROW][C]5% type I error level[/C][C]5[/C][C]0.0877193[/C][C]NOK[/C][/ROW]
[ROW][C]10% type I error level[/C][C]12[/C][C]0.210526[/C][C]NOK[/C][/ROW]
[/TABLE]
Source: https://freestatistics.org/blog/index.php?pk=308613&T=7

Globally Unique Identifier (entire table): ba.freestatistics.org/blog/index.php?pk=308613&T=7

As an alternative you can also use a QR Code:  

The GUIDs for individual cells are displayed in the table below:

Meta Analysis of Goldfeld-Quandt test for Heteroskedasticity
Description# significant tests% significant testsOK/NOK
1% type I error level0 0OK
5% type I error level50.0877193NOK
10% type I error level120.210526NOK


Ramsey RESET F-Test for powers (2 and 3) of fitted values
> reset_test_fitted
	RESET test
data:  mylm
RESET = 6.6873, df1 = 2, df2 = 64, p-value = 0.002305
Ramsey RESET F-Test for powers (2 and 3) of regressors
> reset_test_regressors
	RESET test
data:  mylm
RESET = 19.065, df1 = 6, df2 = 60, p-value = 2.772e-12
Ramsey RESET F-Test for powers (2 and 3) of principal components
> reset_test_principal_components
	RESET test
data:  mylm
RESET = 5.2771, df1 = 2, df2 = 64, p-value = 0.007562

\begin{tabular}{lllllllll}
\hline
Ramsey RESET F-Test for powers (2 and 3) of fitted values \tabularnewline
> reset_test_fitted
	RESET test
data:  mylm
RESET = 6.6873, df1 = 2, df2 = 64, p-value = 0.002305
\tabularnewline Ramsey RESET F-Test for powers (2 and 3) of regressors \tabularnewline
> reset_test_regressors
	RESET test
data:  mylm
RESET = 19.065, df1 = 6, df2 = 60, p-value = 2.772e-12
\tabularnewline Ramsey RESET F-Test for powers (2 and 3) of principal components \tabularnewline
> reset_test_principal_components
	RESET test
data:  mylm
RESET = 5.2771, df1 = 2, df2 = 64, p-value = 0.007562
\tabularnewline \hline \end{tabular} %Source: https://freestatistics.org/blog/index.php?pk=308613&T=8

[TABLE]
[ROW][C]Ramsey RESET F-Test for powers (2 and 3) of fitted values[/C][/ROW]
[ROW][C]
> reset_test_fitted
	RESET test
data:  mylm
RESET = 6.6873, df1 = 2, df2 = 64, p-value = 0.002305
[/C][/ROW] [ROW][C]Ramsey RESET F-Test for powers (2 and 3) of regressors[/C][/ROW] [ROW][C]
> reset_test_regressors
	RESET test
data:  mylm
RESET = 19.065, df1 = 6, df2 = 60, p-value = 2.772e-12
[/C][/ROW] [ROW][C]Ramsey RESET F-Test for powers (2 and 3) of principal components[/C][/ROW] [ROW][C]
> reset_test_principal_components
	RESET test
data:  mylm
RESET = 5.2771, df1 = 2, df2 = 64, p-value = 0.007562
[/C][/ROW] [/TABLE] Source: https://freestatistics.org/blog/index.php?pk=308613&T=8

Globally Unique Identifier (entire table): ba.freestatistics.org/blog/index.php?pk=308613&T=8

As an alternative you can also use a QR Code:  

The GUIDs for individual cells are displayed in the table below:

Ramsey RESET F-Test for powers (2 and 3) of fitted values
> reset_test_fitted
	RESET test
data:  mylm
RESET = 6.6873, df1 = 2, df2 = 64, p-value = 0.002305
Ramsey RESET F-Test for powers (2 and 3) of regressors
> reset_test_regressors
	RESET test
data:  mylm
RESET = 19.065, df1 = 6, df2 = 60, p-value = 2.772e-12
Ramsey RESET F-Test for powers (2 and 3) of principal components
> reset_test_principal_components
	RESET test
data:  mylm
RESET = 5.2771, df1 = 2, df2 = 64, p-value = 0.007562


Variance Inflation Factors (Multicollinearity)
> vif
     `1`      `2`      `3` 
1.010695 1.024767 1.018582 

\begin{tabular}{lllllllll}
\hline
Variance Inflation Factors (Multicollinearity) \tabularnewline
> vif
     `1`      `2`      `3` 
1.010695 1.024767 1.018582 
\tabularnewline \hline \end{tabular} %Source: https://freestatistics.org/blog/index.php?pk=308613&T=9

[TABLE]
[ROW][C]Variance Inflation Factors (Multicollinearity)[/C][/ROW]
[ROW][C]
> vif
     `1`      `2`      `3` 
1.010695 1.024767 1.018582 
[/C][/ROW] [/TABLE] Source: https://freestatistics.org/blog/index.php?pk=308613&T=9

Globally Unique Identifier (entire table): ba.freestatistics.org/blog/index.php?pk=308613&T=9

As an alternative you can also use a QR Code:  

The GUIDs for individual cells are displayed in the table below:

Variance Inflation Factors (Multicollinearity)
> vif
     `1`      `2`      `3` 
1.010695 1.024767 1.018582 


Parameters (Session):
par1 = 4 ; par2 = Do not include Seasonal Dummies ; par3 = No Linear Trend ; par4 = 0 ; par5 = 0 ; par6 = 12 ;
Parameters (R input):
par1 = 4 ; par2 = Do not include Seasonal Dummies ; par3 = No Linear Trend ; par4 = 0 ; par5 = 0 ; par6 = 12 ;
R code (references can be found in the software module):
library(lattice)
library(lmtest)
library(car)
library(MASS)
n25 <- 25 #minimum number of obs. for Goldfeld-Quandt test
mywarning <- ''
par6 <- as.numeric(par6)
if(is.na(par6)) {
par6 <- 12
mywarning = 'Warning: you did not specify the seasonality. The seasonal period was set to s = 12.'
}
par1 <- as.numeric(par1)
if(is.na(par1)) {
par1 <- 1
mywarning = 'Warning: you did not specify the column number of the endogenous series! The first column was selected by default.'
}
if (par4=='') par4 <- 0
par4 <- as.numeric(par4)
if (!is.numeric(par4)) par4 <- 0
if (par5=='') par5 <- 0
par5 <- as.numeric(par5)
if (!is.numeric(par5)) par5 <- 0
x <- na.omit(t(y))
k <- length(x[1,])
n <- length(x[,1])
x1 <- cbind(x[,par1], x[,1:k!=par1])
mycolnames <- c(colnames(x)[par1], colnames(x)[1:k!=par1])
colnames(x1) <- mycolnames #colnames(x)[par1]
x <- x1
if (par3 == 'First Differences'){
(n <- n -1)
x2 <- array(0, dim=c(n,k), dimnames=list(1:n, paste('(1-B)',colnames(x),sep='')))
for (i in 1:n) {
for (j in 1:k) {
x2[i,j] <- x[i+1,j] - x[i,j]
}
}
x <- x2
}
if (par3 == 'Seasonal Differences (s)'){
(n <- n - par6)
x2 <- array(0, dim=c(n,k), dimnames=list(1:n, paste('(1-Bs)',colnames(x),sep='')))
for (i in 1:n) {
for (j in 1:k) {
x2[i,j] <- x[i+par6,j] - x[i,j]
}
}
x <- x2
}
if (par3 == 'First and Seasonal Differences (s)'){
(n <- n -1)
x2 <- array(0, dim=c(n,k), dimnames=list(1:n, paste('(1-B)',colnames(x),sep='')))
for (i in 1:n) {
for (j in 1:k) {
x2[i,j] <- x[i+1,j] - x[i,j]
}
}
x <- x2
(n <- n - par6)
x2 <- array(0, dim=c(n,k), dimnames=list(1:n, paste('(1-Bs)',colnames(x),sep='')))
for (i in 1:n) {
for (j in 1:k) {
x2[i,j] <- x[i+par6,j] - x[i,j]
}
}
x <- x2
}
if(par4 > 0) {
x2 <- array(0, dim=c(n-par4,par4), dimnames=list(1:(n-par4), paste(colnames(x)[par1],'(t-',1:par4,')',sep='')))
for (i in 1:(n-par4)) {
for (j in 1:par4) {
x2[i,j] <- x[i+par4-j,par1]
}
}
x <- cbind(x[(par4+1):n,], x2)
n <- n - par4
}
if(par5 > 0) {
x2 <- array(0, dim=c(n-par5*par6,par5), dimnames=list(1:(n-par5*par6), paste(colnames(x)[par1],'(t-',1:par5,'s)',sep='')))
for (i in 1:(n-par5*par6)) {
for (j in 1:par5) {
x2[i,j] <- x[i+par5*par6-j*par6,par1]
}
}
x <- cbind(x[(par5*par6+1):n,], x2)
n <- n - par5*par6
}
if (par2 == 'Include Seasonal Dummies'){
x2 <- array(0, dim=c(n,par6-1), dimnames=list(1:n, paste('M', seq(1:(par6-1)), sep ='')))
for (i in 1:(par6-1)){
x2[seq(i,n,par6),i] <- 1
}
x <- cbind(x, x2)
}
if (par2 == 'Include Monthly Dummies'){
x2 <- array(0, dim=c(n,11), dimnames=list(1:n, paste('M', seq(1:11), sep ='')))
for (i in 1:11){
x2[seq(i,n,12),i] <- 1
}
x <- cbind(x, x2)
}
if (par2 == 'Include Quarterly Dummies'){
x2 <- array(0, dim=c(n,3), dimnames=list(1:n, paste('Q', seq(1:3), sep ='')))
for (i in 1:3){
x2[seq(i,n,4),i] <- 1
}
x <- cbind(x, x2)
}
(k <- length(x[n,]))
if (par3 == 'Linear Trend'){
x <- cbind(x, c(1:n))
colnames(x)[k+1] <- 't'
}
print(x)
(k <- length(x[n,]))
head(x)
df <- as.data.frame(x)
(mylm <- lm(df))
(mysum <- summary(mylm))
if (n > n25) {
kp3 <- k + 3
nmkm3 <- n - k - 3
gqarr <- array(NA, dim=c(nmkm3-kp3+1,3))
numgqtests <- 0
numsignificant1 <- 0
numsignificant5 <- 0
numsignificant10 <- 0
for (mypoint in kp3:nmkm3) {
j <- 0
numgqtests <- numgqtests + 1
for (myalt in c('greater', 'two.sided', 'less')) {
j <- j + 1
gqarr[mypoint-kp3+1,j] <- gqtest(mylm, point=mypoint, alternative=myalt)$p.value
}
if (gqarr[mypoint-kp3+1,2] < 0.01) numsignificant1 <- numsignificant1 + 1
if (gqarr[mypoint-kp3+1,2] < 0.05) numsignificant5 <- numsignificant5 + 1
if (gqarr[mypoint-kp3+1,2] < 0.10) numsignificant10 <- numsignificant10 + 1
}
gqarr
}
bitmap(file='test0.png')
plot(x[,1], type='l', main='Actuals and Interpolation', ylab='value of Actuals and Interpolation (dots)', xlab='time or index')
points(x[,1]-mysum$resid)
grid()
dev.off()
bitmap(file='test1.png')
plot(mysum$resid, type='b', pch=19, main='Residuals', ylab='value of Residuals', xlab='time or index')
grid()
dev.off()
bitmap(file='test2.png')
sresid <- studres(mylm)
hist(sresid, freq=FALSE, main='Distribution of Studentized Residuals')
xfit<-seq(min(sresid),max(sresid),length=40)
yfit<-dnorm(xfit)
lines(xfit, yfit)
grid()
dev.off()
bitmap(file='test3.png')
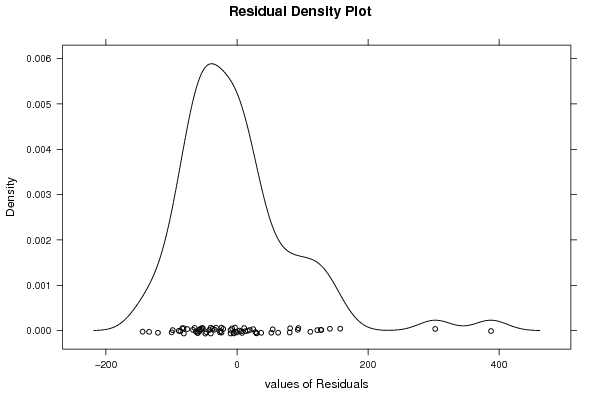
densityplot(~mysum$resid,col='black',main='Residual Density Plot', xlab='values of Residuals')
dev.off()
bitmap(file='test4.png')
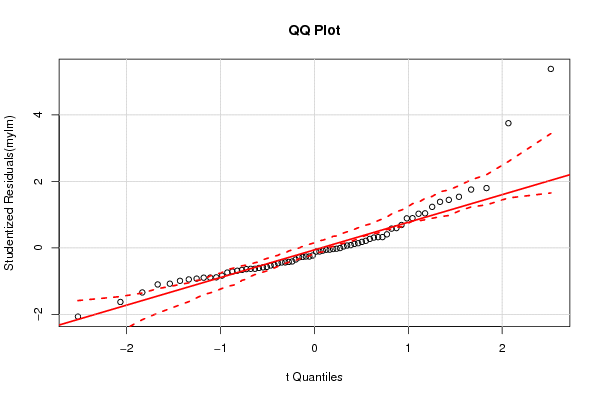
qqPlot(mylm, main='QQ Plot')
grid()
dev.off()
(myerror <- as.ts(mysum$resid))
bitmap(file='test5.png')
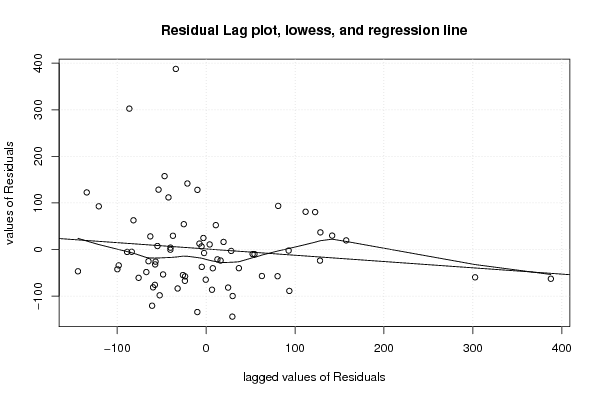
dum <- cbind(lag(myerror,k=1),myerror)
dum
dum1 <- dum[2:length(myerror),]
dum1
z <- as.data.frame(dum1)
print(z)
plot(z,main=paste('Residual Lag plot, lowess, and regression line'), ylab='values of Residuals', xlab='lagged values of Residuals')
lines(lowess(z))
abline(lm(z))
grid()
dev.off()
bitmap(file='test6.png')
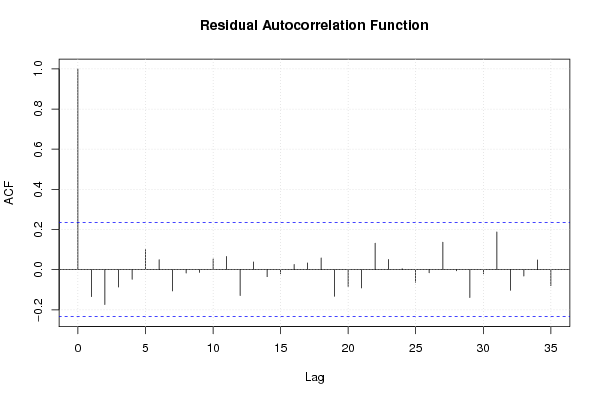
acf(mysum$resid, lag.max=length(mysum$resid)/2, main='Residual Autocorrelation Function')
grid()
dev.off()
bitmap(file='test7.png')
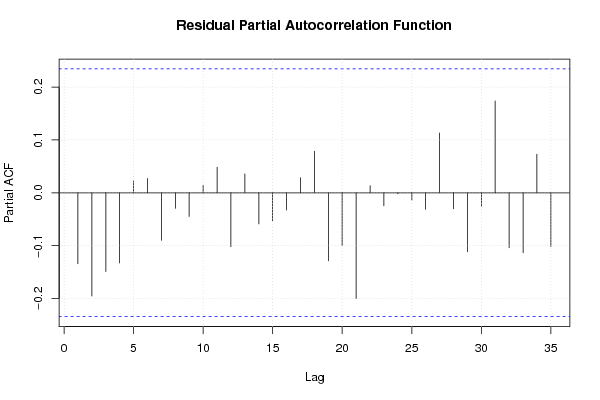
pacf(mysum$resid, lag.max=length(mysum$resid)/2, main='Residual Partial Autocorrelation Function')
grid()
dev.off()
bitmap(file='test8.png')
opar <- par(mfrow = c(2,2), oma = c(0, 0, 1.1, 0))
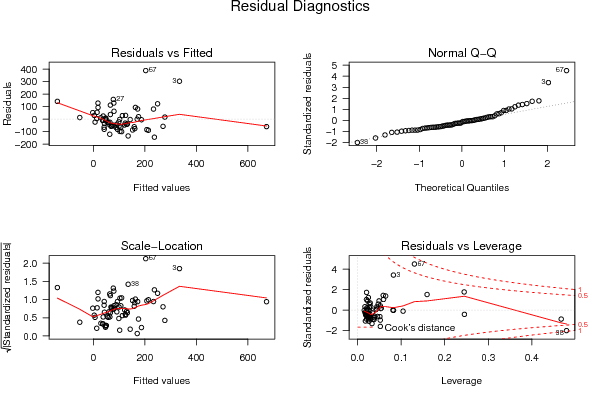
plot(mylm, las = 1, sub='Residual Diagnostics')
par(opar)
dev.off()
if (n > n25) {
bitmap(file='test9.png')
plot(kp3:nmkm3,gqarr[,2], main='Goldfeld-Quandt test',ylab='2-sided p-value',xlab='breakpoint')
grid()
dev.off()
}
load(file='createtable')
a<-table.start()
a<-table.row.start(a)
a<-table.element(a, 'Multiple Linear Regression - Estimated Regression Equation', 1, TRUE)
a<-table.row.end(a)
myeq <- colnames(x)[1]
myeq <- paste(myeq, '[t] = ', sep='')
for (i in 1:k){
if (mysum$coefficients[i,1] > 0) myeq <- paste(myeq, '+', '')
myeq <- paste(myeq, signif(mysum$coefficients[i,1],6), sep=' ')
if (rownames(mysum$coefficients)[i] != '(Intercept)') {
myeq <- paste(myeq, rownames(mysum$coefficients)[i], sep='')
if (rownames(mysum$coefficients)[i] != 't') myeq <- paste(myeq, '[t]', sep='')
}
}
myeq <- paste(myeq, ' + e[t]')
a<-table.row.start(a)
a<-table.element(a, myeq)
a<-table.row.end(a)
a<-table.row.start(a)
a<-table.element(a, mywarning)
a<-table.row.end(a)
a<-table.end(a)
table.save(a,file='mytable1.tab')
a<-table.start()
a<-table.row.start(a)
a<-table.element(a,'Multiple Linear Regression - Ordinary Least Squares', 6, TRUE)
a<-table.row.end(a)
a<-table.row.start(a)
a<-table.element(a,'Variable',header=TRUE)
a<-table.element(a,'Parameter',header=TRUE)
a<-table.element(a,'S.D.',header=TRUE)
a<-table.element(a,'T-STAT
H0: parameter = 0',header=TRUE)
a<-table.element(a,'2-tail p-value',header=TRUE)
a<-table.element(a,'1-tail p-value',header=TRUE)
a<-table.row.end(a)
for (i in 1:k){
a<-table.row.start(a)
a<-table.element(a,rownames(mysum$coefficients)[i],header=TRUE)
a<-table.element(a,formatC(signif(mysum$coefficients[i,1],5),format='g',flag='+'))
a<-table.element(a,formatC(signif(mysum$coefficients[i,2],5),format='g',flag=' '))
a<-table.element(a,formatC(signif(mysum$coefficients[i,3],4),format='e',flag='+'))
a<-table.element(a,formatC(signif(mysum$coefficients[i,4],4),format='g',flag=' '))
a<-table.element(a,formatC(signif(mysum$coefficients[i,4]/2,4),format='g',flag=' '))
a<-table.row.end(a)
}
a<-table.end(a)
table.save(a,file='mytable2.tab')
a<-table.start()
a<-table.row.start(a)
a<-table.element(a, 'Multiple Linear Regression - Regression Statistics', 2, TRUE)
a<-table.row.end(a)
a<-table.row.start(a)
a<-table.element(a, 'Multiple R',1,TRUE)
a<-table.element(a,formatC(signif(sqrt(mysum$r.squared),6),format='g',flag=' '))
a<-table.row.end(a)
a<-table.row.start(a)
a<-table.element(a, 'R-squared',1,TRUE)
a<-table.element(a,formatC(signif(mysum$r.squared,6),format='g',flag=' '))
a<-table.row.end(a)
a<-table.row.start(a)
a<-table.element(a, 'Adjusted R-squared',1,TRUE)
a<-table.element(a,formatC(signif(mysum$adj.r.squared,6),format='g',flag=' '))
a<-table.row.end(a)
a<-table.row.start(a)
a<-table.element(a, 'F-TEST (value)',1,TRUE)
a<-table.element(a,formatC(signif(mysum$fstatistic[1],6),format='g',flag=' '))
a<-table.row.end(a)
a<-table.row.start(a)
a<-table.element(a, 'F-TEST (DF numerator)',1,TRUE)
a<-table.element(a, signif(mysum$fstatistic[2],6))
a<-table.row.end(a)
a<-table.row.start(a)
a<-table.element(a, 'F-TEST (DF denominator)',1,TRUE)
a<-table.element(a, signif(mysum$fstatistic[3],6))
a<-table.row.end(a)
a<-table.row.start(a)
a<-table.element(a, 'p-value',1,TRUE)
a<-table.element(a,formatC(signif(1-pf(mysum$fstatistic[1],mysum$fstatistic[2],mysum$fstatistic[3]),6),format='g',flag=' '))
a<-table.row.end(a)
a<-table.row.start(a)
a<-table.element(a, 'Multiple Linear Regression - Residual Statistics', 2, TRUE)
a<-table.row.end(a)
a<-table.row.start(a)
a<-table.element(a, 'Residual Standard Deviation',1,TRUE)
a<-table.element(a,formatC(signif(mysum$sigma,6),format='g',flag=' '))
a<-table.row.end(a)
a<-table.row.start(a)
a<-table.element(a, 'Sum Squared Residuals',1,TRUE)
a<-table.element(a,formatC(signif(sum(myerror*myerror),6),format='g',flag=' '))
a<-table.row.end(a)
a<-table.end(a)
table.save(a,file='mytable3.tab')
myr <- as.numeric(mysum$resid)
myr
a <-table.start()
a <- table.row.start(a)
a <- table.element(a,'Menu of Residual Diagnostics',2,TRUE)
a <- table.row.end(a)
a <- table.row.start(a)
a <- table.element(a,'Description',1,TRUE)
a <- table.element(a,'Link',1,TRUE)
a <- table.row.end(a)
a <- table.row.start(a)
a <-table.element(a,'Histogram',1,header=TRUE)
a <- table.element(a,hyperlink( paste('https://supernova.wessa.net/rwasp_histogram.wasp?convertgetintopost=1&data=',paste(as.character(mysum$resid),sep='',collapse=' '),sep='') ,'Compute','Click here to examine the Residuals.'),1)
a <- table.row.end(a)
a <- table.row.start(a)
a <-table.element(a,'Central Tendency',1,header=TRUE)
a <- table.element(a,hyperlink( paste('https://supernova.wessa.net/rwasp_centraltendency.wasp?convertgetintopost=1&data=',paste(as.character(mysum$resid),sep='',collapse=' '),sep='') ,'Compute','Click here to examine the Residuals.'),1)
a <- table.row.end(a)
a <- table.row.start(a)
a <-table.element(a,'QQ Plot',1,header=TRUE)
a <- table.element(a,hyperlink( paste('https://supernova.wessa.net/rwasp_fitdistrnorm.wasp?convertgetintopost=1&data=',paste(as.character(mysum$resid),sep='',collapse=' '),sep='') ,'Compute','Click here to examine the Residuals.'),1)
a <- table.row.end(a)
a <- table.row.start(a)
a <-table.element(a,'Kernel Density Plot',1,header=TRUE)
a <- table.element(a,hyperlink( paste('https://supernova.wessa.net/rwasp_density.wasp?convertgetintopost=1&data=',paste(as.character(mysum$resid),sep='',collapse=' '),sep='') ,'Compute','Click here to examine the Residuals.'),1)
a <- table.row.end(a)
a <- table.row.start(a)
a <-table.element(a,'Skewness/Kurtosis Test',1,header=TRUE)
a <- table.element(a,hyperlink( paste('https://supernova.wessa.net/rwasp_skewness_kurtosis.wasp?convertgetintopost=1&data=',paste(as.character(mysum$resid),sep='',collapse=' '),sep='') ,'Compute','Click here to examine the Residuals.'),1)
a <- table.row.end(a)
a <- table.row.start(a)
a <-table.element(a,'Skewness-Kurtosis Plot',1,header=TRUE)
a <- table.element(a,hyperlink( paste('https://supernova.wessa.net/rwasp_skewness_kurtosis_plot.wasp?convertgetintopost=1&data=',paste(as.character(mysum$resid),sep='',collapse=' '),sep='') ,'Compute','Click here to examine the Residuals.'),1)
a <- table.row.end(a)
a <- table.row.start(a)
a <-table.element(a,'Harrell-Davis Plot',1,header=TRUE)
a <- table.element(a,hyperlink( paste('https://supernova.wessa.net/rwasp_harrell_davis.wasp?convertgetintopost=1&data=',paste(as.character(mysum$resid),sep='',collapse=' '),sep='') ,'Compute','Click here to examine the Residuals.'),1)
a <- table.row.end(a)
a <- table.row.start(a)
a <-table.element(a,'Bootstrap Plot -- Central Tendency',1,header=TRUE)
a <- table.element(a,hyperlink( paste('https://supernova.wessa.net/rwasp_bootstrapplot1.wasp?convertgetintopost=1&data=',paste(as.character(mysum$resid),sep='',collapse=' '),sep='') ,'Compute','Click here to examine the Residuals.'),1)
a <- table.row.end(a)
a <- table.row.start(a)
a <-table.element(a,'Blocked Bootstrap Plot -- Central Tendency',1,header=TRUE)
a <- table.element(a,hyperlink( paste('https://supernova.wessa.net/rwasp_bootstrapplot.wasp?convertgetintopost=1&data=',paste(as.character(mysum$resid),sep='',collapse=' '),sep='') ,'Compute','Click here to examine the Residuals.'),1)
a <- table.row.end(a)
a <- table.row.start(a)
a <-table.element(a,'(Partial) Autocorrelation Plot',1,header=TRUE)
a <- table.element(a,hyperlink( paste('https://supernova.wessa.net/rwasp_autocorrelation.wasp?convertgetintopost=1&data=',paste(as.character(mysum$resid),sep='',collapse=' '),sep='') ,'Compute','Click here to examine the Residuals.'),1)
a <- table.row.end(a)
a <- table.row.start(a)
a <-table.element(a,'Spectral Analysis',1,header=TRUE)
a <- table.element(a,hyperlink( paste('https://supernova.wessa.net/rwasp_spectrum.wasp?convertgetintopost=1&data=',paste(as.character(mysum$resid),sep='',collapse=' '),sep='') ,'Compute','Click here to examine the Residuals.'),1)
a <- table.row.end(a)
a <- table.row.start(a)
a <-table.element(a,'Tukey lambda PPCC Plot',1,header=TRUE)
a <- table.element(a,hyperlink( paste('https://supernova.wessa.net/rwasp_tukeylambda.wasp?convertgetintopost=1&data=',paste(as.character(mysum$resid),sep='',collapse=' '),sep='') ,'Compute','Click here to examine the Residuals.'),1)
a <- table.row.end(a)
a <- table.row.start(a)
a <-table.element(a,'Box-Cox Normality Plot',1,header=TRUE)
a <- table.element(a,hyperlink( paste('https://supernova.wessa.net/rwasp_boxcoxnorm.wasp?convertgetintopost=1&data=',paste(as.character(mysum$resid),sep='',collapse=' '),sep='') ,'Compute','Click here to examine the Residuals.'),1)
a <- table.row.end(a)
a <- table.row.start(a)
a <- table.element(a,'Summary Statistics',1,header=TRUE)
a <- table.element(a,hyperlink( paste('https://supernova.wessa.net/rwasp_summary1.wasp?convertgetintopost=1&data=',paste(as.character(mysum$resid),sep='',collapse=' '),sep='') ,'Compute','Click here to examine the Residuals.'),1)
a <- table.row.end(a)
a<-table.end(a)
table.save(a,file='mytable7.tab')
if(n < 200) {
a<-table.start()
a<-table.row.start(a)
a<-table.element(a, 'Multiple Linear Regression - Actuals, Interpolation, and Residuals', 4, TRUE)
a<-table.row.end(a)
a<-table.row.start(a)
a<-table.element(a, 'Time or Index', 1, TRUE)
a<-table.element(a, 'Actuals', 1, TRUE)
a<-table.element(a, 'Interpolation
Forecast', 1, TRUE)
a<-table.element(a, 'Residuals
Prediction Error', 1, TRUE)
a<-table.row.end(a)
for (i in 1:n) {
a<-table.row.start(a)
a<-table.element(a,i, 1, TRUE)
a<-table.element(a,formatC(signif(x[i],6),format='g',flag=' '))
a<-table.element(a,formatC(signif(x[i]-mysum$resid[i],6),format='g',flag=' '))
a<-table.element(a,formatC(signif(mysum$resid[i],6),format='g',flag=' '))
a<-table.row.end(a)
}
a<-table.end(a)
table.save(a,file='mytable4.tab')
if (n > n25) {
a<-table.start()
a<-table.row.start(a)
a<-table.element(a,'Goldfeld-Quandt test for Heteroskedasticity',4,TRUE)
a<-table.row.end(a)
a<-table.row.start(a)
a<-table.element(a,'p-values',header=TRUE)
a<-table.element(a,'Alternative Hypothesis',3,header=TRUE)
a<-table.row.end(a)
a<-table.row.start(a)
a<-table.element(a,'breakpoint index',header=TRUE)
a<-table.element(a,'greater',header=TRUE)
a<-table.element(a,'2-sided',header=TRUE)
a<-table.element(a,'less',header=TRUE)
a<-table.row.end(a)
for (mypoint in kp3:nmkm3) {
a<-table.row.start(a)
a<-table.element(a,mypoint,header=TRUE)
a<-table.element(a,formatC(signif(gqarr[mypoint-kp3+1,1],6),format='g',flag=' '))
a<-table.element(a,formatC(signif(gqarr[mypoint-kp3+1,2],6),format='g',flag=' '))
a<-table.element(a,formatC(signif(gqarr[mypoint-kp3+1,3],6),format='g',flag=' '))
a<-table.row.end(a)
}
a<-table.end(a)
table.save(a,file='mytable5.tab')
a<-table.start()
a<-table.row.start(a)
a<-table.element(a,'Meta Analysis of Goldfeld-Quandt test for Heteroskedasticity',4,TRUE)
a<-table.row.end(a)
a<-table.row.start(a)
a<-table.element(a,'Description',header=TRUE)
a<-table.element(a,'# significant tests',header=TRUE)
a<-table.element(a,'% significant tests',header=TRUE)
a<-table.element(a,'OK/NOK',header=TRUE)
a<-table.row.end(a)
a<-table.row.start(a)
a<-table.element(a,'1% type I error level',header=TRUE)
a<-table.element(a,signif(numsignificant1,6))
a<-table.element(a,formatC(signif(numsignificant1/numgqtests,6),format='g',flag=' '))
if (numsignificant1/numgqtests < 0.01) dum <- 'OK' else dum <- 'NOK'
a<-table.element(a,dum)
a<-table.row.end(a)
a<-table.row.start(a)
a<-table.element(a,'5% type I error level',header=TRUE)
a<-table.element(a,signif(numsignificant5,6))
a<-table.element(a,signif(numsignificant5/numgqtests,6))
if (numsignificant5/numgqtests < 0.05) dum <- 'OK' else dum <- 'NOK'
a<-table.element(a,dum)
a<-table.row.end(a)
a<-table.row.start(a)
a<-table.element(a,'10% type I error level',header=TRUE)
a<-table.element(a,signif(numsignificant10,6))
a<-table.element(a,signif(numsignificant10/numgqtests,6))
if (numsignificant10/numgqtests < 0.1) dum <- 'OK' else dum <- 'NOK'
a<-table.element(a,dum)
a<-table.row.end(a)
a<-table.end(a)
table.save(a,file='mytable6.tab')
}
}
a<-table.start()
a<-table.row.start(a)
a<-table.element(a,'Ramsey RESET F-Test for powers (2 and 3) of fitted values',1,TRUE)
a<-table.row.end(a)
a<-table.row.start(a)
reset_test_fitted <- resettest(mylm,power=2:3,type='fitted')
a<-table.element(a,paste('
',RC.texteval('reset_test_fitted'),'
',sep=''))
a<-table.row.end(a)
a<-table.row.start(a)
a<-table.element(a,'Ramsey RESET F-Test for powers (2 and 3) of regressors',1,TRUE)
a<-table.row.end(a)
a<-table.row.start(a)
reset_test_regressors <- resettest(mylm,power=2:3,type='regressor')
a<-table.element(a,paste('
',RC.texteval('reset_test_regressors'),'
',sep=''))
a<-table.row.end(a)
a<-table.row.start(a)
a<-table.element(a,'Ramsey RESET F-Test for powers (2 and 3) of principal components',1,TRUE)
a<-table.row.end(a)
a<-table.row.start(a)
reset_test_principal_components <- resettest(mylm,power=2:3,type='princomp')
a<-table.element(a,paste('
',RC.texteval('reset_test_principal_components'),'
',sep=''))
a<-table.row.end(a)
a<-table.end(a)
table.save(a,file='mytable8.tab')
a<-table.start()
a<-table.row.start(a)
a<-table.element(a,'Variance Inflation Factors (Multicollinearity)',1,TRUE)
a<-table.row.end(a)
a<-table.row.start(a)
vif <- vif(mylm)
a<-table.element(a,paste('
',RC.texteval('vif'),'
',sep=''))
a<-table.row.end(a)
a<-table.end(a)
table.save(a,file='mytable9.tab')