Free Statistics

of Irreproducible Research!

Author's title

Author*The author of this computation has been verified*
R Software Modulerwasp_autocorrelation.wasp
Title produced by software(Partial) Autocorrelation Function
Date of computationMon, 04 Dec 2017 18:30:17 +0100
Cite this page as followsStatistical Computations at FreeStatistics.org, Office for Research Development and Education, URL https://freestatistics.org/blog/index.php?v=date/2017/Dec/04/t1512408669l2ucpcw0my1tcgy.htm/, Retrieved Tue, 14 May 2024 19:11:45 +0000
Statistical Computations at FreeStatistics.org, Office for Research Development and Education, URL https://freestatistics.org/blog/index.php?pk=308516, Retrieved Tue, 14 May 2024 19:11:45 +0000
QR Codes:

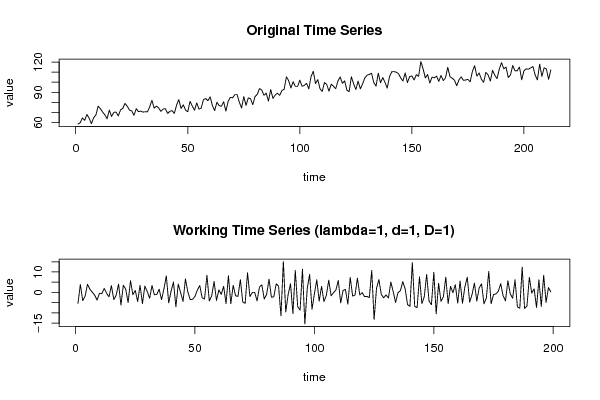
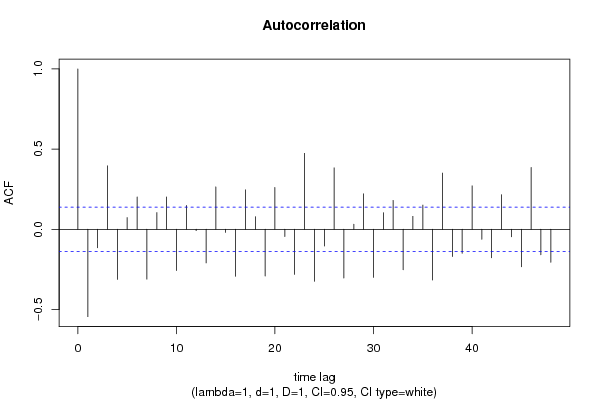
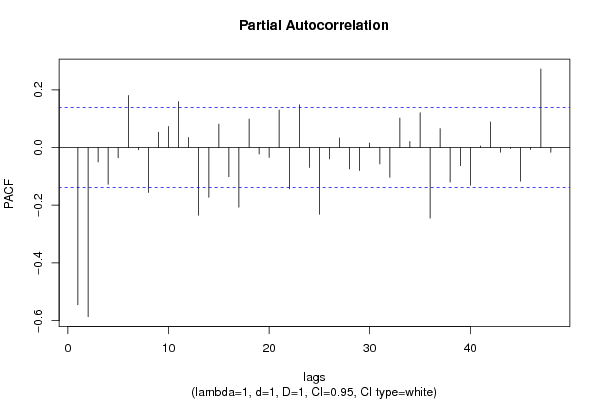
Original text written by user:Lambda= 1; d= 1; D= 1; s= 12
IsPrivate?No (this computation is public)
User-defined keywordsFood industry in Belgium
Estimated Impact93
Family? (F = Feedback message, R = changed R code, M = changed R Module, P = changed Parameters, D = changed Data)
-       [(Partial) Autocorrelation Function] [Autocorrelation F...] [2017-12-04 17:30:17] [97ca58e32232a99e44a6c848c7facc09] [Current]
Feedback Forum

Post a new message
Dataseries X:
58.5
59.8
64.6
62.2
68
64.3
58.9
64.8
67.5
76.2
73.7
70.4
67.7
63.7
72.4
66
70.1
70.4
66.6
72.6
74
79
76.1
72.3
71.6
67.2
73.8
70.8
71.4
70.4
70.7
70.6
75.5
82.1
74.3
76.3
74.5
71.1
73.3
73.8
69
71.1
71.9
69
77.3
82.8
74
77.6
72.3
70.7
81
76.4
72.3
79.5
73.3
74.5
82.7
83.8
81.6
85.5
76.7
71.8
80.2
76.8
76.1
80.7
71.3
80.9
85
84.5
87.7
87.7
80.2
74.4
85.8
77
84.5
83.6
77.7
85.7
87.9
93.7
92.3
87
89.1
81.3
92.7
83.9
87.3
89.1
86.9
91.7
93
105.3
101.6
94.2
100.5
95.8
95.8
102.1
96
96.8
98.9
93.4
105.5
110.9
98.6
102.6
93.5
90.8
99.7
97.8
91.1
98.1
96
93.5
101.2
105.2
98.9
101.3
92.1
90.6
105.4
98.4
92.7
101.2
93.4
98.3
104.3
107
107.7
108.9
99.6
96.1
109
99.5
104.6
99.9
94.1
105.3
110.4
110.5
110
108.5
104.3
101.2
109.2
99.6
105.6
106.2
102.2
107.5
105.8
120.5
113.2
104.3
107.7
99.2
105.1
104.3
106.1
100.8
106.7
101.6
104.4
114.8
105.4
104
102
96.5
102.3
105.3
101.9
102.2
102.8
100.4
110.7
116.4
106
109.2
103
99.8
109.8
107.3
101.2
111.8
106.9
103.5
113.1
119.4
113.3
115
104.7
107.2
116.6
111.3
111.4
115
102.4
111.4
113.2
112.9
114.2
115.6
107.1
102.3
117.9
105.8
114.3
113.1
102.9
112.2


Summary of computational transaction
Raw Input view raw input (R code)
Raw Outputview raw output of R engine
Computing time2 seconds
R ServerBig Analytics Cloud Computing Center

\begin{tabular}{lllllllll}
\hline
Summary of computational transaction \tabularnewline
Raw Input view raw input (R code)  \tabularnewline
Raw Outputview raw output of R engine  \tabularnewline
Computing time2 seconds \tabularnewline
R ServerBig Analytics Cloud Computing Center \tabularnewline
\hline
\end{tabular}
%Source: https://freestatistics.org/blog/index.php?pk=308516&T=0

[TABLE]
[ROW]
Summary of computational transaction[/C][/ROW] [ROW]Raw Input[/C] view raw input (R code) [/C][/ROW] [ROW]Raw Output[/C]view raw output of R engine [/C][/ROW] [ROW]Computing time[/C]2 seconds[/C][/ROW] [ROW]R Server[/C]Big Analytics Cloud Computing Center[/C][/ROW] [/TABLE] Source: https://freestatistics.org/blog/index.php?pk=308516&T=0

Globally Unique Identifier (entire table): ba.freestatistics.org/blog/index.php?pk=308516&T=0

As an alternative you can also use a QR Code:  

The GUIDs for individual cells are displayed in the table below:

Summary of computational transaction
Raw Input view raw input (R code)
Raw Outputview raw output of R engine
Computing time2 seconds
R ServerBig Analytics Cloud Computing Center


Autocorrelation Function
Time lag kACF(k)T-STATP-value
1-0.544989-7.6880
2-0.114899-1.62090.053316
30.3954225.57810
4-0.31232-4.40589e-06
50.0728021.0270.152835
60.2017532.84610.002445
7-0.311067-4.38819e-06
80.1037981.46430.072351
90.201532.84290.002468
10-0.257498-3.63250.000179
110.1478842.08620.01912
12-0.008376-0.11820.45303
13-0.209848-2.96030.001724
140.2643243.72870.000125
15-0.019317-0.27250.392761
16-0.293431-4.13942.6e-05
170.2460043.47030.000319
180.0787051.11030.13411
19-0.291321-4.10962.9e-05
200.2605033.67490.000153
21-0.045179-0.63730.26232
22-0.281563-3.97195e-05
230.4736656.68190
24-0.324731-4.58094e-06
25-0.104306-1.47140.071379
260.3829285.40190
27-0.303793-4.28551.4e-05
280.0318380.44910.326915
290.2210413.11820.001045
30-0.299986-4.23181.8e-05
310.1026211.44770.074644
320.1800792.54030.005919
33-0.252073-3.55590.000235
340.0803511.13350.129187
350.15092.12870.017254
36-0.316569-4.46587e-06
370.3505054.94451e-06
38-0.170011-2.39830.008697
39-0.149484-2.10870.018109
400.2708963.82158.9e-05
41-0.062116-0.87620.190976
42-0.177425-2.50290.006561
430.2153933.03850.001348
44-0.046981-0.66270.25413
45-0.233615-3.29550.000582
460.3857435.44160
47-0.159337-2.24770.012846
48-0.205722-2.90210.002062

\begin{tabular}{lllllllll}
\hline
Autocorrelation Function \tabularnewline
Time lag k & ACF(k) & T-STAT & P-value \tabularnewline
1 & -0.544989 & -7.688 & 0 \tabularnewline
2 & -0.114899 & -1.6209 & 0.053316 \tabularnewline
3 & 0.395422 & 5.5781 & 0 \tabularnewline
4 & -0.31232 & -4.4058 & 9e-06 \tabularnewline
5 & 0.072802 & 1.027 & 0.152835 \tabularnewline
6 & 0.201753 & 2.8461 & 0.002445 \tabularnewline
7 & -0.311067 & -4.3881 & 9e-06 \tabularnewline
8 & 0.103798 & 1.4643 & 0.072351 \tabularnewline
9 & 0.20153 & 2.8429 & 0.002468 \tabularnewline
10 & -0.257498 & -3.6325 & 0.000179 \tabularnewline
11 & 0.147884 & 2.0862 & 0.01912 \tabularnewline
12 & -0.008376 & -0.1182 & 0.45303 \tabularnewline
13 & -0.209848 & -2.9603 & 0.001724 \tabularnewline
14 & 0.264324 & 3.7287 & 0.000125 \tabularnewline
15 & -0.019317 & -0.2725 & 0.392761 \tabularnewline
16 & -0.293431 & -4.1394 & 2.6e-05 \tabularnewline
17 & 0.246004 & 3.4703 & 0.000319 \tabularnewline
18 & 0.078705 & 1.1103 & 0.13411 \tabularnewline
19 & -0.291321 & -4.1096 & 2.9e-05 \tabularnewline
20 & 0.260503 & 3.6749 & 0.000153 \tabularnewline
21 & -0.045179 & -0.6373 & 0.26232 \tabularnewline
22 & -0.281563 & -3.9719 & 5e-05 \tabularnewline
23 & 0.473665 & 6.6819 & 0 \tabularnewline
24 & -0.324731 & -4.5809 & 4e-06 \tabularnewline
25 & -0.104306 & -1.4714 & 0.071379 \tabularnewline
26 & 0.382928 & 5.4019 & 0 \tabularnewline
27 & -0.303793 & -4.2855 & 1.4e-05 \tabularnewline
28 & 0.031838 & 0.4491 & 0.326915 \tabularnewline
29 & 0.221041 & 3.1182 & 0.001045 \tabularnewline
30 & -0.299986 & -4.2318 & 1.8e-05 \tabularnewline
31 & 0.102621 & 1.4477 & 0.074644 \tabularnewline
32 & 0.180079 & 2.5403 & 0.005919 \tabularnewline
33 & -0.252073 & -3.5559 & 0.000235 \tabularnewline
34 & 0.080351 & 1.1335 & 0.129187 \tabularnewline
35 & 0.1509 & 2.1287 & 0.017254 \tabularnewline
36 & -0.316569 & -4.4658 & 7e-06 \tabularnewline
37 & 0.350505 & 4.9445 & 1e-06 \tabularnewline
38 & -0.170011 & -2.3983 & 0.008697 \tabularnewline
39 & -0.149484 & -2.1087 & 0.018109 \tabularnewline
40 & 0.270896 & 3.8215 & 8.9e-05 \tabularnewline
41 & -0.062116 & -0.8762 & 0.190976 \tabularnewline
42 & -0.177425 & -2.5029 & 0.006561 \tabularnewline
43 & 0.215393 & 3.0385 & 0.001348 \tabularnewline
44 & -0.046981 & -0.6627 & 0.25413 \tabularnewline
45 & -0.233615 & -3.2955 & 0.000582 \tabularnewline
46 & 0.385743 & 5.4416 & 0 \tabularnewline
47 & -0.159337 & -2.2477 & 0.012846 \tabularnewline
48 & -0.205722 & -2.9021 & 0.002062 \tabularnewline
\hline
\end{tabular}
%Source: https://freestatistics.org/blog/index.php?pk=308516&T=1

[TABLE]
[ROW][C]Autocorrelation Function[/C][/ROW]
[ROW][C]Time lag k[/C][C]ACF(k)[/C][C]T-STAT[/C][C]P-value[/C][/ROW]
[ROW][C]1[/C][C]-0.544989[/C][C]-7.688[/C][C]0[/C][/ROW]
[ROW][C]2[/C][C]-0.114899[/C][C]-1.6209[/C][C]0.053316[/C][/ROW]
[ROW][C]3[/C][C]0.395422[/C][C]5.5781[/C][C]0[/C][/ROW]
[ROW][C]4[/C][C]-0.31232[/C][C]-4.4058[/C][C]9e-06[/C][/ROW]
[ROW][C]5[/C][C]0.072802[/C][C]1.027[/C][C]0.152835[/C][/ROW]
[ROW][C]6[/C][C]0.201753[/C][C]2.8461[/C][C]0.002445[/C][/ROW]
[ROW][C]7[/C][C]-0.311067[/C][C]-4.3881[/C][C]9e-06[/C][/ROW]
[ROW][C]8[/C][C]0.103798[/C][C]1.4643[/C][C]0.072351[/C][/ROW]
[ROW][C]9[/C][C]0.20153[/C][C]2.8429[/C][C]0.002468[/C][/ROW]
[ROW][C]10[/C][C]-0.257498[/C][C]-3.6325[/C][C]0.000179[/C][/ROW]
[ROW][C]11[/C][C]0.147884[/C][C]2.0862[/C][C]0.01912[/C][/ROW]
[ROW][C]12[/C][C]-0.008376[/C][C]-0.1182[/C][C]0.45303[/C][/ROW]
[ROW][C]13[/C][C]-0.209848[/C][C]-2.9603[/C][C]0.001724[/C][/ROW]
[ROW][C]14[/C][C]0.264324[/C][C]3.7287[/C][C]0.000125[/C][/ROW]
[ROW][C]15[/C][C]-0.019317[/C][C]-0.2725[/C][C]0.392761[/C][/ROW]
[ROW][C]16[/C][C]-0.293431[/C][C]-4.1394[/C][C]2.6e-05[/C][/ROW]
[ROW][C]17[/C][C]0.246004[/C][C]3.4703[/C][C]0.000319[/C][/ROW]
[ROW][C]18[/C][C]0.078705[/C][C]1.1103[/C][C]0.13411[/C][/ROW]
[ROW][C]19[/C][C]-0.291321[/C][C]-4.1096[/C][C]2.9e-05[/C][/ROW]
[ROW][C]20[/C][C]0.260503[/C][C]3.6749[/C][C]0.000153[/C][/ROW]
[ROW][C]21[/C][C]-0.045179[/C][C]-0.6373[/C][C]0.26232[/C][/ROW]
[ROW][C]22[/C][C]-0.281563[/C][C]-3.9719[/C][C]5e-05[/C][/ROW]
[ROW][C]23[/C][C]0.473665[/C][C]6.6819[/C][C]0[/C][/ROW]
[ROW][C]24[/C][C]-0.324731[/C][C]-4.5809[/C][C]4e-06[/C][/ROW]
[ROW][C]25[/C][C]-0.104306[/C][C]-1.4714[/C][C]0.071379[/C][/ROW]
[ROW][C]26[/C][C]0.382928[/C][C]5.4019[/C][C]0[/C][/ROW]
[ROW][C]27[/C][C]-0.303793[/C][C]-4.2855[/C][C]1.4e-05[/C][/ROW]
[ROW][C]28[/C][C]0.031838[/C][C]0.4491[/C][C]0.326915[/C][/ROW]
[ROW][C]29[/C][C]0.221041[/C][C]3.1182[/C][C]0.001045[/C][/ROW]
[ROW][C]30[/C][C]-0.299986[/C][C]-4.2318[/C][C]1.8e-05[/C][/ROW]
[ROW][C]31[/C][C]0.102621[/C][C]1.4477[/C][C]0.074644[/C][/ROW]
[ROW][C]32[/C][C]0.180079[/C][C]2.5403[/C][C]0.005919[/C][/ROW]
[ROW][C]33[/C][C]-0.252073[/C][C]-3.5559[/C][C]0.000235[/C][/ROW]
[ROW][C]34[/C][C]0.080351[/C][C]1.1335[/C][C]0.129187[/C][/ROW]
[ROW][C]35[/C][C]0.1509[/C][C]2.1287[/C][C]0.017254[/C][/ROW]
[ROW][C]36[/C][C]-0.316569[/C][C]-4.4658[/C][C]7e-06[/C][/ROW]
[ROW][C]37[/C][C]0.350505[/C][C]4.9445[/C][C]1e-06[/C][/ROW]
[ROW][C]38[/C][C]-0.170011[/C][C]-2.3983[/C][C]0.008697[/C][/ROW]
[ROW][C]39[/C][C]-0.149484[/C][C]-2.1087[/C][C]0.018109[/C][/ROW]
[ROW][C]40[/C][C]0.270896[/C][C]3.8215[/C][C]8.9e-05[/C][/ROW]
[ROW][C]41[/C][C]-0.062116[/C][C]-0.8762[/C][C]0.190976[/C][/ROW]
[ROW][C]42[/C][C]-0.177425[/C][C]-2.5029[/C][C]0.006561[/C][/ROW]
[ROW][C]43[/C][C]0.215393[/C][C]3.0385[/C][C]0.001348[/C][/ROW]
[ROW][C]44[/C][C]-0.046981[/C][C]-0.6627[/C][C]0.25413[/C][/ROW]
[ROW][C]45[/C][C]-0.233615[/C][C]-3.2955[/C][C]0.000582[/C][/ROW]
[ROW][C]46[/C][C]0.385743[/C][C]5.4416[/C][C]0[/C][/ROW]
[ROW][C]47[/C][C]-0.159337[/C][C]-2.2477[/C][C]0.012846[/C][/ROW]
[ROW][C]48[/C][C]-0.205722[/C][C]-2.9021[/C][C]0.002062[/C][/ROW]
[/TABLE]
Source: https://freestatistics.org/blog/index.php?pk=308516&T=1

Globally Unique Identifier (entire table): ba.freestatistics.org/blog/index.php?pk=308516&T=1

As an alternative you can also use a QR Code:  

The GUIDs for individual cells are displayed in the table below:

Autocorrelation Function
Time lag kACF(k)T-STATP-value
1-0.544989-7.6880
2-0.114899-1.62090.053316
30.3954225.57810
4-0.31232-4.40589e-06
50.0728021.0270.152835
60.2017532.84610.002445
7-0.311067-4.38819e-06
80.1037981.46430.072351
90.201532.84290.002468
10-0.257498-3.63250.000179
110.1478842.08620.01912
12-0.008376-0.11820.45303
13-0.209848-2.96030.001724
140.2643243.72870.000125
15-0.019317-0.27250.392761
16-0.293431-4.13942.6e-05
170.2460043.47030.000319
180.0787051.11030.13411
19-0.291321-4.10962.9e-05
200.2605033.67490.000153
21-0.045179-0.63730.26232
22-0.281563-3.97195e-05
230.4736656.68190
24-0.324731-4.58094e-06
25-0.104306-1.47140.071379
260.3829285.40190
27-0.303793-4.28551.4e-05
280.0318380.44910.326915
290.2210413.11820.001045
30-0.299986-4.23181.8e-05
310.1026211.44770.074644
320.1800792.54030.005919
33-0.252073-3.55590.000235
340.0803511.13350.129187
350.15092.12870.017254
36-0.316569-4.46587e-06
370.3505054.94451e-06
38-0.170011-2.39830.008697
39-0.149484-2.10870.018109
400.2708963.82158.9e-05
41-0.062116-0.87620.190976
42-0.177425-2.50290.006561
430.2153933.03850.001348
44-0.046981-0.66270.25413
45-0.233615-3.29550.000582
460.3857435.44160
47-0.159337-2.24770.012846
48-0.205722-2.90210.002062


Partial Autocorrelation Function
Time lag kPACF(k)T-STATP-value
1-0.544989-7.6880
2-0.585945-8.26580
3-0.050304-0.70960.239384
4-0.127326-1.79610.036994
5-0.035362-0.49880.309219
60.180022.53950.005933
7-0.008023-0.11320.454999
8-0.155743-2.1970.014586
90.0529010.74630.228196
100.0726771.02520.153249
110.1588622.2410.013064
120.0344740.48630.313642
13-0.234869-3.31320.000548
14-0.172526-2.43380.007913
150.081151.14480.126842
16-0.101415-1.43060.077051
17-0.20657-2.9140.001988
180.0988841.39490.082296
19-0.022597-0.31880.37512
20-0.034204-0.48250.314988
210.1295541.82760.034555
22-0.142916-2.01610.022568
230.1478662.08590.019131
24-0.069313-0.97780.164684
25-0.231144-3.26070.000654
26-0.03945-0.55650.289244
270.0331990.46830.320031
28-0.074045-1.04450.148753
29-0.079879-1.12680.130586
300.0159320.22470.411205
31-0.056768-0.80080.212097
32-0.102946-1.45220.074005
330.1019471.43810.075982
340.0207230.29230.385169
350.1205541.70060.045288
36-0.244522-3.44940.000343
370.065390.92240.17871
38-0.119266-1.68240.047025
39-0.06274-0.88510.188598
40-0.130317-1.83830.033751
410.0055290.0780.468955
420.0885231.24880.106609
43-0.016108-0.22720.410241
44-0.003215-0.04540.481937
45-0.116464-1.64290.050989
46-0.006879-0.0970.461397
470.272163.83938.3e-05
48-0.016506-0.23280.408062

\begin{tabular}{lllllllll}
\hline
Partial Autocorrelation Function \tabularnewline
Time lag k & PACF(k) & T-STAT & P-value \tabularnewline
1 & -0.544989 & -7.688 & 0 \tabularnewline
2 & -0.585945 & -8.2658 & 0 \tabularnewline
3 & -0.050304 & -0.7096 & 0.239384 \tabularnewline
4 & -0.127326 & -1.7961 & 0.036994 \tabularnewline
5 & -0.035362 & -0.4988 & 0.309219 \tabularnewline
6 & 0.18002 & 2.5395 & 0.005933 \tabularnewline
7 & -0.008023 & -0.1132 & 0.454999 \tabularnewline
8 & -0.155743 & -2.197 & 0.014586 \tabularnewline
9 & 0.052901 & 0.7463 & 0.228196 \tabularnewline
10 & 0.072677 & 1.0252 & 0.153249 \tabularnewline
11 & 0.158862 & 2.241 & 0.013064 \tabularnewline
12 & 0.034474 & 0.4863 & 0.313642 \tabularnewline
13 & -0.234869 & -3.3132 & 0.000548 \tabularnewline
14 & -0.172526 & -2.4338 & 0.007913 \tabularnewline
15 & 0.08115 & 1.1448 & 0.126842 \tabularnewline
16 & -0.101415 & -1.4306 & 0.077051 \tabularnewline
17 & -0.20657 & -2.914 & 0.001988 \tabularnewline
18 & 0.098884 & 1.3949 & 0.082296 \tabularnewline
19 & -0.022597 & -0.3188 & 0.37512 \tabularnewline
20 & -0.034204 & -0.4825 & 0.314988 \tabularnewline
21 & 0.129554 & 1.8276 & 0.034555 \tabularnewline
22 & -0.142916 & -2.0161 & 0.022568 \tabularnewline
23 & 0.147866 & 2.0859 & 0.019131 \tabularnewline
24 & -0.069313 & -0.9778 & 0.164684 \tabularnewline
25 & -0.231144 & -3.2607 & 0.000654 \tabularnewline
26 & -0.03945 & -0.5565 & 0.289244 \tabularnewline
27 & 0.033199 & 0.4683 & 0.320031 \tabularnewline
28 & -0.074045 & -1.0445 & 0.148753 \tabularnewline
29 & -0.079879 & -1.1268 & 0.130586 \tabularnewline
30 & 0.015932 & 0.2247 & 0.411205 \tabularnewline
31 & -0.056768 & -0.8008 & 0.212097 \tabularnewline
32 & -0.102946 & -1.4522 & 0.074005 \tabularnewline
33 & 0.101947 & 1.4381 & 0.075982 \tabularnewline
34 & 0.020723 & 0.2923 & 0.385169 \tabularnewline
35 & 0.120554 & 1.7006 & 0.045288 \tabularnewline
36 & -0.244522 & -3.4494 & 0.000343 \tabularnewline
37 & 0.06539 & 0.9224 & 0.17871 \tabularnewline
38 & -0.119266 & -1.6824 & 0.047025 \tabularnewline
39 & -0.06274 & -0.8851 & 0.188598 \tabularnewline
40 & -0.130317 & -1.8383 & 0.033751 \tabularnewline
41 & 0.005529 & 0.078 & 0.468955 \tabularnewline
42 & 0.088523 & 1.2488 & 0.106609 \tabularnewline
43 & -0.016108 & -0.2272 & 0.410241 \tabularnewline
44 & -0.003215 & -0.0454 & 0.481937 \tabularnewline
45 & -0.116464 & -1.6429 & 0.050989 \tabularnewline
46 & -0.006879 & -0.097 & 0.461397 \tabularnewline
47 & 0.27216 & 3.8393 & 8.3e-05 \tabularnewline
48 & -0.016506 & -0.2328 & 0.408062 \tabularnewline
\hline
\end{tabular}
%Source: https://freestatistics.org/blog/index.php?pk=308516&T=2

[TABLE]
[ROW][C]Partial Autocorrelation Function[/C][/ROW]
[ROW][C]Time lag k[/C][C]PACF(k)[/C][C]T-STAT[/C][C]P-value[/C][/ROW]
[ROW][C]1[/C][C]-0.544989[/C][C]-7.688[/C][C]0[/C][/ROW]
[ROW][C]2[/C][C]-0.585945[/C][C]-8.2658[/C][C]0[/C][/ROW]
[ROW][C]3[/C][C]-0.050304[/C][C]-0.7096[/C][C]0.239384[/C][/ROW]
[ROW][C]4[/C][C]-0.127326[/C][C]-1.7961[/C][C]0.036994[/C][/ROW]
[ROW][C]5[/C][C]-0.035362[/C][C]-0.4988[/C][C]0.309219[/C][/ROW]
[ROW][C]6[/C][C]0.18002[/C][C]2.5395[/C][C]0.005933[/C][/ROW]
[ROW][C]7[/C][C]-0.008023[/C][C]-0.1132[/C][C]0.454999[/C][/ROW]
[ROW][C]8[/C][C]-0.155743[/C][C]-2.197[/C][C]0.014586[/C][/ROW]
[ROW][C]9[/C][C]0.052901[/C][C]0.7463[/C][C]0.228196[/C][/ROW]
[ROW][C]10[/C][C]0.072677[/C][C]1.0252[/C][C]0.153249[/C][/ROW]
[ROW][C]11[/C][C]0.158862[/C][C]2.241[/C][C]0.013064[/C][/ROW]
[ROW][C]12[/C][C]0.034474[/C][C]0.4863[/C][C]0.313642[/C][/ROW]
[ROW][C]13[/C][C]-0.234869[/C][C]-3.3132[/C][C]0.000548[/C][/ROW]
[ROW][C]14[/C][C]-0.172526[/C][C]-2.4338[/C][C]0.007913[/C][/ROW]
[ROW][C]15[/C][C]0.08115[/C][C]1.1448[/C][C]0.126842[/C][/ROW]
[ROW][C]16[/C][C]-0.101415[/C][C]-1.4306[/C][C]0.077051[/C][/ROW]
[ROW][C]17[/C][C]-0.20657[/C][C]-2.914[/C][C]0.001988[/C][/ROW]
[ROW][C]18[/C][C]0.098884[/C][C]1.3949[/C][C]0.082296[/C][/ROW]
[ROW][C]19[/C][C]-0.022597[/C][C]-0.3188[/C][C]0.37512[/C][/ROW]
[ROW][C]20[/C][C]-0.034204[/C][C]-0.4825[/C][C]0.314988[/C][/ROW]
[ROW][C]21[/C][C]0.129554[/C][C]1.8276[/C][C]0.034555[/C][/ROW]
[ROW][C]22[/C][C]-0.142916[/C][C]-2.0161[/C][C]0.022568[/C][/ROW]
[ROW][C]23[/C][C]0.147866[/C][C]2.0859[/C][C]0.019131[/C][/ROW]
[ROW][C]24[/C][C]-0.069313[/C][C]-0.9778[/C][C]0.164684[/C][/ROW]
[ROW][C]25[/C][C]-0.231144[/C][C]-3.2607[/C][C]0.000654[/C][/ROW]
[ROW][C]26[/C][C]-0.03945[/C][C]-0.5565[/C][C]0.289244[/C][/ROW]
[ROW][C]27[/C][C]0.033199[/C][C]0.4683[/C][C]0.320031[/C][/ROW]
[ROW][C]28[/C][C]-0.074045[/C][C]-1.0445[/C][C]0.148753[/C][/ROW]
[ROW][C]29[/C][C]-0.079879[/C][C]-1.1268[/C][C]0.130586[/C][/ROW]
[ROW][C]30[/C][C]0.015932[/C][C]0.2247[/C][C]0.411205[/C][/ROW]
[ROW][C]31[/C][C]-0.056768[/C][C]-0.8008[/C][C]0.212097[/C][/ROW]
[ROW][C]32[/C][C]-0.102946[/C][C]-1.4522[/C][C]0.074005[/C][/ROW]
[ROW][C]33[/C][C]0.101947[/C][C]1.4381[/C][C]0.075982[/C][/ROW]
[ROW][C]34[/C][C]0.020723[/C][C]0.2923[/C][C]0.385169[/C][/ROW]
[ROW][C]35[/C][C]0.120554[/C][C]1.7006[/C][C]0.045288[/C][/ROW]
[ROW][C]36[/C][C]-0.244522[/C][C]-3.4494[/C][C]0.000343[/C][/ROW]
[ROW][C]37[/C][C]0.06539[/C][C]0.9224[/C][C]0.17871[/C][/ROW]
[ROW][C]38[/C][C]-0.119266[/C][C]-1.6824[/C][C]0.047025[/C][/ROW]
[ROW][C]39[/C][C]-0.06274[/C][C]-0.8851[/C][C]0.188598[/C][/ROW]
[ROW][C]40[/C][C]-0.130317[/C][C]-1.8383[/C][C]0.033751[/C][/ROW]
[ROW][C]41[/C][C]0.005529[/C][C]0.078[/C][C]0.468955[/C][/ROW]
[ROW][C]42[/C][C]0.088523[/C][C]1.2488[/C][C]0.106609[/C][/ROW]
[ROW][C]43[/C][C]-0.016108[/C][C]-0.2272[/C][C]0.410241[/C][/ROW]
[ROW][C]44[/C][C]-0.003215[/C][C]-0.0454[/C][C]0.481937[/C][/ROW]
[ROW][C]45[/C][C]-0.116464[/C][C]-1.6429[/C][C]0.050989[/C][/ROW]
[ROW][C]46[/C][C]-0.006879[/C][C]-0.097[/C][C]0.461397[/C][/ROW]
[ROW][C]47[/C][C]0.27216[/C][C]3.8393[/C][C]8.3e-05[/C][/ROW]
[ROW][C]48[/C][C]-0.016506[/C][C]-0.2328[/C][C]0.408062[/C][/ROW]
[/TABLE]
Source: https://freestatistics.org/blog/index.php?pk=308516&T=2

Globally Unique Identifier (entire table): ba.freestatistics.org/blog/index.php?pk=308516&T=2

As an alternative you can also use a QR Code:  

The GUIDs for individual cells are displayed in the table below:

Partial Autocorrelation Function
Time lag kPACF(k)T-STATP-value
1-0.544989-7.6880
2-0.585945-8.26580
3-0.050304-0.70960.239384
4-0.127326-1.79610.036994
5-0.035362-0.49880.309219
60.180022.53950.005933
7-0.008023-0.11320.454999
8-0.155743-2.1970.014586
90.0529010.74630.228196
100.0726771.02520.153249
110.1588622.2410.013064
120.0344740.48630.313642
13-0.234869-3.31320.000548
14-0.172526-2.43380.007913
150.081151.14480.126842
16-0.101415-1.43060.077051
17-0.20657-2.9140.001988
180.0988841.39490.082296
19-0.022597-0.31880.37512
20-0.034204-0.48250.314988
210.1295541.82760.034555
22-0.142916-2.01610.022568
230.1478662.08590.019131
24-0.069313-0.97780.164684
25-0.231144-3.26070.000654
26-0.03945-0.55650.289244
270.0331990.46830.320031
28-0.074045-1.04450.148753
29-0.079879-1.12680.130586
300.0159320.22470.411205
31-0.056768-0.80080.212097
32-0.102946-1.45220.074005
330.1019471.43810.075982
340.0207230.29230.385169
350.1205541.70060.045288
36-0.244522-3.44940.000343
370.065390.92240.17871
38-0.119266-1.68240.047025
39-0.06274-0.88510.188598
40-0.130317-1.83830.033751
410.0055290.0780.468955
420.0885231.24880.106609
43-0.016108-0.22720.410241
44-0.003215-0.04540.481937
45-0.116464-1.64290.050989
46-0.006879-0.0970.461397
470.272163.83938.3e-05
48-0.016506-0.23280.408062


Parameters (Session):
par1 = 48 ; par2 = 1 ; par3 = 1 ; par4 = 1 ; par5 = 12 ; par6 = White Noise ; par7 = 0.95 ;
Parameters (R input):
par1 = 48 ; par2 = 1 ; par3 = 1 ; par4 = 1 ; par5 = 12 ; par6 = White Noise ; par7 = 0.95 ; par8 = ;
R code (references can be found in the software module):
par8 <- ''
par7 <- '0.95'
par6 <- 'White Noise'
par5 <- '12'
par4 <- '0'
par3 <- '1'
par2 <- '1'
par1 <- 'Default'
if (par1 == 'Default') {
par1 = 10*log10(length(x))
} else {
par1 <- as.numeric(par1)
}
par2 <- as.numeric(par2)
par3 <- as.numeric(par3)
par4 <- as.numeric(par4)
par5 <- as.numeric(par5)
if (par6 == 'White Noise') par6 <- 'white' else par6 <- 'ma'
par7 <- as.numeric(par7)
if (par8 != '') par8 <- as.numeric(par8)
x <- na.omit(x)
ox <- x
if (par8 == '') {
if (par2 == 0) {
x <- log(x)
} else {
x <- (x ^ par2 - 1) / par2
}
} else {
x <- log(x,base=par8)
}
if (par3 > 0) x <- diff(x,lag=1,difference=par3)
if (par4 > 0) x <- diff(x,lag=par5,difference=par4)
bitmap(file='picts.png')
op <- par(mfrow=c(2,1))
plot(ox,type='l',main='Original Time Series',xlab='time',ylab='value')
if (par8=='') {
mytitle <- paste('Working Time Series (lambda=',par2,', d=',par3,', D=',par4,')',sep='')
mysub <- paste('(lambda=',par2,', d=',par3,', D=',par4,', CI=', par7, ', CI type=',par6,')',sep='')
} else {
mytitle <- paste('Working Time Series (base=',par8,', d=',par3,', D=',par4,')',sep='')
mysub <- paste('(base=',par8,', d=',par3,', D=',par4,', CI=', par7, ', CI type=',par6,')',sep='')
}
plot(x,type='l', main=mytitle,xlab='time',ylab='value')
par(op)
dev.off()
bitmap(file='pic1.png')
racf <- acf(x, par1, main='Autocorrelation', xlab='time lag', ylab='ACF', ci.type=par6, ci=par7, sub=mysub)
dev.off()
bitmap(file='pic2.png')
rpacf <- pacf(x,par1,main='Partial Autocorrelation',xlab='lags',ylab='PACF',sub=mysub)
dev.off()
(myacf <- c(racf$acf))
(mypacf <- c(rpacf$acf))
lengthx <- length(x)
sqrtn <- sqrt(lengthx)
load(file='createtable')
a<-table.start()
a<-table.row.start(a)
a<-table.element(a,'Autocorrelation Function',4,TRUE)
a<-table.row.end(a)
a<-table.row.start(a)
a<-table.element(a,'Time lag k',header=TRUE)
a<-table.element(a,'ACF(k)',header=TRUE)
a<-table.element(a,'T-STAT',header=TRUE)
a<-table.element(a,'P-value',header=TRUE)
a<-table.row.end(a)
for (i in 2:(par1+1)) {
a<-table.row.start(a)
a<-table.element(a,i-1,header=TRUE)
a<-table.element(a,round(myacf[i],6))
mytstat <- myacf[i]*sqrtn
a<-table.element(a,round(mytstat,4))
a<-table.element(a,round(1-pt(abs(mytstat),lengthx),6))
a<-table.row.end(a)
}
a<-table.end(a)
table.save(a,file='mytable.tab')
a<-table.start()
a<-table.row.start(a)
a<-table.element(a,'Partial Autocorrelation Function',4,TRUE)
a<-table.row.end(a)
a<-table.row.start(a)
a<-table.element(a,'Time lag k',header=TRUE)
a<-table.element(a,'PACF(k)',header=TRUE)
a<-table.element(a,'T-STAT',header=TRUE)
a<-table.element(a,'P-value',header=TRUE)
a<-table.row.end(a)
for (i in 1:par1) {
a<-table.row.start(a)
a<-table.element(a,i,header=TRUE)
a<-table.element(a,round(mypacf[i],6))
mytstat <- mypacf[i]*sqrtn
a<-table.element(a,round(mytstat,4))
a<-table.element(a,round(1-pt(abs(mytstat),lengthx),6))
a<-table.row.end(a)
}
a<-table.end(a)
table.save(a,file='mytable1.tab')