Free Statistics

of Irreproducible Research!

Author's title

Author*The author of this computation has been verified*
R Software Modulerwasp_autocorrelation.wasp
Title produced by software(Partial) Autocorrelation Function
Date of computationMon, 04 Dec 2017 14:53:29 +0100
Cite this page as followsStatistical Computations at FreeStatistics.org, Office for Research Development and Education, URL https://freestatistics.org/blog/index.php?v=date/2017/Dec/04/t1512395742p3bxbhh74agfd07.htm/, Retrieved Mon, 13 May 2024 23:05:43 +0000
Statistical Computations at FreeStatistics.org, Office for Research Development and Education, URL https://freestatistics.org/blog/index.php?pk=308510, Retrieved Mon, 13 May 2024 23:05:43 +0000
QR Codes:

Original text written by user:
IsPrivate?No (this computation is public)
User-defined keywords
Estimated Impact77
Family? (F = Feedback message, R = changed R code, M = changed R Module, P = changed Parameters, D = changed Data)
-       [(Partial) Autocorrelation Function] [] [2017-12-04 13:53:29] [8329b9b38c877eb1bcf8703660df8d0b] [Current]
Feedback Forum

Post a new message
Dataseries X:
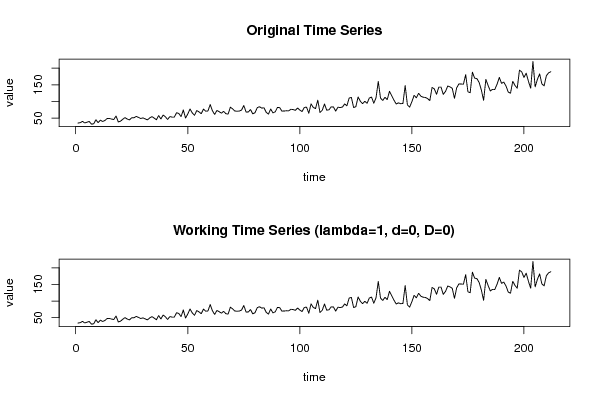
35
36.1
40.1
35.4
37.4
39.9
32
32.6
44.9
36.3
43.7
39.8
42.6
48.6
49.1
46.9
45.7
56.1
38.3
40.6
46.5
51.4
47
44.6
51
51.1
54.9
52.1
48.7
50.5
47.5
44.6
50.3
54.3
50
44.8
57.6
47.2
59.1
53.9
45.7
54.5
52.8
52.9
66
63.7
54.4
74.4
50.1
62.5
77.2
65.6
58.2
72.6
68.6
63.1
76.9
70.6
71.4
90.6
71.9
60.9
72.9
69.2
64.8
70.2
63
62.2
82.8
77.6
71.2
70.6
71.1
74
87.9
68.3
68.1
75.7
62.7
66.2
81.3
84
80
80.8
67.3
61.9
77.2
65.6
68.7
82
81.4
70.9
71.2
71.9
71.6
76.4
75.6
73.2
80.2
74
69.5
82
82.8
64.5
92.6
82
78.4
103.8
66.6
73.3
92.3
73.6
74.9
83.6
83.3
70.9
82.5
81.7
83.1
92.4
86.9
110.1
112.1
81.5
84.3
113.5
100.3
93.2
100.4
94.4
110.2
113
94.6
111
160.1
110.1
102.8
112.4
105.4
130.4
117.2
103.9
92.2
95.8
93.1
93.9
147.6
89.6
83
99.2
118.3
110.9
124.4
115.8
112.7
111.9
108.6
102.5
141.9
137.7
121.3
142.8
143
121.1
130.2
146.3
143.7
139.3
109.3
141.3
152.7
152.2
151.8
180.5
129
126.1
187.9
170
168.4
157.1
133.9
103.1
166.3
148
131.4
136.3
135.8
151.8
172.2
154.4
158
146.2
128
124.7
160.3
148.1
139.7
194
188.7
172.2
184.8
160.5
139.7
219.8
143.9
166.2
182.7
152.7
146.8
177.1
186
189.2


Summary of computational transaction
Raw Input view raw input (R code)
Raw Outputview raw output of R engine
Computing time2 seconds
R ServerBig Analytics Cloud Computing Center

\begin{tabular}{lllllllll}
\hline
Summary of computational transaction \tabularnewline
Raw Input view raw input (R code)  \tabularnewline
Raw Outputview raw output of R engine  \tabularnewline
Computing time2 seconds \tabularnewline
R ServerBig Analytics Cloud Computing Center \tabularnewline
\hline
\end{tabular}
%Source: https://freestatistics.org/blog/index.php?pk=308510&T=0

[TABLE]
[ROW]
Summary of computational transaction[/C][/ROW] [ROW]Raw Input[/C] view raw input (R code) [/C][/ROW] [ROW]Raw Output[/C]view raw output of R engine [/C][/ROW] [ROW]Computing time[/C]2 seconds[/C][/ROW] [ROW]R Server[/C]Big Analytics Cloud Computing Center[/C][/ROW] [/TABLE] Source: https://freestatistics.org/blog/index.php?pk=308510&T=0

Globally Unique Identifier (entire table): ba.freestatistics.org/blog/index.php?pk=308510&T=0

As an alternative you can also use a QR Code:  

The GUIDs for individual cells are displayed in the table below:

Summary of computational transaction
Raw Input view raw input (R code)
Raw Outputview raw output of R engine
Computing time2 seconds
R ServerBig Analytics Cloud Computing Center


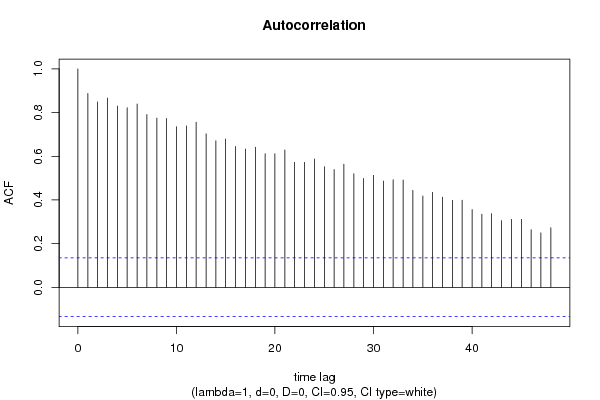
Autocorrelation Function
Time lag kACF(k)T-STATP-value
10.887212.91780
20.84832612.35180
30.86630212.61350
40.82981112.08220
50.82242611.97470
60.83936112.22130
70.79070611.51290
80.77489811.28270
90.77339411.26080
100.73564910.71120
110.73858610.7540
120.75575511.0040
130.70253210.2290
140.6705439.76330
150.6795559.89450
160.644999.39120
170.6329249.21550
180.6412529.33680
190.6112858.90040
200.6114738.90320
210.6290789.15950
220.5721448.33050
230.5719668.32790
240.5876738.55660
250.55248.04310
260.539067.84880
270.5632158.20050
280.5200317.57180
290.4982637.25480
300.5126467.46420
310.4862757.08030
320.4927917.17520
330.4913387.1540
340.4436836.46010
350.4181986.08910
360.4347156.32950
370.4126076.00760
380.3979295.79390
390.3989425.80870
400.3556355.17810
410.3346684.87281e-06
420.3371744.90931e-06
430.3052574.44467e-06
440.3108834.52655e-06
450.3111014.52975e-06
460.2637473.84028.1e-05
470.2490633.62640.00018
480.2728653.9734.9e-05

\begin{tabular}{lllllllll}
\hline
Autocorrelation Function \tabularnewline
Time lag k & ACF(k) & T-STAT & P-value \tabularnewline
1 & 0.8872 & 12.9178 & 0 \tabularnewline
2 & 0.848326 & 12.3518 & 0 \tabularnewline
3 & 0.866302 & 12.6135 & 0 \tabularnewline
4 & 0.829811 & 12.0822 & 0 \tabularnewline
5 & 0.822426 & 11.9747 & 0 \tabularnewline
6 & 0.839361 & 12.2213 & 0 \tabularnewline
7 & 0.790706 & 11.5129 & 0 \tabularnewline
8 & 0.774898 & 11.2827 & 0 \tabularnewline
9 & 0.773394 & 11.2608 & 0 \tabularnewline
10 & 0.735649 & 10.7112 & 0 \tabularnewline
11 & 0.738586 & 10.754 & 0 \tabularnewline
12 & 0.755755 & 11.004 & 0 \tabularnewline
13 & 0.702532 & 10.229 & 0 \tabularnewline
14 & 0.670543 & 9.7633 & 0 \tabularnewline
15 & 0.679555 & 9.8945 & 0 \tabularnewline
16 & 0.64499 & 9.3912 & 0 \tabularnewline
17 & 0.632924 & 9.2155 & 0 \tabularnewline
18 & 0.641252 & 9.3368 & 0 \tabularnewline
19 & 0.611285 & 8.9004 & 0 \tabularnewline
20 & 0.611473 & 8.9032 & 0 \tabularnewline
21 & 0.629078 & 9.1595 & 0 \tabularnewline
22 & 0.572144 & 8.3305 & 0 \tabularnewline
23 & 0.571966 & 8.3279 & 0 \tabularnewline
24 & 0.587673 & 8.5566 & 0 \tabularnewline
25 & 0.5524 & 8.0431 & 0 \tabularnewline
26 & 0.53906 & 7.8488 & 0 \tabularnewline
27 & 0.563215 & 8.2005 & 0 \tabularnewline
28 & 0.520031 & 7.5718 & 0 \tabularnewline
29 & 0.498263 & 7.2548 & 0 \tabularnewline
30 & 0.512646 & 7.4642 & 0 \tabularnewline
31 & 0.486275 & 7.0803 & 0 \tabularnewline
32 & 0.492791 & 7.1752 & 0 \tabularnewline
33 & 0.491338 & 7.154 & 0 \tabularnewline
34 & 0.443683 & 6.4601 & 0 \tabularnewline
35 & 0.418198 & 6.0891 & 0 \tabularnewline
36 & 0.434715 & 6.3295 & 0 \tabularnewline
37 & 0.412607 & 6.0076 & 0 \tabularnewline
38 & 0.397929 & 5.7939 & 0 \tabularnewline
39 & 0.398942 & 5.8087 & 0 \tabularnewline
40 & 0.355635 & 5.1781 & 0 \tabularnewline
41 & 0.334668 & 4.8728 & 1e-06 \tabularnewline
42 & 0.337174 & 4.9093 & 1e-06 \tabularnewline
43 & 0.305257 & 4.4446 & 7e-06 \tabularnewline
44 & 0.310883 & 4.5265 & 5e-06 \tabularnewline
45 & 0.311101 & 4.5297 & 5e-06 \tabularnewline
46 & 0.263747 & 3.8402 & 8.1e-05 \tabularnewline
47 & 0.249063 & 3.6264 & 0.00018 \tabularnewline
48 & 0.272865 & 3.973 & 4.9e-05 \tabularnewline
\hline
\end{tabular}
%Source: https://freestatistics.org/blog/index.php?pk=308510&T=1

[TABLE]
[ROW][C]Autocorrelation Function[/C][/ROW]
[ROW][C]Time lag k[/C][C]ACF(k)[/C][C]T-STAT[/C][C]P-value[/C][/ROW]
[ROW][C]1[/C][C]0.8872[/C][C]12.9178[/C][C]0[/C][/ROW]
[ROW][C]2[/C][C]0.848326[/C][C]12.3518[/C][C]0[/C][/ROW]
[ROW][C]3[/C][C]0.866302[/C][C]12.6135[/C][C]0[/C][/ROW]
[ROW][C]4[/C][C]0.829811[/C][C]12.0822[/C][C]0[/C][/ROW]
[ROW][C]5[/C][C]0.822426[/C][C]11.9747[/C][C]0[/C][/ROW]
[ROW][C]6[/C][C]0.839361[/C][C]12.2213[/C][C]0[/C][/ROW]
[ROW][C]7[/C][C]0.790706[/C][C]11.5129[/C][C]0[/C][/ROW]
[ROW][C]8[/C][C]0.774898[/C][C]11.2827[/C][C]0[/C][/ROW]
[ROW][C]9[/C][C]0.773394[/C][C]11.2608[/C][C]0[/C][/ROW]
[ROW][C]10[/C][C]0.735649[/C][C]10.7112[/C][C]0[/C][/ROW]
[ROW][C]11[/C][C]0.738586[/C][C]10.754[/C][C]0[/C][/ROW]
[ROW][C]12[/C][C]0.755755[/C][C]11.004[/C][C]0[/C][/ROW]
[ROW][C]13[/C][C]0.702532[/C][C]10.229[/C][C]0[/C][/ROW]
[ROW][C]14[/C][C]0.670543[/C][C]9.7633[/C][C]0[/C][/ROW]
[ROW][C]15[/C][C]0.679555[/C][C]9.8945[/C][C]0[/C][/ROW]
[ROW][C]16[/C][C]0.64499[/C][C]9.3912[/C][C]0[/C][/ROW]
[ROW][C]17[/C][C]0.632924[/C][C]9.2155[/C][C]0[/C][/ROW]
[ROW][C]18[/C][C]0.641252[/C][C]9.3368[/C][C]0[/C][/ROW]
[ROW][C]19[/C][C]0.611285[/C][C]8.9004[/C][C]0[/C][/ROW]
[ROW][C]20[/C][C]0.611473[/C][C]8.9032[/C][C]0[/C][/ROW]
[ROW][C]21[/C][C]0.629078[/C][C]9.1595[/C][C]0[/C][/ROW]
[ROW][C]22[/C][C]0.572144[/C][C]8.3305[/C][C]0[/C][/ROW]
[ROW][C]23[/C][C]0.571966[/C][C]8.3279[/C][C]0[/C][/ROW]
[ROW][C]24[/C][C]0.587673[/C][C]8.5566[/C][C]0[/C][/ROW]
[ROW][C]25[/C][C]0.5524[/C][C]8.0431[/C][C]0[/C][/ROW]
[ROW][C]26[/C][C]0.53906[/C][C]7.8488[/C][C]0[/C][/ROW]
[ROW][C]27[/C][C]0.563215[/C][C]8.2005[/C][C]0[/C][/ROW]
[ROW][C]28[/C][C]0.520031[/C][C]7.5718[/C][C]0[/C][/ROW]
[ROW][C]29[/C][C]0.498263[/C][C]7.2548[/C][C]0[/C][/ROW]
[ROW][C]30[/C][C]0.512646[/C][C]7.4642[/C][C]0[/C][/ROW]
[ROW][C]31[/C][C]0.486275[/C][C]7.0803[/C][C]0[/C][/ROW]
[ROW][C]32[/C][C]0.492791[/C][C]7.1752[/C][C]0[/C][/ROW]
[ROW][C]33[/C][C]0.491338[/C][C]7.154[/C][C]0[/C][/ROW]
[ROW][C]34[/C][C]0.443683[/C][C]6.4601[/C][C]0[/C][/ROW]
[ROW][C]35[/C][C]0.418198[/C][C]6.0891[/C][C]0[/C][/ROW]
[ROW][C]36[/C][C]0.434715[/C][C]6.3295[/C][C]0[/C][/ROW]
[ROW][C]37[/C][C]0.412607[/C][C]6.0076[/C][C]0[/C][/ROW]
[ROW][C]38[/C][C]0.397929[/C][C]5.7939[/C][C]0[/C][/ROW]
[ROW][C]39[/C][C]0.398942[/C][C]5.8087[/C][C]0[/C][/ROW]
[ROW][C]40[/C][C]0.355635[/C][C]5.1781[/C][C]0[/C][/ROW]
[ROW][C]41[/C][C]0.334668[/C][C]4.8728[/C][C]1e-06[/C][/ROW]
[ROW][C]42[/C][C]0.337174[/C][C]4.9093[/C][C]1e-06[/C][/ROW]
[ROW][C]43[/C][C]0.305257[/C][C]4.4446[/C][C]7e-06[/C][/ROW]
[ROW][C]44[/C][C]0.310883[/C][C]4.5265[/C][C]5e-06[/C][/ROW]
[ROW][C]45[/C][C]0.311101[/C][C]4.5297[/C][C]5e-06[/C][/ROW]
[ROW][C]46[/C][C]0.263747[/C][C]3.8402[/C][C]8.1e-05[/C][/ROW]
[ROW][C]47[/C][C]0.249063[/C][C]3.6264[/C][C]0.00018[/C][/ROW]
[ROW][C]48[/C][C]0.272865[/C][C]3.973[/C][C]4.9e-05[/C][/ROW]
[/TABLE]
Source: https://freestatistics.org/blog/index.php?pk=308510&T=1

Globally Unique Identifier (entire table): ba.freestatistics.org/blog/index.php?pk=308510&T=1

As an alternative you can also use a QR Code:  

The GUIDs for individual cells are displayed in the table below:

Autocorrelation Function
Time lag kACF(k)T-STATP-value
10.887212.91780
20.84832612.35180
30.86630212.61350
40.82981112.08220
50.82242611.97470
60.83936112.22130
70.79070611.51290
80.77489811.28270
90.77339411.26080
100.73564910.71120
110.73858610.7540
120.75575511.0040
130.70253210.2290
140.6705439.76330
150.6795559.89450
160.644999.39120
170.6329249.21550
180.6412529.33680
190.6112858.90040
200.6114738.90320
210.6290789.15950
220.5721448.33050
230.5719668.32790
240.5876738.55660
250.55248.04310
260.539067.84880
270.5632158.20050
280.5200317.57180
290.4982637.25480
300.5126467.46420
310.4862757.08030
320.4927917.17520
330.4913387.1540
340.4436836.46010
350.4181986.08910
360.4347156.32950
370.4126076.00760
380.3979295.79390
390.3989425.80870
400.3556355.17810
410.3346684.87281e-06
420.3371744.90931e-06
430.3052574.44467e-06
440.3108834.52655e-06
450.3111014.52975e-06
460.2637473.84028.1e-05
470.2490633.62640.00018
480.2728653.9734.9e-05


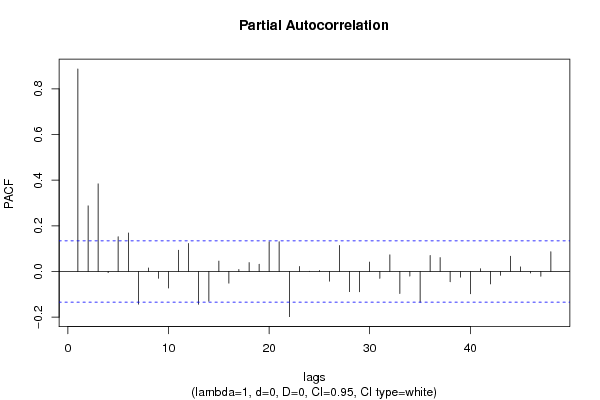
Partial Autocorrelation Function
Time lag kPACF(k)T-STATP-value
10.887212.91780
20.2875024.18612.1e-05
30.3839575.59050
4-0.004913-0.07150.471521
50.1524772.22010.013735
60.1683622.45140.00752
7-0.14308-2.08330.019212
80.015360.22360.411627
9-0.029702-0.43250.332919
10-0.072364-1.05360.146625
110.0927851.3510.089072
120.1230661.79190.03729
13-0.143573-2.09050.018884
14-0.130382-1.89840.029502
150.0455320.6630.25404
16-0.050886-0.74090.229783
170.0087110.12680.449595
180.0389820.56760.285459
190.0318350.46350.321733
200.1300721.89390.029802
210.1300421.89340.029831
22-0.197757-2.87940.002197
230.0220910.32170.374017
240.0004940.00720.497133
250.0042350.06170.475442
26-0.042265-0.61540.26948
270.1140861.66110.049085
28-0.088114-1.2830.100454
29-0.088493-1.28850.099493
300.041140.5990.274905
31-0.029972-0.43640.331496
320.0729671.06240.144629
33-0.096392-1.40350.080967
34-0.020155-0.29350.384726
35-0.134385-1.95670.025849
360.0702061.02220.153921
370.0609470.88740.187933
38-0.044751-0.65160.257686
39-0.024605-0.35830.360255
40-0.097185-1.4150.079263
410.0121020.17620.430147
42-0.0544-0.79210.2146
43-0.016628-0.24210.404464
440.0665060.96830.16699
450.0201370.29320.384826
46-0.006304-0.09180.463479
47-0.020646-0.30060.382005
480.0864881.25930.104656

\begin{tabular}{lllllllll}
\hline
Partial Autocorrelation Function \tabularnewline
Time lag k & PACF(k) & T-STAT & P-value \tabularnewline
1 & 0.8872 & 12.9178 & 0 \tabularnewline
2 & 0.287502 & 4.1861 & 2.1e-05 \tabularnewline
3 & 0.383957 & 5.5905 & 0 \tabularnewline
4 & -0.004913 & -0.0715 & 0.471521 \tabularnewline
5 & 0.152477 & 2.2201 & 0.013735 \tabularnewline
6 & 0.168362 & 2.4514 & 0.00752 \tabularnewline
7 & -0.14308 & -2.0833 & 0.019212 \tabularnewline
8 & 0.01536 & 0.2236 & 0.411627 \tabularnewline
9 & -0.029702 & -0.4325 & 0.332919 \tabularnewline
10 & -0.072364 & -1.0536 & 0.146625 \tabularnewline
11 & 0.092785 & 1.351 & 0.089072 \tabularnewline
12 & 0.123066 & 1.7919 & 0.03729 \tabularnewline
13 & -0.143573 & -2.0905 & 0.018884 \tabularnewline
14 & -0.130382 & -1.8984 & 0.029502 \tabularnewline
15 & 0.045532 & 0.663 & 0.25404 \tabularnewline
16 & -0.050886 & -0.7409 & 0.229783 \tabularnewline
17 & 0.008711 & 0.1268 & 0.449595 \tabularnewline
18 & 0.038982 & 0.5676 & 0.285459 \tabularnewline
19 & 0.031835 & 0.4635 & 0.321733 \tabularnewline
20 & 0.130072 & 1.8939 & 0.029802 \tabularnewline
21 & 0.130042 & 1.8934 & 0.029831 \tabularnewline
22 & -0.197757 & -2.8794 & 0.002197 \tabularnewline
23 & 0.022091 & 0.3217 & 0.374017 \tabularnewline
24 & 0.000494 & 0.0072 & 0.497133 \tabularnewline
25 & 0.004235 & 0.0617 & 0.475442 \tabularnewline
26 & -0.042265 & -0.6154 & 0.26948 \tabularnewline
27 & 0.114086 & 1.6611 & 0.049085 \tabularnewline
28 & -0.088114 & -1.283 & 0.100454 \tabularnewline
29 & -0.088493 & -1.2885 & 0.099493 \tabularnewline
30 & 0.04114 & 0.599 & 0.274905 \tabularnewline
31 & -0.029972 & -0.4364 & 0.331496 \tabularnewline
32 & 0.072967 & 1.0624 & 0.144629 \tabularnewline
33 & -0.096392 & -1.4035 & 0.080967 \tabularnewline
34 & -0.020155 & -0.2935 & 0.384726 \tabularnewline
35 & -0.134385 & -1.9567 & 0.025849 \tabularnewline
36 & 0.070206 & 1.0222 & 0.153921 \tabularnewline
37 & 0.060947 & 0.8874 & 0.187933 \tabularnewline
38 & -0.044751 & -0.6516 & 0.257686 \tabularnewline
39 & -0.024605 & -0.3583 & 0.360255 \tabularnewline
40 & -0.097185 & -1.415 & 0.079263 \tabularnewline
41 & 0.012102 & 0.1762 & 0.430147 \tabularnewline
42 & -0.0544 & -0.7921 & 0.2146 \tabularnewline
43 & -0.016628 & -0.2421 & 0.404464 \tabularnewline
44 & 0.066506 & 0.9683 & 0.16699 \tabularnewline
45 & 0.020137 & 0.2932 & 0.384826 \tabularnewline
46 & -0.006304 & -0.0918 & 0.463479 \tabularnewline
47 & -0.020646 & -0.3006 & 0.382005 \tabularnewline
48 & 0.086488 & 1.2593 & 0.104656 \tabularnewline
\hline
\end{tabular}
%Source: https://freestatistics.org/blog/index.php?pk=308510&T=2

[TABLE]
[ROW][C]Partial Autocorrelation Function[/C][/ROW]
[ROW][C]Time lag k[/C][C]PACF(k)[/C][C]T-STAT[/C][C]P-value[/C][/ROW]
[ROW][C]1[/C][C]0.8872[/C][C]12.9178[/C][C]0[/C][/ROW]
[ROW][C]2[/C][C]0.287502[/C][C]4.1861[/C][C]2.1e-05[/C][/ROW]
[ROW][C]3[/C][C]0.383957[/C][C]5.5905[/C][C]0[/C][/ROW]
[ROW][C]4[/C][C]-0.004913[/C][C]-0.0715[/C][C]0.471521[/C][/ROW]
[ROW][C]5[/C][C]0.152477[/C][C]2.2201[/C][C]0.013735[/C][/ROW]
[ROW][C]6[/C][C]0.168362[/C][C]2.4514[/C][C]0.00752[/C][/ROW]
[ROW][C]7[/C][C]-0.14308[/C][C]-2.0833[/C][C]0.019212[/C][/ROW]
[ROW][C]8[/C][C]0.01536[/C][C]0.2236[/C][C]0.411627[/C][/ROW]
[ROW][C]9[/C][C]-0.029702[/C][C]-0.4325[/C][C]0.332919[/C][/ROW]
[ROW][C]10[/C][C]-0.072364[/C][C]-1.0536[/C][C]0.146625[/C][/ROW]
[ROW][C]11[/C][C]0.092785[/C][C]1.351[/C][C]0.089072[/C][/ROW]
[ROW][C]12[/C][C]0.123066[/C][C]1.7919[/C][C]0.03729[/C][/ROW]
[ROW][C]13[/C][C]-0.143573[/C][C]-2.0905[/C][C]0.018884[/C][/ROW]
[ROW][C]14[/C][C]-0.130382[/C][C]-1.8984[/C][C]0.029502[/C][/ROW]
[ROW][C]15[/C][C]0.045532[/C][C]0.663[/C][C]0.25404[/C][/ROW]
[ROW][C]16[/C][C]-0.050886[/C][C]-0.7409[/C][C]0.229783[/C][/ROW]
[ROW][C]17[/C][C]0.008711[/C][C]0.1268[/C][C]0.449595[/C][/ROW]
[ROW][C]18[/C][C]0.038982[/C][C]0.5676[/C][C]0.285459[/C][/ROW]
[ROW][C]19[/C][C]0.031835[/C][C]0.4635[/C][C]0.321733[/C][/ROW]
[ROW][C]20[/C][C]0.130072[/C][C]1.8939[/C][C]0.029802[/C][/ROW]
[ROW][C]21[/C][C]0.130042[/C][C]1.8934[/C][C]0.029831[/C][/ROW]
[ROW][C]22[/C][C]-0.197757[/C][C]-2.8794[/C][C]0.002197[/C][/ROW]
[ROW][C]23[/C][C]0.022091[/C][C]0.3217[/C][C]0.374017[/C][/ROW]
[ROW][C]24[/C][C]0.000494[/C][C]0.0072[/C][C]0.497133[/C][/ROW]
[ROW][C]25[/C][C]0.004235[/C][C]0.0617[/C][C]0.475442[/C][/ROW]
[ROW][C]26[/C][C]-0.042265[/C][C]-0.6154[/C][C]0.26948[/C][/ROW]
[ROW][C]27[/C][C]0.114086[/C][C]1.6611[/C][C]0.049085[/C][/ROW]
[ROW][C]28[/C][C]-0.088114[/C][C]-1.283[/C][C]0.100454[/C][/ROW]
[ROW][C]29[/C][C]-0.088493[/C][C]-1.2885[/C][C]0.099493[/C][/ROW]
[ROW][C]30[/C][C]0.04114[/C][C]0.599[/C][C]0.274905[/C][/ROW]
[ROW][C]31[/C][C]-0.029972[/C][C]-0.4364[/C][C]0.331496[/C][/ROW]
[ROW][C]32[/C][C]0.072967[/C][C]1.0624[/C][C]0.144629[/C][/ROW]
[ROW][C]33[/C][C]-0.096392[/C][C]-1.4035[/C][C]0.080967[/C][/ROW]
[ROW][C]34[/C][C]-0.020155[/C][C]-0.2935[/C][C]0.384726[/C][/ROW]
[ROW][C]35[/C][C]-0.134385[/C][C]-1.9567[/C][C]0.025849[/C][/ROW]
[ROW][C]36[/C][C]0.070206[/C][C]1.0222[/C][C]0.153921[/C][/ROW]
[ROW][C]37[/C][C]0.060947[/C][C]0.8874[/C][C]0.187933[/C][/ROW]
[ROW][C]38[/C][C]-0.044751[/C][C]-0.6516[/C][C]0.257686[/C][/ROW]
[ROW][C]39[/C][C]-0.024605[/C][C]-0.3583[/C][C]0.360255[/C][/ROW]
[ROW][C]40[/C][C]-0.097185[/C][C]-1.415[/C][C]0.079263[/C][/ROW]
[ROW][C]41[/C][C]0.012102[/C][C]0.1762[/C][C]0.430147[/C][/ROW]
[ROW][C]42[/C][C]-0.0544[/C][C]-0.7921[/C][C]0.2146[/C][/ROW]
[ROW][C]43[/C][C]-0.016628[/C][C]-0.2421[/C][C]0.404464[/C][/ROW]
[ROW][C]44[/C][C]0.066506[/C][C]0.9683[/C][C]0.16699[/C][/ROW]
[ROW][C]45[/C][C]0.020137[/C][C]0.2932[/C][C]0.384826[/C][/ROW]
[ROW][C]46[/C][C]-0.006304[/C][C]-0.0918[/C][C]0.463479[/C][/ROW]
[ROW][C]47[/C][C]-0.020646[/C][C]-0.3006[/C][C]0.382005[/C][/ROW]
[ROW][C]48[/C][C]0.086488[/C][C]1.2593[/C][C]0.104656[/C][/ROW]
[/TABLE]
Source: https://freestatistics.org/blog/index.php?pk=308510&T=2

Globally Unique Identifier (entire table): ba.freestatistics.org/blog/index.php?pk=308510&T=2

As an alternative you can also use a QR Code:  

The GUIDs for individual cells are displayed in the table below:

Partial Autocorrelation Function
Time lag kPACF(k)T-STATP-value
10.887212.91780
20.2875024.18612.1e-05
30.3839575.59050
4-0.004913-0.07150.471521
50.1524772.22010.013735
60.1683622.45140.00752
7-0.14308-2.08330.019212
80.015360.22360.411627
9-0.029702-0.43250.332919
10-0.072364-1.05360.146625
110.0927851.3510.089072
120.1230661.79190.03729
13-0.143573-2.09050.018884
14-0.130382-1.89840.029502
150.0455320.6630.25404
16-0.050886-0.74090.229783
170.0087110.12680.449595
180.0389820.56760.285459
190.0318350.46350.321733
200.1300721.89390.029802
210.1300421.89340.029831
22-0.197757-2.87940.002197
230.0220910.32170.374017
240.0004940.00720.497133
250.0042350.06170.475442
26-0.042265-0.61540.26948
270.1140861.66110.049085
28-0.088114-1.2830.100454
29-0.088493-1.28850.099493
300.041140.5990.274905
31-0.029972-0.43640.331496
320.0729671.06240.144629
33-0.096392-1.40350.080967
34-0.020155-0.29350.384726
35-0.134385-1.95670.025849
360.0702061.02220.153921
370.0609470.88740.187933
38-0.044751-0.65160.257686
39-0.024605-0.35830.360255
40-0.097185-1.4150.079263
410.0121020.17620.430147
42-0.0544-0.79210.2146
43-0.016628-0.24210.404464
440.0665060.96830.16699
450.0201370.29320.384826
46-0.006304-0.09180.463479
47-0.020646-0.30060.382005
480.0864881.25930.104656


Parameters (Session):
par1 = additive ; par2 = 12 ;
Parameters (R input):
par1 = 48 ; par2 = 1 ; par3 = 0 ; par4 = 0 ; par5 = 12 ; par6 = White Noise ; par7 = 0.95 ; par8 = ;
R code (references can be found in the software module):
if (par1 == 'Default') {
par1 = 10*log10(length(x))
} else {
par1 <- as.numeric(par1)
}
par2 <- as.numeric(par2)
par3 <- as.numeric(par3)
par4 <- as.numeric(par4)
par5 <- as.numeric(par5)
if (par6 == 'White Noise') par6 <- 'white' else par6 <- 'ma'
par7 <- as.numeric(par7)
if (par8 != '') par8 <- as.numeric(par8)
x <- na.omit(x)
ox <- x
if (par8 == '') {
if (par2 == 0) {
x <- log(x)
} else {
x <- (x ^ par2 - 1) / par2
}
} else {
x <- log(x,base=par8)
}
if (par3 > 0) x <- diff(x,lag=1,difference=par3)
if (par4 > 0) x <- diff(x,lag=par5,difference=par4)
bitmap(file='picts.png')
op <- par(mfrow=c(2,1))
plot(ox,type='l',main='Original Time Series',xlab='time',ylab='value')
if (par8=='') {
mytitle <- paste('Working Time Series (lambda=',par2,', d=',par3,', D=',par4,')',sep='')
mysub <- paste('(lambda=',par2,', d=',par3,', D=',par4,', CI=', par7, ', CI type=',par6,')',sep='')
} else {
mytitle <- paste('Working Time Series (base=',par8,', d=',par3,', D=',par4,')',sep='')
mysub <- paste('(base=',par8,', d=',par3,', D=',par4,', CI=', par7, ', CI type=',par6,')',sep='')
}
plot(x,type='l', main=mytitle,xlab='time',ylab='value')
par(op)
dev.off()
bitmap(file='pic1.png')
racf <- acf(x, par1, main='Autocorrelation', xlab='time lag', ylab='ACF', ci.type=par6, ci=par7, sub=mysub)
dev.off()
bitmap(file='pic2.png')
rpacf <- pacf(x,par1,main='Partial Autocorrelation',xlab='lags',ylab='PACF',sub=mysub)
dev.off()
(myacf <- c(racf$acf))
(mypacf <- c(rpacf$acf))
lengthx <- length(x)
sqrtn <- sqrt(lengthx)
load(file='createtable')
a<-table.start()
a<-table.row.start(a)
a<-table.element(a,'Autocorrelation Function',4,TRUE)
a<-table.row.end(a)
a<-table.row.start(a)
a<-table.element(a,'Time lag k',header=TRUE)
a<-table.element(a,'ACF(k)',header=TRUE)
a<-table.element(a,'T-STAT',header=TRUE)
a<-table.element(a,'P-value',header=TRUE)
a<-table.row.end(a)
for (i in 2:(par1+1)) {
a<-table.row.start(a)
a<-table.element(a,i-1,header=TRUE)
a<-table.element(a,round(myacf[i],6))
mytstat <- myacf[i]*sqrtn
a<-table.element(a,round(mytstat,4))
a<-table.element(a,round(1-pt(abs(mytstat),lengthx),6))
a<-table.row.end(a)
}
a<-table.end(a)
table.save(a,file='mytable.tab')
a<-table.start()
a<-table.row.start(a)
a<-table.element(a,'Partial Autocorrelation Function',4,TRUE)
a<-table.row.end(a)
a<-table.row.start(a)
a<-table.element(a,'Time lag k',header=TRUE)
a<-table.element(a,'PACF(k)',header=TRUE)
a<-table.element(a,'T-STAT',header=TRUE)
a<-table.element(a,'P-value',header=TRUE)
a<-table.row.end(a)
for (i in 1:par1) {
a<-table.row.start(a)
a<-table.element(a,i,header=TRUE)
a<-table.element(a,round(mypacf[i],6))
mytstat <- mypacf[i]*sqrtn
a<-table.element(a,round(mytstat,4))
a<-table.element(a,round(1-pt(abs(mytstat),lengthx),6))
a<-table.row.end(a)
}
a<-table.end(a)
table.save(a,file='mytable1.tab')