Free Statistics

of Irreproducible Research!

Author's title

Author*Unverified author*
R Software Modulerwasp_smp.wasp
Title produced by softwareStandard Deviation-Mean Plot
Date of computationTue, 15 Aug 2017 23:48:26 +0200
Cite this page as followsStatistical Computations at FreeStatistics.org, Office for Research Development and Education, URL https://freestatistics.org/blog/index.php?v=date/2017/Aug/15/t1502833729r9mt6j9gr99s2fx.htm/, Retrieved Mon, 20 May 2024 02:22:11 +0000
Statistical Computations at FreeStatistics.org, Office for Research Development and Education, URL https://freestatistics.org/blog/index.php?pk=307341, Retrieved Mon, 20 May 2024 02:22:11 +0000
QR Codes:

Original text written by user:
IsPrivate?No (this computation is public)
User-defined keywords
Estimated Impact53
Family? (F = Feedback message, R = changed R code, M = changed R Module, P = changed Parameters, D = changed Data)
-       [Standard Deviation-Mean Plot] [] [2017-08-15 21:48:26] [b4406e95441bfa154caa3f19e1e15192] [Current]
Feedback Forum

Post a new message
Dataseries X:
1684800
1622400
1716000
1372800
1778400
1747200
1872000
1934400
2152800
1872000
1778400
2215200
1872000
1404000
1653600
1248000
1747200
1435200
1903200
1716000
1809600
2028000
1996800
2371200
1716000
1435200
1591200
1154400
1653600
1279200
1809600
1716000
1528800
2184000
1965600
2246400
1684800
1560000
1404000
1154400
1528800
1372800
1872000
1809600
1560000
2090400
1934400
2496000
1996800
1216800
1216800
1216800
1435200
1435200
1934400
1778400
1591200
1996800
1840800
2652000
2090400
1216800
1279200
1060800
1466400
1684800
2121600
2090400
1684800
1965600
1747200
2496000
1903200
1528800
1372800
1029600
1528800
1840800
2152800
2028000
1497600
2152800
1684800
2589600
2152800
1560000
1435200
967200
1528800
1466400
2215200
2215200
1684800
2184000
1622400
2527200
2152800
1591200
1216800
842400
1653600
1591200
2090400
2402400
1778400
1996800
1497600
2589600


Summary of computational transaction
Raw Input view raw input (R code)
Raw Outputview raw output of R engine
Computing time1 seconds
R ServerBig Analytics Cloud Computing Center

\begin{tabular}{lllllllll}
\hline
Summary of computational transaction \tabularnewline
Raw Input view raw input (R code)  \tabularnewline
Raw Outputview raw output of R engine  \tabularnewline
Computing time1 seconds \tabularnewline
R ServerBig Analytics Cloud Computing Center \tabularnewline
\hline
\end{tabular}
%Source: https://freestatistics.org/blog/index.php?pk=307341&T=0

[TABLE]
[ROW]
Summary of computational transaction[/C][/ROW] [ROW]Raw Input[/C] view raw input (R code) [/C][/ROW] [ROW]Raw Output[/C]view raw output of R engine [/C][/ROW] [ROW]Computing time[/C]1 seconds[/C][/ROW] [ROW]R Server[/C]Big Analytics Cloud Computing Center[/C][/ROW] [/TABLE] Source: https://freestatistics.org/blog/index.php?pk=307341&T=0

Globally Unique Identifier (entire table): ba.freestatistics.org/blog/index.php?pk=307341&T=0

As an alternative you can also use a QR Code:  

The GUIDs for individual cells are displayed in the table below:

Summary of computational transaction
Raw Input view raw input (R code)
Raw Outputview raw output of R engine
Computing time1 seconds
R ServerBig Analytics Cloud Computing Center


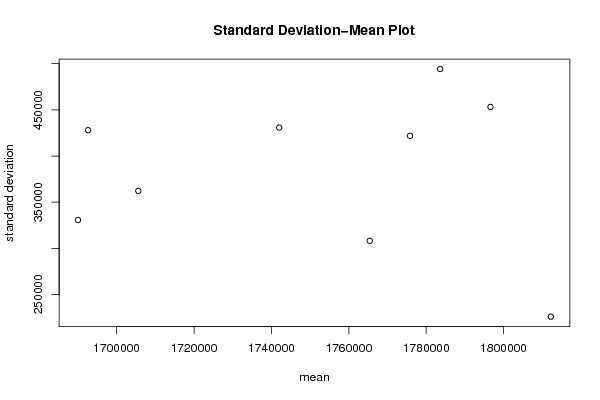
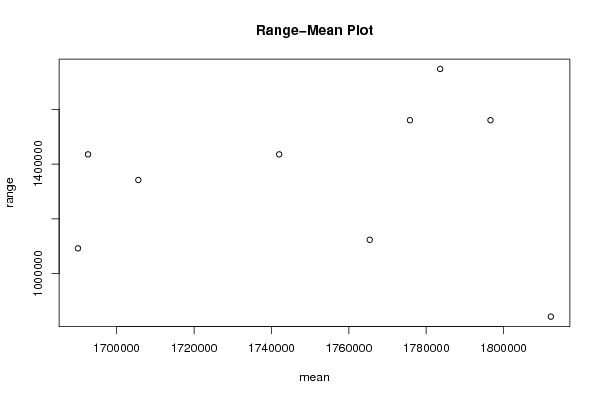
Standard Deviation-Mean Plot
SectionMeanStandard DeviationRange
11812200225951.273910589842400
21765400308135.1533455291123200
31690000330680.7523881611092000
41705600362226.3280426651341600
51692600428025.5047625931435200
61742000430850.3895574641435200
71775800421847.3140410361560000
81796600453198.0422006981560000
91783600494360.6339137821747200

\begin{tabular}{lllllllll}
\hline
Standard Deviation-Mean Plot \tabularnewline
Section & Mean & Standard Deviation & Range \tabularnewline
1 & 1812200 & 225951.273910589 & 842400 \tabularnewline
2 & 1765400 & 308135.153345529 & 1123200 \tabularnewline
3 & 1690000 & 330680.752388161 & 1092000 \tabularnewline
4 & 1705600 & 362226.328042665 & 1341600 \tabularnewline
5 & 1692600 & 428025.504762593 & 1435200 \tabularnewline
6 & 1742000 & 430850.389557464 & 1435200 \tabularnewline
7 & 1775800 & 421847.314041036 & 1560000 \tabularnewline
8 & 1796600 & 453198.042200698 & 1560000 \tabularnewline
9 & 1783600 & 494360.633913782 & 1747200 \tabularnewline
\hline
\end{tabular}
%Source: https://freestatistics.org/blog/index.php?pk=307341&T=1

[TABLE]
[ROW][C]Standard Deviation-Mean Plot[/C][/ROW]
[ROW][C]Section[/C][C]Mean[/C][C]Standard Deviation[/C][C]Range[/C][/ROW]
[ROW][C]1[/C][C]1812200[/C][C]225951.273910589[/C][C]842400[/C][/ROW]
[ROW][C]2[/C][C]1765400[/C][C]308135.153345529[/C][C]1123200[/C][/ROW]
[ROW][C]3[/C][C]1690000[/C][C]330680.752388161[/C][C]1092000[/C][/ROW]
[ROW][C]4[/C][C]1705600[/C][C]362226.328042665[/C][C]1341600[/C][/ROW]
[ROW][C]5[/C][C]1692600[/C][C]428025.504762593[/C][C]1435200[/C][/ROW]
[ROW][C]6[/C][C]1742000[/C][C]430850.389557464[/C][C]1435200[/C][/ROW]
[ROW][C]7[/C][C]1775800[/C][C]421847.314041036[/C][C]1560000[/C][/ROW]
[ROW][C]8[/C][C]1796600[/C][C]453198.042200698[/C][C]1560000[/C][/ROW]
[ROW][C]9[/C][C]1783600[/C][C]494360.633913782[/C][C]1747200[/C][/ROW]
[/TABLE]
Source: https://freestatistics.org/blog/index.php?pk=307341&T=1

Globally Unique Identifier (entire table): ba.freestatistics.org/blog/index.php?pk=307341&T=1

As an alternative you can also use a QR Code:  

The GUIDs for individual cells are displayed in the table below:

Standard Deviation-Mean Plot
SectionMeanStandard DeviationRange
11812200225951.273910589842400
21765400308135.1533455291123200
31690000330680.7523881611092000
41705600362226.3280426651341600
51692600428025.5047625931435200
61742000430850.3895574641435200
71775800421847.3140410361560000
81796600453198.0422006981560000
91783600494360.6339137821747200


Regression: S.E.(k) = alpha + beta * Mean(k)
alpha572118.79695898
beta-0.107448317059865
S.D.0.68875700161761
T-STAT-0.156003230177716
p-value0.88043412050898

\begin{tabular}{lllllllll}
\hline
Regression: S.E.(k) = alpha + beta * Mean(k) \tabularnewline
alpha & 572118.79695898 \tabularnewline
beta & -0.107448317059865 \tabularnewline
S.D. & 0.68875700161761 \tabularnewline
T-STAT & -0.156003230177716 \tabularnewline
p-value & 0.88043412050898 \tabularnewline
\hline
\end{tabular}
%Source: https://freestatistics.org/blog/index.php?pk=307341&T=2

[TABLE]
[ROW][C]Regression: S.E.(k) = alpha + beta * Mean(k)[/C][/ROW]
[ROW][C]alpha[/C][C]572118.79695898[/C][/ROW]
[ROW][C]beta[/C][C]-0.107448317059865[/C][/ROW]
[ROW][C]S.D.[/C][C]0.68875700161761[/C][/ROW]
[ROW][C]T-STAT[/C][C]-0.156003230177716[/C][/ROW]
[ROW][C]p-value[/C][C]0.88043412050898[/C][/ROW]
[/TABLE]
Source: https://freestatistics.org/blog/index.php?pk=307341&T=2

Globally Unique Identifier (entire table): ba.freestatistics.org/blog/index.php?pk=307341&T=2

As an alternative you can also use a QR Code:  

The GUIDs for individual cells are displayed in the table below:

Regression: S.E.(k) = alpha + beta * Mean(k)
alpha572118.79695898
beta-0.107448317059865
S.D.0.68875700161761
T-STAT-0.156003230177716
p-value0.88043412050898


Regression: ln S.E.(k) = alpha + beta * ln Mean(k)
alpha31.4694172069629
beta-1.2963355072815
S.D.3.4558277278626
T-STAT-0.375115778147677
p-value0.718681736243539
Lambda2.2963355072815

\begin{tabular}{lllllllll}
\hline
Regression: ln S.E.(k) = alpha + beta * ln Mean(k) \tabularnewline
alpha & 31.4694172069629 \tabularnewline
beta & -1.2963355072815 \tabularnewline
S.D. & 3.4558277278626 \tabularnewline
T-STAT & -0.375115778147677 \tabularnewline
p-value & 0.718681736243539 \tabularnewline
Lambda & 2.2963355072815 \tabularnewline
\hline
\end{tabular}
%Source: https://freestatistics.org/blog/index.php?pk=307341&T=3

[TABLE]
[ROW][C]Regression: ln S.E.(k) = alpha + beta * ln Mean(k)[/C][/ROW]
[ROW][C]alpha[/C][C]31.4694172069629[/C][/ROW]
[ROW][C]beta[/C][C]-1.2963355072815[/C][/ROW]
[ROW][C]S.D.[/C][C]3.4558277278626[/C][/ROW]
[ROW][C]T-STAT[/C][C]-0.375115778147677[/C][/ROW]
[ROW][C]p-value[/C][C]0.718681736243539[/C][/ROW]
[ROW][C]Lambda[/C][C]2.2963355072815[/C][/ROW]
[/TABLE]
Source: https://freestatistics.org/blog/index.php?pk=307341&T=3

Globally Unique Identifier (entire table): ba.freestatistics.org/blog/index.php?pk=307341&T=3

As an alternative you can also use a QR Code:  

The GUIDs for individual cells are displayed in the table below:

Regression: ln S.E.(k) = alpha + beta * ln Mean(k)
alpha31.4694172069629
beta-1.2963355072815
S.D.3.4558277278626
T-STAT-0.375115778147677
p-value0.718681736243539
Lambda2.2963355072815


Parameters (Session):
Parameters (R input):
par1 = 12 ;
R code (references can be found in the software module):
par1 <- as.numeric(par1)
(n <- length(x))
(np <- floor(n / par1))
arr <- array(NA,dim=c(par1,np))
j <- 0
k <- 1
for (i in 1:(np*par1))
{
j = j + 1
arr[j,k] <- x[i]
if (j == par1) {
j = 0
k=k+1
}
}
arr
arr.mean <- array(NA,dim=np)
arr.sd <- array(NA,dim=np)
arr.range <- array(NA,dim=np)
for (j in 1:np)
{
arr.mean[j] <- mean(arr[,j],na.rm=TRUE)
arr.sd[j] <- sd(arr[,j],na.rm=TRUE)
arr.range[j] <- max(arr[,j],na.rm=TRUE) - min(arr[,j],na.rm=TRUE)
}
arr.mean
arr.sd
arr.range
(lm1 <- lm(arr.sd~arr.mean))
(lnlm1 <- lm(log(arr.sd)~log(arr.mean)))
(lm2 <- lm(arr.range~arr.mean))
bitmap(file='test1.png')
plot(arr.mean,arr.sd,main='Standard Deviation-Mean Plot',xlab='mean',ylab='standard deviation')
dev.off()
bitmap(file='test2.png')
plot(arr.mean,arr.range,main='Range-Mean Plot',xlab='mean',ylab='range')
dev.off()
load(file='createtable')
a<-table.start()
a<-table.row.start(a)
a<-table.element(a,'Standard Deviation-Mean Plot',4,TRUE)
a<-table.row.end(a)
a<-table.row.start(a)
a<-table.element(a,'Section',header=TRUE)
a<-table.element(a,'Mean',header=TRUE)
a<-table.element(a,'Standard Deviation',header=TRUE)
a<-table.element(a,'Range',header=TRUE)
a<-table.row.end(a)
for (j in 1:np) {
a<-table.row.start(a)
a<-table.element(a,j,header=TRUE)
a<-table.element(a,arr.mean[j])
a<-table.element(a,arr.sd[j] )
a<-table.element(a,arr.range[j] )
a<-table.row.end(a)
}
a<-table.end(a)
table.save(a,file='mytable.tab')
a<-table.start()
a<-table.row.start(a)
a<-table.element(a,'Regression: S.E.(k) = alpha + beta * Mean(k)',2,TRUE)
a<-table.row.end(a)
a<-table.row.start(a)
a<-table.element(a,'alpha',header=TRUE)
a<-table.element(a,lm1$coefficients[[1]])
a<-table.row.end(a)
a<-table.row.start(a)
a<-table.element(a,'beta',header=TRUE)
a<-table.element(a,lm1$coefficients[[2]])
a<-table.row.end(a)
a<-table.row.start(a)
a<-table.element(a,'S.D.',header=TRUE)
a<-table.element(a,summary(lm1)$coefficients[2,2])
a<-table.row.end(a)
a<-table.row.start(a)
a<-table.element(a,'T-STAT',header=TRUE)
a<-table.element(a,summary(lm1)$coefficients[2,3])
a<-table.row.end(a)
a<-table.row.start(a)
a<-table.element(a,'p-value',header=TRUE)
a<-table.element(a,summary(lm1)$coefficients[2,4])
a<-table.row.end(a)
a<-table.end(a)
table.save(a,file='mytable1.tab')
a<-table.start()
a<-table.row.start(a)
a<-table.element(a,'Regression: ln S.E.(k) = alpha + beta * ln Mean(k)',2,TRUE)
a<-table.row.end(a)
a<-table.row.start(a)
a<-table.element(a,'alpha',header=TRUE)
a<-table.element(a,lnlm1$coefficients[[1]])
a<-table.row.end(a)
a<-table.row.start(a)
a<-table.element(a,'beta',header=TRUE)
a<-table.element(a,lnlm1$coefficients[[2]])
a<-table.row.end(a)
a<-table.row.start(a)
a<-table.element(a,'S.D.',header=TRUE)
a<-table.element(a,summary(lnlm1)$coefficients[2,2])
a<-table.row.end(a)
a<-table.row.start(a)
a<-table.element(a,'T-STAT',header=TRUE)
a<-table.element(a,summary(lnlm1)$coefficients[2,3])
a<-table.row.end(a)
a<-table.row.start(a)
a<-table.element(a,'p-value',header=TRUE)
a<-table.element(a,summary(lnlm1)$coefficients[2,4])
a<-table.row.end(a)
a<-table.row.start(a)
a<-table.element(a,'Lambda',header=TRUE)
a<-table.element(a,1-lnlm1$coefficients[[2]])
a<-table.row.end(a)
a<-table.end(a)
table.save(a,file='mytable2.tab')