Free Statistics

of Irreproducible Research!

Author's title

Author*Unverified author*
R Software Modulerwasp_autocorrelation.wasp
Title produced by software(Partial) Autocorrelation Function
Date of computationTue, 15 Aug 2017 21:15:15 +0200
Cite this page as followsStatistical Computations at FreeStatistics.org, Office for Research Development and Education, URL https://freestatistics.org/blog/index.php?v=date/2017/Aug/15/t1502824537bkwf33otmv6yh5u.htm/, Retrieved Mon, 20 May 2024 00:08:23 +0000
Statistical Computations at FreeStatistics.org, Office for Research Development and Education, URL https://freestatistics.org/blog/index.php?pk=307312, Retrieved Mon, 20 May 2024 00:08:23 +0000
QR Codes:

Original text written by user:
IsPrivate?No (this computation is public)
User-defined keywords
Estimated Impact67
Family? (F = Feedback message, R = changed R code, M = changed R Module, P = changed Parameters, D = changed Data)
-       [(Partial) Autocorrelation Function] [Aantal verkochte ...] [2017-08-15 19:15:15] [6bb7048e855cced252efb5418d255fa6] [Current]
Feedback Forum

Post a new message
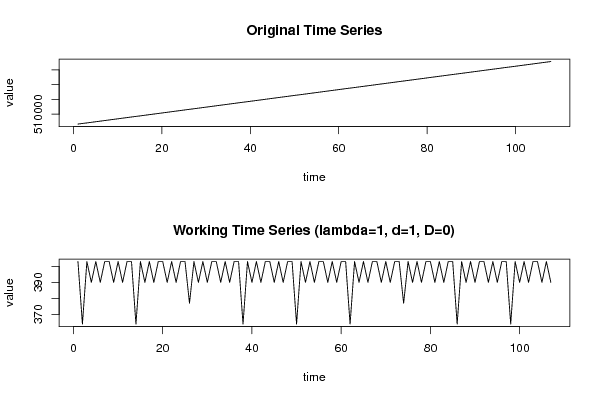
Dataseries X:
503334
503737
504101
504504
504894
505297
505687
506090
506493
506883
507286
507676
508079
508482
508846
509249
509639
510042
510432
510835
511238
511628
512031
512421
512824
513227
513604
514007
514397
514800
515190
515593
515996
516386
516789
517179
517582
517985
518349
518752
519142
519545
519935
520338
520741
521131
521534
521924
522327
522730
523094
523497
523887
524290
524680
525083
525486
525876
526279
526669
527072
527475
527839
528242
528632
529035
529425
529828
530231
530621
531024
531414
531817
532220
532597
533000
533390
533793
534183
534586
534989
535379
535782
536172
536575
536978
537342
537745
538135
538538
538928
539331
539734
540124
540527
540917
541320
541723
542087
542490
542880
543283
543673
544076
544479
544869
545272
545662


Summary of computational transaction
Raw Input view raw input (R code)
Raw Outputview raw output of R engine
Computing time2 seconds
R ServerBig Analytics Cloud Computing Center

\begin{tabular}{lllllllll}
\hline
Summary of computational transaction \tabularnewline
Raw Input view raw input (R code)  \tabularnewline
Raw Outputview raw output of R engine  \tabularnewline
Computing time2 seconds \tabularnewline
R ServerBig Analytics Cloud Computing Center \tabularnewline
\hline
\end{tabular}
%Source: https://freestatistics.org/blog/index.php?pk=307312&T=0

[TABLE]
[ROW]
Summary of computational transaction[/C][/ROW] [ROW]Raw Input[/C] view raw input (R code) [/C][/ROW] [ROW]Raw Output[/C]view raw output of R engine [/C][/ROW] [ROW]Computing time[/C]2 seconds[/C][/ROW] [ROW]R Server[/C]Big Analytics Cloud Computing Center[/C][/ROW] [/TABLE] Source: https://freestatistics.org/blog/index.php?pk=307312&T=0

Globally Unique Identifier (entire table): ba.freestatistics.org/blog/index.php?pk=307312&T=0

As an alternative you can also use a QR Code:  

The GUIDs for individual cells are displayed in the table below:

Summary of computational transaction
Raw Input view raw input (R code)
Raw Outputview raw output of R engine
Computing time2 seconds
R ServerBig Analytics Cloud Computing Center


Autocorrelation Function
Time lag kACF(k)T-STATP-value
1-0.478102-4.94551e-06
20.1364451.41140.080514
3-0.02631-0.27220.393013
4-0.105992-1.09640.137686
50.2079612.15120.016857
6-0.445349-4.60676e-06
70.2424392.50780.006825
8-0.141849-1.46730.072615
90.0138480.14320.443182
100.1022571.05780.146274
11-0.420488-4.34961.6e-05
120.8488218.78030
13-0.421595-4.3611.5e-05
140.1237241.27980.10169
15-0.025186-0.26050.39748
16-0.091021-0.94150.174277
170.1813941.87640.031666
18-0.388841-4.02225.4e-05
190.2158722.2330.013815
20-0.126878-1.31240.09609
210.0149730.15490.438604
220.0895360.92620.178221
23-0.36398-3.7650.000136
240.7253347.50290
25-0.365087-3.77650.000131
260.103111.06660.144282
27-0.018109-0.18730.425883
28-0.083944-0.86830.19358
290.160781.66310.049608
30-0.340227-3.51930.000318
310.1814121.87650.031653
32-0.105955-1.0960.137768
330.0082040.08490.466264
340.0748740.77450.220171
35-0.32326-3.34380.00057
360.6691356.92160
37-0.324366-3.35530.000549
380.0963410.99660.160613
39-0.024877-0.25730.398708
40-0.063021-0.65190.257933
410.1263191.30670.097065
42-0.291612-3.01650.001598
430.1607981.66330.049589
44-0.098878-1.02280.154354
450.0152810.15810.43735
460.0621530.64290.260827
47-0.266752-2.75930.003408
480.5594945.78740

\begin{tabular}{lllllllll}
\hline
Autocorrelation Function \tabularnewline
Time lag k & ACF(k) & T-STAT & P-value \tabularnewline
1 & -0.478102 & -4.9455 & 1e-06 \tabularnewline
2 & 0.136445 & 1.4114 & 0.080514 \tabularnewline
3 & -0.02631 & -0.2722 & 0.393013 \tabularnewline
4 & -0.105992 & -1.0964 & 0.137686 \tabularnewline
5 & 0.207961 & 2.1512 & 0.016857 \tabularnewline
6 & -0.445349 & -4.6067 & 6e-06 \tabularnewline
7 & 0.242439 & 2.5078 & 0.006825 \tabularnewline
8 & -0.141849 & -1.4673 & 0.072615 \tabularnewline
9 & 0.013848 & 0.1432 & 0.443182 \tabularnewline
10 & 0.102257 & 1.0578 & 0.146274 \tabularnewline
11 & -0.420488 & -4.3496 & 1.6e-05 \tabularnewline
12 & 0.848821 & 8.7803 & 0 \tabularnewline
13 & -0.421595 & -4.361 & 1.5e-05 \tabularnewline
14 & 0.123724 & 1.2798 & 0.10169 \tabularnewline
15 & -0.025186 & -0.2605 & 0.39748 \tabularnewline
16 & -0.091021 & -0.9415 & 0.174277 \tabularnewline
17 & 0.181394 & 1.8764 & 0.031666 \tabularnewline
18 & -0.388841 & -4.0222 & 5.4e-05 \tabularnewline
19 & 0.215872 & 2.233 & 0.013815 \tabularnewline
20 & -0.126878 & -1.3124 & 0.09609 \tabularnewline
21 & 0.014973 & 0.1549 & 0.438604 \tabularnewline
22 & 0.089536 & 0.9262 & 0.178221 \tabularnewline
23 & -0.36398 & -3.765 & 0.000136 \tabularnewline
24 & 0.725334 & 7.5029 & 0 \tabularnewline
25 & -0.365087 & -3.7765 & 0.000131 \tabularnewline
26 & 0.10311 & 1.0666 & 0.144282 \tabularnewline
27 & -0.018109 & -0.1873 & 0.425883 \tabularnewline
28 & -0.083944 & -0.8683 & 0.19358 \tabularnewline
29 & 0.16078 & 1.6631 & 0.049608 \tabularnewline
30 & -0.340227 & -3.5193 & 0.000318 \tabularnewline
31 & 0.181412 & 1.8765 & 0.031653 \tabularnewline
32 & -0.105955 & -1.096 & 0.137768 \tabularnewline
33 & 0.008204 & 0.0849 & 0.466264 \tabularnewline
34 & 0.074874 & 0.7745 & 0.220171 \tabularnewline
35 & -0.32326 & -3.3438 & 0.00057 \tabularnewline
36 & 0.669135 & 6.9216 & 0 \tabularnewline
37 & -0.324366 & -3.3553 & 0.000549 \tabularnewline
38 & 0.096341 & 0.9966 & 0.160613 \tabularnewline
39 & -0.024877 & -0.2573 & 0.398708 \tabularnewline
40 & -0.063021 & -0.6519 & 0.257933 \tabularnewline
41 & 0.126319 & 1.3067 & 0.097065 \tabularnewline
42 & -0.291612 & -3.0165 & 0.001598 \tabularnewline
43 & 0.160798 & 1.6633 & 0.049589 \tabularnewline
44 & -0.098878 & -1.0228 & 0.154354 \tabularnewline
45 & 0.015281 & 0.1581 & 0.43735 \tabularnewline
46 & 0.062153 & 0.6429 & 0.260827 \tabularnewline
47 & -0.266752 & -2.7593 & 0.003408 \tabularnewline
48 & 0.559494 & 5.7874 & 0 \tabularnewline
\hline
\end{tabular}
%Source: https://freestatistics.org/blog/index.php?pk=307312&T=1

[TABLE]
[ROW][C]Autocorrelation Function[/C][/ROW]
[ROW][C]Time lag k[/C][C]ACF(k)[/C][C]T-STAT[/C][C]P-value[/C][/ROW]
[ROW][C]1[/C][C]-0.478102[/C][C]-4.9455[/C][C]1e-06[/C][/ROW]
[ROW][C]2[/C][C]0.136445[/C][C]1.4114[/C][C]0.080514[/C][/ROW]
[ROW][C]3[/C][C]-0.02631[/C][C]-0.2722[/C][C]0.393013[/C][/ROW]
[ROW][C]4[/C][C]-0.105992[/C][C]-1.0964[/C][C]0.137686[/C][/ROW]
[ROW][C]5[/C][C]0.207961[/C][C]2.1512[/C][C]0.016857[/C][/ROW]
[ROW][C]6[/C][C]-0.445349[/C][C]-4.6067[/C][C]6e-06[/C][/ROW]
[ROW][C]7[/C][C]0.242439[/C][C]2.5078[/C][C]0.006825[/C][/ROW]
[ROW][C]8[/C][C]-0.141849[/C][C]-1.4673[/C][C]0.072615[/C][/ROW]
[ROW][C]9[/C][C]0.013848[/C][C]0.1432[/C][C]0.443182[/C][/ROW]
[ROW][C]10[/C][C]0.102257[/C][C]1.0578[/C][C]0.146274[/C][/ROW]
[ROW][C]11[/C][C]-0.420488[/C][C]-4.3496[/C][C]1.6e-05[/C][/ROW]
[ROW][C]12[/C][C]0.848821[/C][C]8.7803[/C][C]0[/C][/ROW]
[ROW][C]13[/C][C]-0.421595[/C][C]-4.361[/C][C]1.5e-05[/C][/ROW]
[ROW][C]14[/C][C]0.123724[/C][C]1.2798[/C][C]0.10169[/C][/ROW]
[ROW][C]15[/C][C]-0.025186[/C][C]-0.2605[/C][C]0.39748[/C][/ROW]
[ROW][C]16[/C][C]-0.091021[/C][C]-0.9415[/C][C]0.174277[/C][/ROW]
[ROW][C]17[/C][C]0.181394[/C][C]1.8764[/C][C]0.031666[/C][/ROW]
[ROW][C]18[/C][C]-0.388841[/C][C]-4.0222[/C][C]5.4e-05[/C][/ROW]
[ROW][C]19[/C][C]0.215872[/C][C]2.233[/C][C]0.013815[/C][/ROW]
[ROW][C]20[/C][C]-0.126878[/C][C]-1.3124[/C][C]0.09609[/C][/ROW]
[ROW][C]21[/C][C]0.014973[/C][C]0.1549[/C][C]0.438604[/C][/ROW]
[ROW][C]22[/C][C]0.089536[/C][C]0.9262[/C][C]0.178221[/C][/ROW]
[ROW][C]23[/C][C]-0.36398[/C][C]-3.765[/C][C]0.000136[/C][/ROW]
[ROW][C]24[/C][C]0.725334[/C][C]7.5029[/C][C]0[/C][/ROW]
[ROW][C]25[/C][C]-0.365087[/C][C]-3.7765[/C][C]0.000131[/C][/ROW]
[ROW][C]26[/C][C]0.10311[/C][C]1.0666[/C][C]0.144282[/C][/ROW]
[ROW][C]27[/C][C]-0.018109[/C][C]-0.1873[/C][C]0.425883[/C][/ROW]
[ROW][C]28[/C][C]-0.083944[/C][C]-0.8683[/C][C]0.19358[/C][/ROW]
[ROW][C]29[/C][C]0.16078[/C][C]1.6631[/C][C]0.049608[/C][/ROW]
[ROW][C]30[/C][C]-0.340227[/C][C]-3.5193[/C][C]0.000318[/C][/ROW]
[ROW][C]31[/C][C]0.181412[/C][C]1.8765[/C][C]0.031653[/C][/ROW]
[ROW][C]32[/C][C]-0.105955[/C][C]-1.096[/C][C]0.137768[/C][/ROW]
[ROW][C]33[/C][C]0.008204[/C][C]0.0849[/C][C]0.466264[/C][/ROW]
[ROW][C]34[/C][C]0.074874[/C][C]0.7745[/C][C]0.220171[/C][/ROW]
[ROW][C]35[/C][C]-0.32326[/C][C]-3.3438[/C][C]0.00057[/C][/ROW]
[ROW][C]36[/C][C]0.669135[/C][C]6.9216[/C][C]0[/C][/ROW]
[ROW][C]37[/C][C]-0.324366[/C][C]-3.3553[/C][C]0.000549[/C][/ROW]
[ROW][C]38[/C][C]0.096341[/C][C]0.9966[/C][C]0.160613[/C][/ROW]
[ROW][C]39[/C][C]-0.024877[/C][C]-0.2573[/C][C]0.398708[/C][/ROW]
[ROW][C]40[/C][C]-0.063021[/C][C]-0.6519[/C][C]0.257933[/C][/ROW]
[ROW][C]41[/C][C]0.126319[/C][C]1.3067[/C][C]0.097065[/C][/ROW]
[ROW][C]42[/C][C]-0.291612[/C][C]-3.0165[/C][C]0.001598[/C][/ROW]
[ROW][C]43[/C][C]0.160798[/C][C]1.6633[/C][C]0.049589[/C][/ROW]
[ROW][C]44[/C][C]-0.098878[/C][C]-1.0228[/C][C]0.154354[/C][/ROW]
[ROW][C]45[/C][C]0.015281[/C][C]0.1581[/C][C]0.43735[/C][/ROW]
[ROW][C]46[/C][C]0.062153[/C][C]0.6429[/C][C]0.260827[/C][/ROW]
[ROW][C]47[/C][C]-0.266752[/C][C]-2.7593[/C][C]0.003408[/C][/ROW]
[ROW][C]48[/C][C]0.559494[/C][C]5.7874[/C][C]0[/C][/ROW]
[/TABLE]
Source: https://freestatistics.org/blog/index.php?pk=307312&T=1

Globally Unique Identifier (entire table): ba.freestatistics.org/blog/index.php?pk=307312&T=1

As an alternative you can also use a QR Code:  

The GUIDs for individual cells are displayed in the table below:

Autocorrelation Function
Time lag kACF(k)T-STATP-value
1-0.478102-4.94551e-06
20.1364451.41140.080514
3-0.02631-0.27220.393013
4-0.105992-1.09640.137686
50.2079612.15120.016857
6-0.445349-4.60676e-06
70.2424392.50780.006825
8-0.141849-1.46730.072615
90.0138480.14320.443182
100.1022571.05780.146274
11-0.420488-4.34961.6e-05
120.8488218.78030
13-0.421595-4.3611.5e-05
140.1237241.27980.10169
15-0.025186-0.26050.39748
16-0.091021-0.94150.174277
170.1813941.87640.031666
18-0.388841-4.02225.4e-05
190.2158722.2330.013815
20-0.126878-1.31240.09609
210.0149730.15490.438604
220.0895360.92620.178221
23-0.36398-3.7650.000136
240.7253347.50290
25-0.365087-3.77650.000131
260.103111.06660.144282
27-0.018109-0.18730.425883
28-0.083944-0.86830.19358
290.160781.66310.049608
30-0.340227-3.51930.000318
310.1814121.87650.031653
32-0.105955-1.0960.137768
330.0082040.08490.466264
340.0748740.77450.220171
35-0.32326-3.34380.00057
360.6691356.92160
37-0.324366-3.35530.000549
380.0963410.99660.160613
39-0.024877-0.25730.398708
40-0.063021-0.65190.257933
410.1263191.30670.097065
42-0.291612-3.01650.001598
430.1607981.66330.049589
44-0.098878-1.02280.154354
450.0152810.15810.43735
460.0621530.64290.260827
47-0.266752-2.75930.003408
480.5594945.78740


Partial Autocorrelation Function
Time lag kPACF(k)T-STATP-value
1-0.478102-4.94551e-06
2-0.119438-1.23550.109679
3-0.013661-0.14130.443946
4-0.143834-1.48780.069868
50.121781.25970.10526
6-0.38741-4.00745.7e-05
7-0.197344-2.04130.021839
8-0.183074-1.89370.030481
9-0.18662-1.93040.028101
10-0.084233-0.87130.192766
11-0.630089-6.51770
120.5612075.80520
130.2301662.38090.00952
14-0.088989-0.92050.17969
150.0116530.12050.452141
16-0.051166-0.52930.29886
17-0.093635-0.96860.167472
180.1389471.43730.076778
19-0.107723-1.11430.133826
20-0.006759-0.06990.472196
21-0.041126-0.42540.335696
22-0.085216-0.88150.190015
230.0196710.20350.419574
240.0212350.21970.413278
25-0.034296-0.35480.361734
26-0.010907-0.11280.455191
27-0.061326-0.63440.263599
28-0.043368-0.44860.327311
29-0.020173-0.20870.417552
30-0.03936-0.40710.342359
31-0.089422-0.9250.178528
32-0.058872-0.6090.271916
33-0.085052-0.87980.190475
34-0.110562-1.14370.127658
35-0.127503-1.31890.095009
360.1124451.16310.12368
370.0403690.41760.338545
380.012390.12820.44913
39-0.048766-0.50440.307495
40-0.0232-0.240.405402
41-0.057521-0.5950.276548
420.0360330.37270.355043
430.0238580.24680.402774
44-0.016439-0.170.432646
45-0.017824-0.18440.427034
460.0244970.25340.400221
470.1076291.11330.134032
48-0.108016-1.11730.13318

\begin{tabular}{lllllllll}
\hline
Partial Autocorrelation Function \tabularnewline
Time lag k & PACF(k) & T-STAT & P-value \tabularnewline
1 & -0.478102 & -4.9455 & 1e-06 \tabularnewline
2 & -0.119438 & -1.2355 & 0.109679 \tabularnewline
3 & -0.013661 & -0.1413 & 0.443946 \tabularnewline
4 & -0.143834 & -1.4878 & 0.069868 \tabularnewline
5 & 0.12178 & 1.2597 & 0.10526 \tabularnewline
6 & -0.38741 & -4.0074 & 5.7e-05 \tabularnewline
7 & -0.197344 & -2.0413 & 0.021839 \tabularnewline
8 & -0.183074 & -1.8937 & 0.030481 \tabularnewline
9 & -0.18662 & -1.9304 & 0.028101 \tabularnewline
10 & -0.084233 & -0.8713 & 0.192766 \tabularnewline
11 & -0.630089 & -6.5177 & 0 \tabularnewline
12 & 0.561207 & 5.8052 & 0 \tabularnewline
13 & 0.230166 & 2.3809 & 0.00952 \tabularnewline
14 & -0.088989 & -0.9205 & 0.17969 \tabularnewline
15 & 0.011653 & 0.1205 & 0.452141 \tabularnewline
16 & -0.051166 & -0.5293 & 0.29886 \tabularnewline
17 & -0.093635 & -0.9686 & 0.167472 \tabularnewline
18 & 0.138947 & 1.4373 & 0.076778 \tabularnewline
19 & -0.107723 & -1.1143 & 0.133826 \tabularnewline
20 & -0.006759 & -0.0699 & 0.472196 \tabularnewline
21 & -0.041126 & -0.4254 & 0.335696 \tabularnewline
22 & -0.085216 & -0.8815 & 0.190015 \tabularnewline
23 & 0.019671 & 0.2035 & 0.419574 \tabularnewline
24 & 0.021235 & 0.2197 & 0.413278 \tabularnewline
25 & -0.034296 & -0.3548 & 0.361734 \tabularnewline
26 & -0.010907 & -0.1128 & 0.455191 \tabularnewline
27 & -0.061326 & -0.6344 & 0.263599 \tabularnewline
28 & -0.043368 & -0.4486 & 0.327311 \tabularnewline
29 & -0.020173 & -0.2087 & 0.417552 \tabularnewline
30 & -0.03936 & -0.4071 & 0.342359 \tabularnewline
31 & -0.089422 & -0.925 & 0.178528 \tabularnewline
32 & -0.058872 & -0.609 & 0.271916 \tabularnewline
33 & -0.085052 & -0.8798 & 0.190475 \tabularnewline
34 & -0.110562 & -1.1437 & 0.127658 \tabularnewline
35 & -0.127503 & -1.3189 & 0.095009 \tabularnewline
36 & 0.112445 & 1.1631 & 0.12368 \tabularnewline
37 & 0.040369 & 0.4176 & 0.338545 \tabularnewline
38 & 0.01239 & 0.1282 & 0.44913 \tabularnewline
39 & -0.048766 & -0.5044 & 0.307495 \tabularnewline
40 & -0.0232 & -0.24 & 0.405402 \tabularnewline
41 & -0.057521 & -0.595 & 0.276548 \tabularnewline
42 & 0.036033 & 0.3727 & 0.355043 \tabularnewline
43 & 0.023858 & 0.2468 & 0.402774 \tabularnewline
44 & -0.016439 & -0.17 & 0.432646 \tabularnewline
45 & -0.017824 & -0.1844 & 0.427034 \tabularnewline
46 & 0.024497 & 0.2534 & 0.400221 \tabularnewline
47 & 0.107629 & 1.1133 & 0.134032 \tabularnewline
48 & -0.108016 & -1.1173 & 0.13318 \tabularnewline
\hline
\end{tabular}
%Source: https://freestatistics.org/blog/index.php?pk=307312&T=2

[TABLE]
[ROW][C]Partial Autocorrelation Function[/C][/ROW]
[ROW][C]Time lag k[/C][C]PACF(k)[/C][C]T-STAT[/C][C]P-value[/C][/ROW]
[ROW][C]1[/C][C]-0.478102[/C][C]-4.9455[/C][C]1e-06[/C][/ROW]
[ROW][C]2[/C][C]-0.119438[/C][C]-1.2355[/C][C]0.109679[/C][/ROW]
[ROW][C]3[/C][C]-0.013661[/C][C]-0.1413[/C][C]0.443946[/C][/ROW]
[ROW][C]4[/C][C]-0.143834[/C][C]-1.4878[/C][C]0.069868[/C][/ROW]
[ROW][C]5[/C][C]0.12178[/C][C]1.2597[/C][C]0.10526[/C][/ROW]
[ROW][C]6[/C][C]-0.38741[/C][C]-4.0074[/C][C]5.7e-05[/C][/ROW]
[ROW][C]7[/C][C]-0.197344[/C][C]-2.0413[/C][C]0.021839[/C][/ROW]
[ROW][C]8[/C][C]-0.183074[/C][C]-1.8937[/C][C]0.030481[/C][/ROW]
[ROW][C]9[/C][C]-0.18662[/C][C]-1.9304[/C][C]0.028101[/C][/ROW]
[ROW][C]10[/C][C]-0.084233[/C][C]-0.8713[/C][C]0.192766[/C][/ROW]
[ROW][C]11[/C][C]-0.630089[/C][C]-6.5177[/C][C]0[/C][/ROW]
[ROW][C]12[/C][C]0.561207[/C][C]5.8052[/C][C]0[/C][/ROW]
[ROW][C]13[/C][C]0.230166[/C][C]2.3809[/C][C]0.00952[/C][/ROW]
[ROW][C]14[/C][C]-0.088989[/C][C]-0.9205[/C][C]0.17969[/C][/ROW]
[ROW][C]15[/C][C]0.011653[/C][C]0.1205[/C][C]0.452141[/C][/ROW]
[ROW][C]16[/C][C]-0.051166[/C][C]-0.5293[/C][C]0.29886[/C][/ROW]
[ROW][C]17[/C][C]-0.093635[/C][C]-0.9686[/C][C]0.167472[/C][/ROW]
[ROW][C]18[/C][C]0.138947[/C][C]1.4373[/C][C]0.076778[/C][/ROW]
[ROW][C]19[/C][C]-0.107723[/C][C]-1.1143[/C][C]0.133826[/C][/ROW]
[ROW][C]20[/C][C]-0.006759[/C][C]-0.0699[/C][C]0.472196[/C][/ROW]
[ROW][C]21[/C][C]-0.041126[/C][C]-0.4254[/C][C]0.335696[/C][/ROW]
[ROW][C]22[/C][C]-0.085216[/C][C]-0.8815[/C][C]0.190015[/C][/ROW]
[ROW][C]23[/C][C]0.019671[/C][C]0.2035[/C][C]0.419574[/C][/ROW]
[ROW][C]24[/C][C]0.021235[/C][C]0.2197[/C][C]0.413278[/C][/ROW]
[ROW][C]25[/C][C]-0.034296[/C][C]-0.3548[/C][C]0.361734[/C][/ROW]
[ROW][C]26[/C][C]-0.010907[/C][C]-0.1128[/C][C]0.455191[/C][/ROW]
[ROW][C]27[/C][C]-0.061326[/C][C]-0.6344[/C][C]0.263599[/C][/ROW]
[ROW][C]28[/C][C]-0.043368[/C][C]-0.4486[/C][C]0.327311[/C][/ROW]
[ROW][C]29[/C][C]-0.020173[/C][C]-0.2087[/C][C]0.417552[/C][/ROW]
[ROW][C]30[/C][C]-0.03936[/C][C]-0.4071[/C][C]0.342359[/C][/ROW]
[ROW][C]31[/C][C]-0.089422[/C][C]-0.925[/C][C]0.178528[/C][/ROW]
[ROW][C]32[/C][C]-0.058872[/C][C]-0.609[/C][C]0.271916[/C][/ROW]
[ROW][C]33[/C][C]-0.085052[/C][C]-0.8798[/C][C]0.190475[/C][/ROW]
[ROW][C]34[/C][C]-0.110562[/C][C]-1.1437[/C][C]0.127658[/C][/ROW]
[ROW][C]35[/C][C]-0.127503[/C][C]-1.3189[/C][C]0.095009[/C][/ROW]
[ROW][C]36[/C][C]0.112445[/C][C]1.1631[/C][C]0.12368[/C][/ROW]
[ROW][C]37[/C][C]0.040369[/C][C]0.4176[/C][C]0.338545[/C][/ROW]
[ROW][C]38[/C][C]0.01239[/C][C]0.1282[/C][C]0.44913[/C][/ROW]
[ROW][C]39[/C][C]-0.048766[/C][C]-0.5044[/C][C]0.307495[/C][/ROW]
[ROW][C]40[/C][C]-0.0232[/C][C]-0.24[/C][C]0.405402[/C][/ROW]
[ROW][C]41[/C][C]-0.057521[/C][C]-0.595[/C][C]0.276548[/C][/ROW]
[ROW][C]42[/C][C]0.036033[/C][C]0.3727[/C][C]0.355043[/C][/ROW]
[ROW][C]43[/C][C]0.023858[/C][C]0.2468[/C][C]0.402774[/C][/ROW]
[ROW][C]44[/C][C]-0.016439[/C][C]-0.17[/C][C]0.432646[/C][/ROW]
[ROW][C]45[/C][C]-0.017824[/C][C]-0.1844[/C][C]0.427034[/C][/ROW]
[ROW][C]46[/C][C]0.024497[/C][C]0.2534[/C][C]0.400221[/C][/ROW]
[ROW][C]47[/C][C]0.107629[/C][C]1.1133[/C][C]0.134032[/C][/ROW]
[ROW][C]48[/C][C]-0.108016[/C][C]-1.1173[/C][C]0.13318[/C][/ROW]
[/TABLE]
Source: https://freestatistics.org/blog/index.php?pk=307312&T=2

Globally Unique Identifier (entire table): ba.freestatistics.org/blog/index.php?pk=307312&T=2

As an alternative you can also use a QR Code:  

The GUIDs for individual cells are displayed in the table below:

Partial Autocorrelation Function
Time lag kPACF(k)T-STATP-value
1-0.478102-4.94551e-06
2-0.119438-1.23550.109679
3-0.013661-0.14130.443946
4-0.143834-1.48780.069868
50.121781.25970.10526
6-0.38741-4.00745.7e-05
7-0.197344-2.04130.021839
8-0.183074-1.89370.030481
9-0.18662-1.93040.028101
10-0.084233-0.87130.192766
11-0.630089-6.51770
120.5612075.80520
130.2301662.38090.00952
14-0.088989-0.92050.17969
150.0116530.12050.452141
16-0.051166-0.52930.29886
17-0.093635-0.96860.167472
180.1389471.43730.076778
19-0.107723-1.11430.133826
20-0.006759-0.06990.472196
21-0.041126-0.42540.335696
22-0.085216-0.88150.190015
230.0196710.20350.419574
240.0212350.21970.413278
25-0.034296-0.35480.361734
26-0.010907-0.11280.455191
27-0.061326-0.63440.263599
28-0.043368-0.44860.327311
29-0.020173-0.20870.417552
30-0.03936-0.40710.342359
31-0.089422-0.9250.178528
32-0.058872-0.6090.271916
33-0.085052-0.87980.190475
34-0.110562-1.14370.127658
35-0.127503-1.31890.095009
360.1124451.16310.12368
370.0403690.41760.338545
380.012390.12820.44913
39-0.048766-0.50440.307495
40-0.0232-0.240.405402
41-0.057521-0.5950.276548
420.0360330.37270.355043
430.0238580.24680.402774
44-0.016439-0.170.432646
45-0.017824-0.18440.427034
460.0244970.25340.400221
470.1076291.11330.134032
48-0.108016-1.11730.13318


Parameters (Session):
par1 = Aantal verkochte exemplaren van 'La Libre' ; par2 = Niet gekend ; par3 = Cijferreeks verkochte exemplaren La Libre. ; par4 = 12 ;
Parameters (R input):
par1 = 48 ; par2 = 1 ; par3 = 1 ; par4 = 0 ; par5 = 12 ; par6 = White Noise ; par7 = 0.95 ; par8 = ;
R code (references can be found in the software module):
par8 <- ''
par7 <- '0.95'
par6 <- 'White Noise'
par5 <- '12'
par4 <- '0'
par3 <- '0'
par2 <- '1'
par1 <- '48'
if (par1 == 'Default') {
par1 = 10*log10(length(x))
} else {
par1 <- as.numeric(par1)
}
par2 <- as.numeric(par2)
par3 <- as.numeric(par3)
par4 <- as.numeric(par4)
par5 <- as.numeric(par5)
if (par6 == 'White Noise') par6 <- 'white' else par6 <- 'ma'
par7 <- as.numeric(par7)
if (par8 != '') par8 <- as.numeric(par8)
x <- na.omit(x)
ox <- x
if (par8 == '') {
if (par2 == 0) {
x <- log(x)
} else {
x <- (x ^ par2 - 1) / par2
}
} else {
x <- log(x,base=par8)
}
if (par3 > 0) x <- diff(x,lag=1,difference=par3)
if (par4 > 0) x <- diff(x,lag=par5,difference=par4)
bitmap(file='picts.png')
op <- par(mfrow=c(2,1))
plot(ox,type='l',main='Original Time Series',xlab='time',ylab='value')
if (par8=='') {
mytitle <- paste('Working Time Series (lambda=',par2,', d=',par3,', D=',par4,')',sep='')
mysub <- paste('(lambda=',par2,', d=',par3,', D=',par4,', CI=', par7, ', CI type=',par6,')',sep='')
} else {
mytitle <- paste('Working Time Series (base=',par8,', d=',par3,', D=',par4,')',sep='')
mysub <- paste('(base=',par8,', d=',par3,', D=',par4,', CI=', par7, ', CI type=',par6,')',sep='')
}
plot(x,type='l', main=mytitle,xlab='time',ylab='value')
par(op)
dev.off()
bitmap(file='pic1.png')
racf <- acf(x, par1, main='Autocorrelation', xlab='time lag', ylab='ACF', ci.type=par6, ci=par7, sub=mysub)
dev.off()
bitmap(file='pic2.png')
rpacf <- pacf(x,par1,main='Partial Autocorrelation',xlab='lags',ylab='PACF',sub=mysub)
dev.off()
(myacf <- c(racf$acf))
(mypacf <- c(rpacf$acf))
lengthx <- length(x)
sqrtn <- sqrt(lengthx)
load(file='createtable')
a<-table.start()
a<-table.row.start(a)
a<-table.element(a,'Autocorrelation Function',4,TRUE)
a<-table.row.end(a)
a<-table.row.start(a)
a<-table.element(a,'Time lag k',header=TRUE)
a<-table.element(a,'ACF(k)',header=TRUE)
a<-table.element(a,'T-STAT',header=TRUE)
a<-table.element(a,'P-value',header=TRUE)
a<-table.row.end(a)
for (i in 2:(par1+1)) {
a<-table.row.start(a)
a<-table.element(a,i-1,header=TRUE)
a<-table.element(a,round(myacf[i],6))
mytstat <- myacf[i]*sqrtn
a<-table.element(a,round(mytstat,4))
a<-table.element(a,round(1-pt(abs(mytstat),lengthx),6))
a<-table.row.end(a)
}
a<-table.end(a)
table.save(a,file='mytable.tab')
a<-table.start()
a<-table.row.start(a)
a<-table.element(a,'Partial Autocorrelation Function',4,TRUE)
a<-table.row.end(a)
a<-table.row.start(a)
a<-table.element(a,'Time lag k',header=TRUE)
a<-table.element(a,'PACF(k)',header=TRUE)
a<-table.element(a,'T-STAT',header=TRUE)
a<-table.element(a,'P-value',header=TRUE)
a<-table.row.end(a)
for (i in 1:par1) {
a<-table.row.start(a)
a<-table.element(a,i,header=TRUE)
a<-table.element(a,round(mypacf[i],6))
mytstat <- mypacf[i]*sqrtn
a<-table.element(a,round(mytstat,4))
a<-table.element(a,round(1-pt(abs(mytstat),lengthx),6))
a<-table.row.end(a)
}
a<-table.end(a)
table.save(a,file='mytable1.tab')