Free Statistics
of Irreproducible Research!
Description of Statistical Computation | ||||||||||||||||||||||||||||||||||||||||||
|---|---|---|---|---|---|---|---|---|---|---|---|---|---|---|---|---|---|---|---|---|---|---|---|---|---|---|---|---|---|---|---|---|---|---|---|---|---|---|---|---|---|---|
| Author's title | ||||||||||||||||||||||||||||||||||||||||||
| Author | *Unverified author* | |||||||||||||||||||||||||||||||||||||||||
| R Software Module | rwasp_meanversusmedian.wasp | |||||||||||||||||||||||||||||||||||||||||
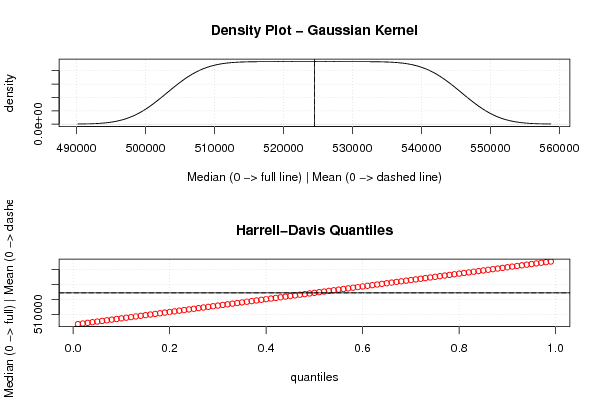
| Title produced by software | Mean versus Median | |||||||||||||||||||||||||||||||||||||||||
| Date of computation | Tue, 15 Aug 2017 20:35:36 +0200 | |||||||||||||||||||||||||||||||||||||||||
| Cite this page as follows | Statistical Computations at FreeStatistics.org, Office for Research Development and Education, URL https://freestatistics.org/blog/index.php?v=date/2017/Aug/15/t15028221625c2c60wgin82k6e.htm/, Retrieved Mon, 20 May 2024 01:53:40 +0000 | |||||||||||||||||||||||||||||||||||||||||
| Statistical Computations at FreeStatistics.org, Office for Research Development and Education, URL https://freestatistics.org/blog/index.php?pk=307306, Retrieved Mon, 20 May 2024 01:53:40 +0000 | ||||||||||||||||||||||||||||||||||||||||||
| QR Codes: | ||||||||||||||||||||||||||||||||||||||||||
|
| ||||||||||||||||||||||||||||||||||||||||||
| Original text written by user: | ||||||||||||||||||||||||||||||||||||||||||
| IsPrivate? | No (this computation is public) | |||||||||||||||||||||||||||||||||||||||||
| User-defined keywords | ||||||||||||||||||||||||||||||||||||||||||
| Estimated Impact | 75 | |||||||||||||||||||||||||||||||||||||||||
Tree of Dependent Computations | ||||||||||||||||||||||||||||||||||||||||||
| Family? (F = Feedback message, R = changed R code, M = changed R Module, P = changed Parameters, D = changed Data) | ||||||||||||||||||||||||||||||||||||||||||
| - [Mean versus Median] [Aantal verkochte ...] [2017-08-15 18:35:36] [6bb7048e855cced252efb5418d255fa6] [Current] | ||||||||||||||||||||||||||||||||||||||||||
| Feedback Forum | ||||||||||||||||||||||||||||||||||||||||||
Post a new message | ||||||||||||||||||||||||||||||||||||||||||
Dataset | ||||||||||||||||||||||||||||||||||||||||||
| Dataseries X: | ||||||||||||||||||||||||||||||||||||||||||
503334 503737 504101 504504 504894 505297 505687 506090 506493 506883 507286 507676 508079 508482 508846 509249 509639 510042 510432 510835 511238 511628 512031 512421 512824 513227 513604 514007 514397 514800 515190 515593 515996 516386 516789 517179 517582 517985 518349 518752 519142 519545 519935 520338 520741 521131 521534 521924 522327 522730 523094 523497 523887 524290 524680 525083 525486 525876 526279 526669 527072 527475 527839 528242 528632 529035 529425 529828 530231 530621 531024 531414 531817 532220 532597 533000 533390 533793 534183 534586 534989 535379 535782 536172 536575 536978 537342 537745 538135 538538 538928 539331 539734 540124 540527 540917 541320 541723 542087 542490 542880 543283 543673 544076 544479 544869 545272 545662 | ||||||||||||||||||||||||||||||||||||||||||
Tables (Output of Computation) | ||||||||||||||||||||||||||||||||||||||||||
| ||||||||||||||||||||||||||||||||||||||||||
Figures (Output of Computation) | ||||||||||||||||||||||||||||||||||||||||||
Input Parameters & R Code | ||||||||||||||||||||||||||||||||||||||||||
| Parameters (Session): | ||||||||||||||||||||||||||||||||||||||||||
| par1 = Aantal verkochte exemplaren van 'La Libre' ; par2 = Niet gekend ; par3 = Cijferreeks verkochte exemplaren La Libre. ; par4 = 12 ; | ||||||||||||||||||||||||||||||||||||||||||
| Parameters (R input): | ||||||||||||||||||||||||||||||||||||||||||
| R code (references can be found in the software module): | ||||||||||||||||||||||||||||||||||||||||||
library(Hmisc) | ||||||||||||||||||||||||||||||||||||||||||