Free Statistics

of Irreproducible Research!

Author's title

Author*Unverified author*
R Software Modulerwasp_exponentialsmoothing.wasp
Title produced by softwareExponential Smoothing
Date of computationSun, 30 Apr 2017 20:05:34 +0100
Cite this page as followsStatistical Computations at FreeStatistics.org, Office for Research Development and Education, URL https://freestatistics.org/blog/index.php?v=date/2017/Apr/30/t1493579226zuos24m5pcwu49w.htm/, Retrieved Sun, 12 May 2024 21:44:10 +0200
Statistical Computations at FreeStatistics.org, Office for Research Development and Education, URL https://freestatistics.org/blog/index.php?pk=, Retrieved Sun, 12 May 2024 21:44:10 +0200
QR Codes:

Original text written by user:
IsPrivate?No (this computation is public)
User-defined keywords
Estimated Impact0
Dataseries X:
96,4
96,9
98,1
99,2
100
100,3
100,3
100,8
101,3
101,4
101,9
103,4
105,6
107,5
109
110,5
109,8
109,6
109,6
108,8
109,4
109,1
109
109,2
110,5
112,2
113,2
113,6
113,2
112,2
112,2
113,2
113,8
113,8
113,7
113,9
114
114,3
114,3
112,8
112,3
112,2
112,6
111,9
111,7
111
110,8
111,1
110,5
110,5
109,8
109
109
109,4
108,8
108,4
108,3
108,2
106,8
103,6
101,4
102,8
104,5
104,8
105,8
105,3
104,3
102,5
102,6
102,3
101,8
99,5


Summary of computational transaction
Raw Inputview raw input (R code)
Raw Outputview raw output of R engine
Computing time2 seconds
R Server'Sir Ronald Aylmer Fisher' @ fisher.wessa.net

\begin{tabular}{lllllllll}
\hline
Summary of computational transaction \tabularnewline
Raw Input & view raw input (R code)  \tabularnewline
Raw Output & view raw output of R engine  \tabularnewline
Computing time & 2 seconds \tabularnewline
R Server & 'Sir Ronald Aylmer Fisher' @ fisher.wessa.net \tabularnewline
\hline
\end{tabular}
%Source: https://freestatistics.org/blog/index.php?pk=&T=0

[TABLE]
[ROW][C]Summary of computational transaction[/C][/ROW]
[ROW][C]Raw Input[/C][C]view raw input (R code) [/C][/ROW]
[ROW][C]Raw Output[/C][C]view raw output of R engine [/C][/ROW]
[ROW][C]Computing time[/C][C]2 seconds[/C][/ROW]
[ROW][C]R Server[/C][C]'Sir Ronald Aylmer Fisher' @ fisher.wessa.net[/C][/ROW]
[/TABLE]
Source: https://freestatistics.org/blog/index.php?pk=&T=0

Globally Unique Identifier (entire table): ba.freestatistics.org/blog/index.php?pk=&T=0

As an alternative you can also use a QR Code:  

The GUIDs for individual cells are displayed in the table below:

Summary of computational transaction
Raw Inputview raw input (R code)
Raw Outputview raw output of R engine
Computing time2 seconds
R Server'Sir Ronald Aylmer Fisher' @ fisher.wessa.net


Estimated Parameters of Exponential Smoothing
ParameterValue
alpha1
beta0.0910353612124379
gamma0.749196041910341

\begin{tabular}{lllllllll}
\hline
Estimated Parameters of Exponential Smoothing \tabularnewline
Parameter & Value \tabularnewline
alpha & 1 \tabularnewline
beta & 0.0910353612124379 \tabularnewline
gamma & 0.749196041910341 \tabularnewline
\hline
\end{tabular}
%Source: https://freestatistics.org/blog/index.php?pk=&T=1

[TABLE]
[ROW][C]Estimated Parameters of Exponential Smoothing[/C][/ROW]
[ROW][C]Parameter[/C][C]Value[/C][/ROW]
[ROW][C]alpha[/C][C]1[/C][/ROW]
[ROW][C]beta[/C][C]0.0910353612124379[/C][/ROW]
[ROW][C]gamma[/C][C]0.749196041910341[/C][/ROW]
[/TABLE]
Source: https://freestatistics.org/blog/index.php?pk=&T=1

Globally Unique Identifier (entire table): ba.freestatistics.org/blog/index.php?pk=&T=1

As an alternative you can also use a QR Code:  

The GUIDs for individual cells are displayed in the table below:

Estimated Parameters of Exponential Smoothing
ParameterValue
alpha1
beta0.0910353612124379
gamma0.749196041910341


Interpolation Forecasts of Exponential Smoothing
tObservedFittedResiduals
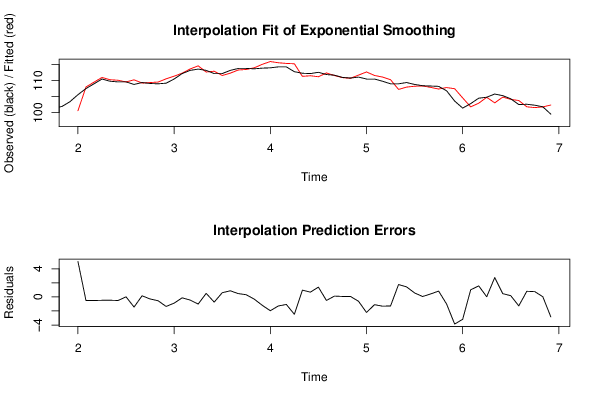
13105.6100.5619419102375.03805808976335
14107.5108.006090767725-0.506090767724615
15109109.514505766079-0.514505766078955
16110.5110.98404605578-0.484046055780141
17109.8110.27700457268-0.477004572679974
18109.6110.110484514878-0.510484514877831
19109.6109.5899130517090.0100869482912458
20108.8110.243024349902-1.44302434990163
21109.4109.2401932399020.159806760097752
22109.1109.392208582912-0.292208582911584
23109109.548098797026-0.548098797025744
24109.2110.557233828049-1.35723382804899
25110.5111.383064248114-0.883064248113669
26112.2112.329963118315-0.129963118314535
27113.2113.64945654484-0.449456544839975
28113.6114.616487766191-1.01648776619096
29113.2112.6998158283810.500184171618514
30112.2112.940203790293-0.740203790293492
31112.2111.6030311972650.596968802734963
32113.2112.3267513714990.873248628501486
33113.8113.3272967749970.472703225003158
34113.8113.4917078413610.308292158639418
35113.7114.021428863248-0.321428863248244
36113.9115.099595804834-1.19959580483409
37114115.969146188196-1.96914618819608
38114.3115.588154876882-1.28815487688159
39114.3115.376429158183-1.07642915818288
40112.8115.275387669778-2.47538766977758
41112.3111.3341818240190.965818175980601
42112.2111.5170414647920.682958535208016
43112.6111.2070166284631.39298337153731
44111.9112.402957091303-0.502957091303259
45111.7111.5862430567750.113756943224644
46111110.9335925951920.0664074048079044
47110.8110.7362698909610.0637301090394118
48111.1111.715952677533-0.615952677532874
49110.5112.714743970589-2.21474397058945
50110.5111.606312329323-1.10631232932259
51109.8111.117856206401-1.3178562064008
52109110.286264533481-1.28626453348052
53109107.2370739502331.76292604976703
54109.4107.971022401191.42897759881036
55108.8108.2341747277120.565825272288393
56108.4108.342156349430.0578436505703195
57108.3107.8786632733210.421336726678874
58108.2107.3692578983660.830742101633859
59106.8107.824754023226-1.02475402322621
60103.6107.465768867421-3.86576886742145
61101.4104.586311870871-3.18631187087091
62102.8101.7850759090771.01492409092289
63104.5102.9289040176341.57109598236566
64104.8104.7774370488370.0225629511634793
65105.8103.0384361826532.76156381734728
66105.3104.8342350083930.465764991607074
67104.3104.1261652101220.173834789877901
68102.5103.775488174498-1.27548817449848
69102.6101.7997196285690.800280371431398
70102.3101.5489917516280.751008248371775
71101.8101.7733223826640.0266776173360626
7299.5102.353405093979-2.85340509397876

\begin{tabular}{lllllllll}
\hline
Interpolation Forecasts of Exponential Smoothing \tabularnewline
t & Observed & Fitted & Residuals \tabularnewline
13 & 105.6 & 100.561941910237 & 5.03805808976335 \tabularnewline
14 & 107.5 & 108.006090767725 & -0.506090767724615 \tabularnewline
15 & 109 & 109.514505766079 & -0.514505766078955 \tabularnewline
16 & 110.5 & 110.98404605578 & -0.484046055780141 \tabularnewline
17 & 109.8 & 110.27700457268 & -0.477004572679974 \tabularnewline
18 & 109.6 & 110.110484514878 & -0.510484514877831 \tabularnewline
19 & 109.6 & 109.589913051709 & 0.0100869482912458 \tabularnewline
20 & 108.8 & 110.243024349902 & -1.44302434990163 \tabularnewline
21 & 109.4 & 109.240193239902 & 0.159806760097752 \tabularnewline
22 & 109.1 & 109.392208582912 & -0.292208582911584 \tabularnewline
23 & 109 & 109.548098797026 & -0.548098797025744 \tabularnewline
24 & 109.2 & 110.557233828049 & -1.35723382804899 \tabularnewline
25 & 110.5 & 111.383064248114 & -0.883064248113669 \tabularnewline
26 & 112.2 & 112.329963118315 & -0.129963118314535 \tabularnewline
27 & 113.2 & 113.64945654484 & -0.449456544839975 \tabularnewline
28 & 113.6 & 114.616487766191 & -1.01648776619096 \tabularnewline
29 & 113.2 & 112.699815828381 & 0.500184171618514 \tabularnewline
30 & 112.2 & 112.940203790293 & -0.740203790293492 \tabularnewline
31 & 112.2 & 111.603031197265 & 0.596968802734963 \tabularnewline
32 & 113.2 & 112.326751371499 & 0.873248628501486 \tabularnewline
33 & 113.8 & 113.327296774997 & 0.472703225003158 \tabularnewline
34 & 113.8 & 113.491707841361 & 0.308292158639418 \tabularnewline
35 & 113.7 & 114.021428863248 & -0.321428863248244 \tabularnewline
36 & 113.9 & 115.099595804834 & -1.19959580483409 \tabularnewline
37 & 114 & 115.969146188196 & -1.96914618819608 \tabularnewline
38 & 114.3 & 115.588154876882 & -1.28815487688159 \tabularnewline
39 & 114.3 & 115.376429158183 & -1.07642915818288 \tabularnewline
40 & 112.8 & 115.275387669778 & -2.47538766977758 \tabularnewline
41 & 112.3 & 111.334181824019 & 0.965818175980601 \tabularnewline
42 & 112.2 & 111.517041464792 & 0.682958535208016 \tabularnewline
43 & 112.6 & 111.207016628463 & 1.39298337153731 \tabularnewline
44 & 111.9 & 112.402957091303 & -0.502957091303259 \tabularnewline
45 & 111.7 & 111.586243056775 & 0.113756943224644 \tabularnewline
46 & 111 & 110.933592595192 & 0.0664074048079044 \tabularnewline
47 & 110.8 & 110.736269890961 & 0.0637301090394118 \tabularnewline
48 & 111.1 & 111.715952677533 & -0.615952677532874 \tabularnewline
49 & 110.5 & 112.714743970589 & -2.21474397058945 \tabularnewline
50 & 110.5 & 111.606312329323 & -1.10631232932259 \tabularnewline
51 & 109.8 & 111.117856206401 & -1.3178562064008 \tabularnewline
52 & 109 & 110.286264533481 & -1.28626453348052 \tabularnewline
53 & 109 & 107.237073950233 & 1.76292604976703 \tabularnewline
54 & 109.4 & 107.97102240119 & 1.42897759881036 \tabularnewline
55 & 108.8 & 108.234174727712 & 0.565825272288393 \tabularnewline
56 & 108.4 & 108.34215634943 & 0.0578436505703195 \tabularnewline
57 & 108.3 & 107.878663273321 & 0.421336726678874 \tabularnewline
58 & 108.2 & 107.369257898366 & 0.830742101633859 \tabularnewline
59 & 106.8 & 107.824754023226 & -1.02475402322621 \tabularnewline
60 & 103.6 & 107.465768867421 & -3.86576886742145 \tabularnewline
61 & 101.4 & 104.586311870871 & -3.18631187087091 \tabularnewline
62 & 102.8 & 101.785075909077 & 1.01492409092289 \tabularnewline
63 & 104.5 & 102.928904017634 & 1.57109598236566 \tabularnewline
64 & 104.8 & 104.777437048837 & 0.0225629511634793 \tabularnewline
65 & 105.8 & 103.038436182653 & 2.76156381734728 \tabularnewline
66 & 105.3 & 104.834235008393 & 0.465764991607074 \tabularnewline
67 & 104.3 & 104.126165210122 & 0.173834789877901 \tabularnewline
68 & 102.5 & 103.775488174498 & -1.27548817449848 \tabularnewline
69 & 102.6 & 101.799719628569 & 0.800280371431398 \tabularnewline
70 & 102.3 & 101.548991751628 & 0.751008248371775 \tabularnewline
71 & 101.8 & 101.773322382664 & 0.0266776173360626 \tabularnewline
72 & 99.5 & 102.353405093979 & -2.85340509397876 \tabularnewline
\hline
\end{tabular}
%Source: https://freestatistics.org/blog/index.php?pk=&T=2

[TABLE]
[ROW][C]Interpolation Forecasts of Exponential Smoothing[/C][/ROW]
[ROW][C]t[/C][C]Observed[/C][C]Fitted[/C][C]Residuals[/C][/ROW]
[ROW][C]13[/C][C]105.6[/C][C]100.561941910237[/C][C]5.03805808976335[/C][/ROW]
[ROW][C]14[/C][C]107.5[/C][C]108.006090767725[/C][C]-0.506090767724615[/C][/ROW]
[ROW][C]15[/C][C]109[/C][C]109.514505766079[/C][C]-0.514505766078955[/C][/ROW]
[ROW][C]16[/C][C]110.5[/C][C]110.98404605578[/C][C]-0.484046055780141[/C][/ROW]
[ROW][C]17[/C][C]109.8[/C][C]110.27700457268[/C][C]-0.477004572679974[/C][/ROW]
[ROW][C]18[/C][C]109.6[/C][C]110.110484514878[/C][C]-0.510484514877831[/C][/ROW]
[ROW][C]19[/C][C]109.6[/C][C]109.589913051709[/C][C]0.0100869482912458[/C][/ROW]
[ROW][C]20[/C][C]108.8[/C][C]110.243024349902[/C][C]-1.44302434990163[/C][/ROW]
[ROW][C]21[/C][C]109.4[/C][C]109.240193239902[/C][C]0.159806760097752[/C][/ROW]
[ROW][C]22[/C][C]109.1[/C][C]109.392208582912[/C][C]-0.292208582911584[/C][/ROW]
[ROW][C]23[/C][C]109[/C][C]109.548098797026[/C][C]-0.548098797025744[/C][/ROW]
[ROW][C]24[/C][C]109.2[/C][C]110.557233828049[/C][C]-1.35723382804899[/C][/ROW]
[ROW][C]25[/C][C]110.5[/C][C]111.383064248114[/C][C]-0.883064248113669[/C][/ROW]
[ROW][C]26[/C][C]112.2[/C][C]112.329963118315[/C][C]-0.129963118314535[/C][/ROW]
[ROW][C]27[/C][C]113.2[/C][C]113.64945654484[/C][C]-0.449456544839975[/C][/ROW]
[ROW][C]28[/C][C]113.6[/C][C]114.616487766191[/C][C]-1.01648776619096[/C][/ROW]
[ROW][C]29[/C][C]113.2[/C][C]112.699815828381[/C][C]0.500184171618514[/C][/ROW]
[ROW][C]30[/C][C]112.2[/C][C]112.940203790293[/C][C]-0.740203790293492[/C][/ROW]
[ROW][C]31[/C][C]112.2[/C][C]111.603031197265[/C][C]0.596968802734963[/C][/ROW]
[ROW][C]32[/C][C]113.2[/C][C]112.326751371499[/C][C]0.873248628501486[/C][/ROW]
[ROW][C]33[/C][C]113.8[/C][C]113.327296774997[/C][C]0.472703225003158[/C][/ROW]
[ROW][C]34[/C][C]113.8[/C][C]113.491707841361[/C][C]0.308292158639418[/C][/ROW]
[ROW][C]35[/C][C]113.7[/C][C]114.021428863248[/C][C]-0.321428863248244[/C][/ROW]
[ROW][C]36[/C][C]113.9[/C][C]115.099595804834[/C][C]-1.19959580483409[/C][/ROW]
[ROW][C]37[/C][C]114[/C][C]115.969146188196[/C][C]-1.96914618819608[/C][/ROW]
[ROW][C]38[/C][C]114.3[/C][C]115.588154876882[/C][C]-1.28815487688159[/C][/ROW]
[ROW][C]39[/C][C]114.3[/C][C]115.376429158183[/C][C]-1.07642915818288[/C][/ROW]
[ROW][C]40[/C][C]112.8[/C][C]115.275387669778[/C][C]-2.47538766977758[/C][/ROW]
[ROW][C]41[/C][C]112.3[/C][C]111.334181824019[/C][C]0.965818175980601[/C][/ROW]
[ROW][C]42[/C][C]112.2[/C][C]111.517041464792[/C][C]0.682958535208016[/C][/ROW]
[ROW][C]43[/C][C]112.6[/C][C]111.207016628463[/C][C]1.39298337153731[/C][/ROW]
[ROW][C]44[/C][C]111.9[/C][C]112.402957091303[/C][C]-0.502957091303259[/C][/ROW]
[ROW][C]45[/C][C]111.7[/C][C]111.586243056775[/C][C]0.113756943224644[/C][/ROW]
[ROW][C]46[/C][C]111[/C][C]110.933592595192[/C][C]0.0664074048079044[/C][/ROW]
[ROW][C]47[/C][C]110.8[/C][C]110.736269890961[/C][C]0.0637301090394118[/C][/ROW]
[ROW][C]48[/C][C]111.1[/C][C]111.715952677533[/C][C]-0.615952677532874[/C][/ROW]
[ROW][C]49[/C][C]110.5[/C][C]112.714743970589[/C][C]-2.21474397058945[/C][/ROW]
[ROW][C]50[/C][C]110.5[/C][C]111.606312329323[/C][C]-1.10631232932259[/C][/ROW]
[ROW][C]51[/C][C]109.8[/C][C]111.117856206401[/C][C]-1.3178562064008[/C][/ROW]
[ROW][C]52[/C][C]109[/C][C]110.286264533481[/C][C]-1.28626453348052[/C][/ROW]
[ROW][C]53[/C][C]109[/C][C]107.237073950233[/C][C]1.76292604976703[/C][/ROW]
[ROW][C]54[/C][C]109.4[/C][C]107.97102240119[/C][C]1.42897759881036[/C][/ROW]
[ROW][C]55[/C][C]108.8[/C][C]108.234174727712[/C][C]0.565825272288393[/C][/ROW]
[ROW][C]56[/C][C]108.4[/C][C]108.34215634943[/C][C]0.0578436505703195[/C][/ROW]
[ROW][C]57[/C][C]108.3[/C][C]107.878663273321[/C][C]0.421336726678874[/C][/ROW]
[ROW][C]58[/C][C]108.2[/C][C]107.369257898366[/C][C]0.830742101633859[/C][/ROW]
[ROW][C]59[/C][C]106.8[/C][C]107.824754023226[/C][C]-1.02475402322621[/C][/ROW]
[ROW][C]60[/C][C]103.6[/C][C]107.465768867421[/C][C]-3.86576886742145[/C][/ROW]
[ROW][C]61[/C][C]101.4[/C][C]104.586311870871[/C][C]-3.18631187087091[/C][/ROW]
[ROW][C]62[/C][C]102.8[/C][C]101.785075909077[/C][C]1.01492409092289[/C][/ROW]
[ROW][C]63[/C][C]104.5[/C][C]102.928904017634[/C][C]1.57109598236566[/C][/ROW]
[ROW][C]64[/C][C]104.8[/C][C]104.777437048837[/C][C]0.0225629511634793[/C][/ROW]
[ROW][C]65[/C][C]105.8[/C][C]103.038436182653[/C][C]2.76156381734728[/C][/ROW]
[ROW][C]66[/C][C]105.3[/C][C]104.834235008393[/C][C]0.465764991607074[/C][/ROW]
[ROW][C]67[/C][C]104.3[/C][C]104.126165210122[/C][C]0.173834789877901[/C][/ROW]
[ROW][C]68[/C][C]102.5[/C][C]103.775488174498[/C][C]-1.27548817449848[/C][/ROW]
[ROW][C]69[/C][C]102.6[/C][C]101.799719628569[/C][C]0.800280371431398[/C][/ROW]
[ROW][C]70[/C][C]102.3[/C][C]101.548991751628[/C][C]0.751008248371775[/C][/ROW]
[ROW][C]71[/C][C]101.8[/C][C]101.773322382664[/C][C]0.0266776173360626[/C][/ROW]
[ROW][C]72[/C][C]99.5[/C][C]102.353405093979[/C][C]-2.85340509397876[/C][/ROW]
[/TABLE]
Source: https://freestatistics.org/blog/index.php?pk=&T=2

Globally Unique Identifier (entire table): ba.freestatistics.org/blog/index.php?pk=&T=2

As an alternative you can also use a QR Code:  

The GUIDs for individual cells are displayed in the table below:

Interpolation Forecasts of Exponential Smoothing
tObservedFittedResiduals
13105.6100.5619419102375.03805808976335
14107.5108.006090767725-0.506090767724615
15109109.514505766079-0.514505766078955
16110.5110.98404605578-0.484046055780141
17109.8110.27700457268-0.477004572679974
18109.6110.110484514878-0.510484514877831
19109.6109.5899130517090.0100869482912458
20108.8110.243024349902-1.44302434990163
21109.4109.2401932399020.159806760097752
22109.1109.392208582912-0.292208582911584
23109109.548098797026-0.548098797025744
24109.2110.557233828049-1.35723382804899
25110.5111.383064248114-0.883064248113669
26112.2112.329963118315-0.129963118314535
27113.2113.64945654484-0.449456544839975
28113.6114.616487766191-1.01648776619096
29113.2112.6998158283810.500184171618514
30112.2112.940203790293-0.740203790293492
31112.2111.6030311972650.596968802734963
32113.2112.3267513714990.873248628501486
33113.8113.3272967749970.472703225003158
34113.8113.4917078413610.308292158639418
35113.7114.021428863248-0.321428863248244
36113.9115.099595804834-1.19959580483409
37114115.969146188196-1.96914618819608
38114.3115.588154876882-1.28815487688159
39114.3115.376429158183-1.07642915818288
40112.8115.275387669778-2.47538766977758
41112.3111.3341818240190.965818175980601
42112.2111.5170414647920.682958535208016
43112.6111.2070166284631.39298337153731
44111.9112.402957091303-0.502957091303259
45111.7111.5862430567750.113756943224644
46111110.9335925951920.0664074048079044
47110.8110.7362698909610.0637301090394118
48111.1111.715952677533-0.615952677532874
49110.5112.714743970589-2.21474397058945
50110.5111.606312329323-1.10631232932259
51109.8111.117856206401-1.3178562064008
52109110.286264533481-1.28626453348052
53109107.2370739502331.76292604976703
54109.4107.971022401191.42897759881036
55108.8108.2341747277120.565825272288393
56108.4108.342156349430.0578436505703195
57108.3107.8786632733210.421336726678874
58108.2107.3692578983660.830742101633859
59106.8107.824754023226-1.02475402322621
60103.6107.465768867421-3.86576886742145
61101.4104.586311870871-3.18631187087091
62102.8101.7850759090771.01492409092289
63104.5102.9289040176341.57109598236566
64104.8104.7774370488370.0225629511634793
65105.8103.0384361826532.76156381734728
66105.3104.8342350083930.465764991607074
67104.3104.1261652101220.173834789877901
68102.5103.775488174498-1.27548817449848
69102.6101.7997196285690.800280371431398
70102.3101.5489917516280.751008248371775
71101.8101.7733223826640.0266776173360626
7299.5102.353405093979-2.85340509397876


Extrapolation Forecasts of Exponential Smoothing
tForecast95% Lower Bound95% Upper Bound
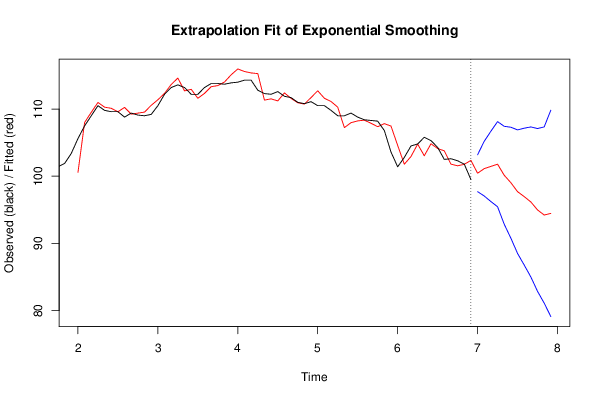
73100.44488290038297.707209392423103.182556408341
74101.12786162612597.0516787299377105.204044522313
75101.46181013761196.2252691134418106.698351161781
76101.79156736320295.4556494514539108.127485274951
77100.13844794167292.8482883758891107.428607507455
7899.033094618969290.7746662206428107.291523017296
7997.698606593363388.5020649878112106.895148198915
8096.961964554689886.7772378725041107.146691236876
8196.166308966717284.9957328972409107.336885036193
8294.978696406335682.8640682867834107.093324525888
8394.222644052099681.1060030717884107.339285032411
8494.463188937970179.089676285225109.836701590715

\begin{tabular}{lllllllll}
\hline
Extrapolation Forecasts of Exponential Smoothing \tabularnewline
t & Forecast & 95% Lower Bound & 95% Upper Bound \tabularnewline
73 & 100.444882900382 & 97.707209392423 & 103.182556408341 \tabularnewline
74 & 101.127861626125 & 97.0516787299377 & 105.204044522313 \tabularnewline
75 & 101.461810137611 & 96.2252691134418 & 106.698351161781 \tabularnewline
76 & 101.791567363202 & 95.4556494514539 & 108.127485274951 \tabularnewline
77 & 100.138447941672 & 92.8482883758891 & 107.428607507455 \tabularnewline
78 & 99.0330946189692 & 90.7746662206428 & 107.291523017296 \tabularnewline
79 & 97.6986065933633 & 88.5020649878112 & 106.895148198915 \tabularnewline
80 & 96.9619645546898 & 86.7772378725041 & 107.146691236876 \tabularnewline
81 & 96.1663089667172 & 84.9957328972409 & 107.336885036193 \tabularnewline
82 & 94.9786964063356 & 82.8640682867834 & 107.093324525888 \tabularnewline
83 & 94.2226440520996 & 81.1060030717884 & 107.339285032411 \tabularnewline
84 & 94.4631889379701 & 79.089676285225 & 109.836701590715 \tabularnewline
\hline
\end{tabular}
%Source: https://freestatistics.org/blog/index.php?pk=&T=3

[TABLE]
[ROW][C]Extrapolation Forecasts of Exponential Smoothing[/C][/ROW]
[ROW][C]t[/C][C]Forecast[/C][C]95% Lower Bound[/C][C]95% Upper Bound[/C][/ROW]
[ROW][C]73[/C][C]100.444882900382[/C][C]97.707209392423[/C][C]103.182556408341[/C][/ROW]
[ROW][C]74[/C][C]101.127861626125[/C][C]97.0516787299377[/C][C]105.204044522313[/C][/ROW]
[ROW][C]75[/C][C]101.461810137611[/C][C]96.2252691134418[/C][C]106.698351161781[/C][/ROW]
[ROW][C]76[/C][C]101.791567363202[/C][C]95.4556494514539[/C][C]108.127485274951[/C][/ROW]
[ROW][C]77[/C][C]100.138447941672[/C][C]92.8482883758891[/C][C]107.428607507455[/C][/ROW]
[ROW][C]78[/C][C]99.0330946189692[/C][C]90.7746662206428[/C][C]107.291523017296[/C][/ROW]
[ROW][C]79[/C][C]97.6986065933633[/C][C]88.5020649878112[/C][C]106.895148198915[/C][/ROW]
[ROW][C]80[/C][C]96.9619645546898[/C][C]86.7772378725041[/C][C]107.146691236876[/C][/ROW]
[ROW][C]81[/C][C]96.1663089667172[/C][C]84.9957328972409[/C][C]107.336885036193[/C][/ROW]
[ROW][C]82[/C][C]94.9786964063356[/C][C]82.8640682867834[/C][C]107.093324525888[/C][/ROW]
[ROW][C]83[/C][C]94.2226440520996[/C][C]81.1060030717884[/C][C]107.339285032411[/C][/ROW]
[ROW][C]84[/C][C]94.4631889379701[/C][C]79.089676285225[/C][C]109.836701590715[/C][/ROW]
[/TABLE]
Source: https://freestatistics.org/blog/index.php?pk=&T=3

Globally Unique Identifier (entire table): ba.freestatistics.org/blog/index.php?pk=&T=3

As an alternative you can also use a QR Code:  

The GUIDs for individual cells are displayed in the table below:

Extrapolation Forecasts of Exponential Smoothing
tForecast95% Lower Bound95% Upper Bound
73100.44488290038297.707209392423103.182556408341
74101.12786162612597.0516787299377105.204044522313
75101.46181013761196.2252691134418106.698351161781
76101.79156736320295.4556494514539108.127485274951
77100.13844794167292.8482883758891107.428607507455
7899.033094618969290.7746662206428107.291523017296
7997.698606593363388.5020649878112106.895148198915
8096.961964554689886.7772378725041107.146691236876
8196.166308966717284.9957328972409107.336885036193
8294.978696406335682.8640682867834107.093324525888
8394.222644052099681.1060030717884107.339285032411
8494.463188937970179.089676285225109.836701590715


Parameters (Session):
par1 = 12 ; par2 = Triple ; par3 = multiplicative ;
Parameters (R input):
par1 = 12 ; par2 = Triple ; par3 = multiplicative ;
R code (references can be found in the software module):
par1 <- as.numeric(par1)
if (par2 == 'Single') K <- 1
if (par2 == 'Double') K <- 2
if (par2 == 'Triple') K <- par1
nx <- length(x)
nxmK <- nx - K
x <- ts(x, frequency = par1)
if (par2 == 'Single') fit <- HoltWinters(x, gamma=F, beta=F)
if (par2 == 'Double') fit <- HoltWinters(x, gamma=F)
if (par2 == 'Triple') fit <- HoltWinters(x, seasonal=par3)
fit
myresid <- x - fit$fitted[,'xhat']
bitmap(file='test1.png')
op <- par(mfrow=c(2,1))
plot(fit,ylab='Observed (black) / Fitted (red)',main='Interpolation Fit of Exponential Smoothing')
plot(myresid,ylab='Residuals',main='Interpolation Prediction Errors')
par(op)
dev.off()
bitmap(file='test2.png')
p <- predict(fit, par1, prediction.interval=TRUE)
np <- length(p[,1])
plot(fit,p,ylab='Observed (black) / Fitted (red)',main='Extrapolation Fit of Exponential Smoothing')
dev.off()
bitmap(file='test3.png')
op <- par(mfrow = c(2,2))
acf(as.numeric(myresid),lag.max = nx/2,main='Residual ACF')
spectrum(myresid,main='Residals Periodogram')
cpgram(myresid,main='Residal Cumulative Periodogram')
qqnorm(myresid,main='Residual Normal QQ Plot')
qqline(myresid)
par(op)
dev.off()
load(file='createtable')
a<-table.start()
a<-table.row.start(a)
a<-table.element(a,'Estimated Parameters of Exponential Smoothing',2,TRUE)
a<-table.row.end(a)
a<-table.row.start(a)
a<-table.element(a,'Parameter',header=TRUE)
a<-table.element(a,'Value',header=TRUE)
a<-table.row.end(a)
a<-table.row.start(a)
a<-table.element(a,'alpha',header=TRUE)
a<-table.element(a,fit$alpha)
a<-table.row.end(a)
a<-table.row.start(a)
a<-table.element(a,'beta',header=TRUE)
a<-table.element(a,fit$beta)
a<-table.row.end(a)
a<-table.row.start(a)
a<-table.element(a,'gamma',header=TRUE)
a<-table.element(a,fit$gamma)
a<-table.row.end(a)
a<-table.end(a)
table.save(a,file='mytable.tab')
a<-table.start()
a<-table.row.start(a)
a<-table.element(a,'Interpolation Forecasts of Exponential Smoothing',4,TRUE)
a<-table.row.end(a)
a<-table.row.start(a)
a<-table.element(a,'t',header=TRUE)
a<-table.element(a,'Observed',header=TRUE)
a<-table.element(a,'Fitted',header=TRUE)
a<-table.element(a,'Residuals',header=TRUE)
a<-table.row.end(a)
for (i in 1:nxmK) {
a<-table.row.start(a)
a<-table.element(a,i+K,header=TRUE)
a<-table.element(a,x[i+K])
a<-table.element(a,fit$fitted[i,'xhat'])
a<-table.element(a,myresid[i])
a<-table.row.end(a)
}
a<-table.end(a)
table.save(a,file='mytable1.tab')
a<-table.start()
a<-table.row.start(a)
a<-table.element(a,'Extrapolation Forecasts of Exponential Smoothing',4,TRUE)
a<-table.row.end(a)
a<-table.row.start(a)
a<-table.element(a,'t',header=TRUE)
a<-table.element(a,'Forecast',header=TRUE)
a<-table.element(a,'95% Lower Bound',header=TRUE)
a<-table.element(a,'95% Upper Bound',header=TRUE)
a<-table.row.end(a)
for (i in 1:np) {
a<-table.row.start(a)
a<-table.element(a,nx+i,header=TRUE)
a<-table.element(a,p[i,'fit'])
a<-table.element(a,p[i,'lwr'])
a<-table.element(a,p[i,'upr'])
a<-table.row.end(a)
}
a<-table.end(a)
table.save(a,file='mytable2.tab')