Free Statistics

of Irreproducible Research!

Author's title

Author*Unverified author*
R Software Modulerwasp_exponentialsmoothing.wasp
Title produced by softwareExponential Smoothing
Date of computationSat, 29 Apr 2017 13:51:19 +0100
Cite this page as followsStatistical Computations at FreeStatistics.org, Office for Research Development and Education, URL https://freestatistics.org/blog/index.php?v=date/2017/Apr/29/t149347041249pjy8fak5lzpk3.htm/, Retrieved Sun, 12 May 2024 23:46:26 +0200
Statistical Computations at FreeStatistics.org, Office for Research Development and Education, URL https://freestatistics.org/blog/index.php?pk=, Retrieved Sun, 12 May 2024 23:46:26 +0200
QR Codes:

Original text written by user:
IsPrivate?No (this computation is public)
User-defined keywords
Estimated Impact0
Dataseries X:
70,3
90,2
107,3
104,6
102,7
124,5
117,8
104,2
99,9
91,5
95,7
91,4
86,2
91,5
115,5
113,9
131,9
121,2
105,2
107,5
113,8
100,5
104,8
103,8
93,1
106,2
117,5
109,9
123,6
139,3
111
122
110,9
108
103,7
107,3
92
83,4
110,7
109
121,3
121,4
129,9
109,7
113,1
109,4
101
109
92,8
91,1
114,5
118,6
120,2
135,9
122,8
106
118,1
108,9
97,3
113,9
88,3
88,3
114,6
118,8
111,9
130,1
124,3
112,2
110
105,8
105,1
106,7


Summary of computational transaction
Raw Inputview raw input (R code)
Raw Outputview raw output of R engine
Computing time2 seconds
R Server'Sir Ronald Aylmer Fisher' @ fisher.wessa.net

\begin{tabular}{lllllllll}
\hline
Summary of computational transaction \tabularnewline
Raw Input & view raw input (R code)  \tabularnewline
Raw Output & view raw output of R engine  \tabularnewline
Computing time & 2 seconds \tabularnewline
R Server & 'Sir Ronald Aylmer Fisher' @ fisher.wessa.net \tabularnewline
\hline
\end{tabular}
%Source: https://freestatistics.org/blog/index.php?pk=&T=0

[TABLE]
[ROW][C]Summary of computational transaction[/C][/ROW]
[ROW][C]Raw Input[/C][C]view raw input (R code) [/C][/ROW]
[ROW][C]Raw Output[/C][C]view raw output of R engine [/C][/ROW]
[ROW][C]Computing time[/C][C]2 seconds[/C][/ROW]
[ROW][C]R Server[/C][C]'Sir Ronald Aylmer Fisher' @ fisher.wessa.net[/C][/ROW]
[/TABLE]
Source: https://freestatistics.org/blog/index.php?pk=&T=0

Globally Unique Identifier (entire table): ba.freestatistics.org/blog/index.php?pk=&T=0

As an alternative you can also use a QR Code:  

The GUIDs for individual cells are displayed in the table below:

Summary of computational transaction
Raw Inputview raw input (R code)
Raw Outputview raw output of R engine
Computing time2 seconds
R Server'Sir Ronald Aylmer Fisher' @ fisher.wessa.net


Estimated Parameters of Exponential Smoothing
ParameterValue
alpha0.14318470352598
beta0.0728750699351533
gamma0.589771469706891

\begin{tabular}{lllllllll}
\hline
Estimated Parameters of Exponential Smoothing \tabularnewline
Parameter & Value \tabularnewline
alpha & 0.14318470352598 \tabularnewline
beta & 0.0728750699351533 \tabularnewline
gamma & 0.589771469706891 \tabularnewline
\hline
\end{tabular}
%Source: https://freestatistics.org/blog/index.php?pk=&T=1

[TABLE]
[ROW][C]Estimated Parameters of Exponential Smoothing[/C][/ROW]
[ROW][C]Parameter[/C][C]Value[/C][/ROW]
[ROW][C]alpha[/C][C]0.14318470352598[/C][/ROW]
[ROW][C]beta[/C][C]0.0728750699351533[/C][/ROW]
[ROW][C]gamma[/C][C]0.589771469706891[/C][/ROW]
[/TABLE]
Source: https://freestatistics.org/blog/index.php?pk=&T=1

Globally Unique Identifier (entire table): ba.freestatistics.org/blog/index.php?pk=&T=1

As an alternative you can also use a QR Code:  

The GUIDs for individual cells are displayed in the table below:

Estimated Parameters of Exponential Smoothing
ParameterValue
alpha0.14318470352598
beta0.0728750699351533
gamma0.589771469706891


Interpolation Forecasts of Exponential Smoothing
tObservedFittedResiduals
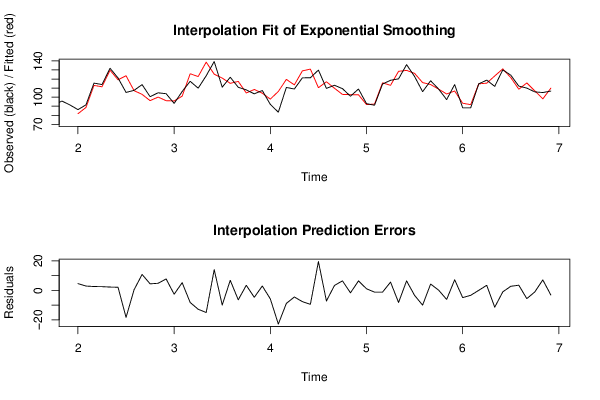
1386.281.69286858974374.50713141025635
1491.588.63503242515912.8649675748409
15115.5112.9677916291352.53220837086451
16113.9111.4418273746672.45817262533261
17131.9129.7309123704062.16908762959366
18121.2119.1595717016182.04042829838167
19105.2123.582766694799-18.3827666947993
20107.5107.1773558371850.322644162815436
21113.8103.07447368214210.7255263178582
22100.596.13970831727634.36029168272373
23104.8100.0640365973314.73596340266879
24103.896.1165731826127.683426817388
2593.195.7905487154191-2.69054871541913
26106.2101.0686608978615.13133910213908
27117.5125.777799727687-8.27779972768693
28109.9122.773818987328-12.8738189873283
29123.6138.668755692042-15.0687556920423
30139.3125.33157513538713.9684248646132
31111121.03415556426-10.0341555642599
32122115.2554025077486.74459749225186
33110.9117.374843596155-6.4748435961547
34108104.6272149756333.37278502436651
35103.7108.456159750707-4.75615975070659
36107.3104.396126571472.90387342852978
379297.8507685165921-5.85076851659205
3883.4106.30326388638-22.9032638863798
39110.7119.604051844681-8.90405184468133
40109113.563133695419-4.56313369541935
41121.3129.000811924409-7.70081192440874
42121.4130.930644659785-9.53064465978534
43129.9110.43302224164719.4669777583532
44109.7116.95855323575-7.25855323574963
45113.1109.8481691943843.25183080561584
46109.4103.0263293294336.37367067056749
47101102.765329972248-1.76532997224776
48109102.6236896183526.37631038164815
4992.891.80716737982090.992832620179101
5091.192.3494933385653-1.2494933385653
51114.5115.777860709779-1.27786070977913
52118.6113.0549839382025.54501606179797
53120.2128.492433170935-8.29243317093515
54135.9129.5447073502496.35529264975057
55122.8126.272514494047-3.47251449404666
56106116.066588539826-10.0665885398259
57118.1113.894210366054.2057896339501
58108.9108.825372870680.0746271293196941
5997.3103.522742249632-6.22274224963182
60113.9106.7836712044397.1163287955613
6188.393.2870493977737-4.98704939777372
6288.391.7119944039267-3.41199440392673
63114.6114.665775662015-0.0657756620150565
64118.8115.4262559372723.37374406272778
65111.9123.39977718203-11.4997771820296
66130.1131.200583628524-1.10058362852382
67124.3121.6226951565972.67730484340281
68112.2108.757458833913.44254116608973
69110115.664817754997-5.66481775499729
70105.8106.925327655956-1.12532765595603
71105.198.08638925301127.01361074698882
72106.7109.938973374162-3.23897337416174

\begin{tabular}{lllllllll}
\hline
Interpolation Forecasts of Exponential Smoothing \tabularnewline
t & Observed & Fitted & Residuals \tabularnewline
13 & 86.2 & 81.6928685897437 & 4.50713141025635 \tabularnewline
14 & 91.5 & 88.6350324251591 & 2.8649675748409 \tabularnewline
15 & 115.5 & 112.967791629135 & 2.53220837086451 \tabularnewline
16 & 113.9 & 111.441827374667 & 2.45817262533261 \tabularnewline
17 & 131.9 & 129.730912370406 & 2.16908762959366 \tabularnewline
18 & 121.2 & 119.159571701618 & 2.04042829838167 \tabularnewline
19 & 105.2 & 123.582766694799 & -18.3827666947993 \tabularnewline
20 & 107.5 & 107.177355837185 & 0.322644162815436 \tabularnewline
21 & 113.8 & 103.074473682142 & 10.7255263178582 \tabularnewline
22 & 100.5 & 96.1397083172763 & 4.36029168272373 \tabularnewline
23 & 104.8 & 100.064036597331 & 4.73596340266879 \tabularnewline
24 & 103.8 & 96.116573182612 & 7.683426817388 \tabularnewline
25 & 93.1 & 95.7905487154191 & -2.69054871541913 \tabularnewline
26 & 106.2 & 101.068660897861 & 5.13133910213908 \tabularnewline
27 & 117.5 & 125.777799727687 & -8.27779972768693 \tabularnewline
28 & 109.9 & 122.773818987328 & -12.8738189873283 \tabularnewline
29 & 123.6 & 138.668755692042 & -15.0687556920423 \tabularnewline
30 & 139.3 & 125.331575135387 & 13.9684248646132 \tabularnewline
31 & 111 & 121.03415556426 & -10.0341555642599 \tabularnewline
32 & 122 & 115.255402507748 & 6.74459749225186 \tabularnewline
33 & 110.9 & 117.374843596155 & -6.4748435961547 \tabularnewline
34 & 108 & 104.627214975633 & 3.37278502436651 \tabularnewline
35 & 103.7 & 108.456159750707 & -4.75615975070659 \tabularnewline
36 & 107.3 & 104.39612657147 & 2.90387342852978 \tabularnewline
37 & 92 & 97.8507685165921 & -5.85076851659205 \tabularnewline
38 & 83.4 & 106.30326388638 & -22.9032638863798 \tabularnewline
39 & 110.7 & 119.604051844681 & -8.90405184468133 \tabularnewline
40 & 109 & 113.563133695419 & -4.56313369541935 \tabularnewline
41 & 121.3 & 129.000811924409 & -7.70081192440874 \tabularnewline
42 & 121.4 & 130.930644659785 & -9.53064465978534 \tabularnewline
43 & 129.9 & 110.433022241647 & 19.4669777583532 \tabularnewline
44 & 109.7 & 116.95855323575 & -7.25855323574963 \tabularnewline
45 & 113.1 & 109.848169194384 & 3.25183080561584 \tabularnewline
46 & 109.4 & 103.026329329433 & 6.37367067056749 \tabularnewline
47 & 101 & 102.765329972248 & -1.76532997224776 \tabularnewline
48 & 109 & 102.623689618352 & 6.37631038164815 \tabularnewline
49 & 92.8 & 91.8071673798209 & 0.992832620179101 \tabularnewline
50 & 91.1 & 92.3494933385653 & -1.2494933385653 \tabularnewline
51 & 114.5 & 115.777860709779 & -1.27786070977913 \tabularnewline
52 & 118.6 & 113.054983938202 & 5.54501606179797 \tabularnewline
53 & 120.2 & 128.492433170935 & -8.29243317093515 \tabularnewline
54 & 135.9 & 129.544707350249 & 6.35529264975057 \tabularnewline
55 & 122.8 & 126.272514494047 & -3.47251449404666 \tabularnewline
56 & 106 & 116.066588539826 & -10.0665885398259 \tabularnewline
57 & 118.1 & 113.89421036605 & 4.2057896339501 \tabularnewline
58 & 108.9 & 108.82537287068 & 0.0746271293196941 \tabularnewline
59 & 97.3 & 103.522742249632 & -6.22274224963182 \tabularnewline
60 & 113.9 & 106.783671204439 & 7.1163287955613 \tabularnewline
61 & 88.3 & 93.2870493977737 & -4.98704939777372 \tabularnewline
62 & 88.3 & 91.7119944039267 & -3.41199440392673 \tabularnewline
63 & 114.6 & 114.665775662015 & -0.0657756620150565 \tabularnewline
64 & 118.8 & 115.426255937272 & 3.37374406272778 \tabularnewline
65 & 111.9 & 123.39977718203 & -11.4997771820296 \tabularnewline
66 & 130.1 & 131.200583628524 & -1.10058362852382 \tabularnewline
67 & 124.3 & 121.622695156597 & 2.67730484340281 \tabularnewline
68 & 112.2 & 108.75745883391 & 3.44254116608973 \tabularnewline
69 & 110 & 115.664817754997 & -5.66481775499729 \tabularnewline
70 & 105.8 & 106.925327655956 & -1.12532765595603 \tabularnewline
71 & 105.1 & 98.0863892530112 & 7.01361074698882 \tabularnewline
72 & 106.7 & 109.938973374162 & -3.23897337416174 \tabularnewline
\hline
\end{tabular}
%Source: https://freestatistics.org/blog/index.php?pk=&T=2

[TABLE]
[ROW][C]Interpolation Forecasts of Exponential Smoothing[/C][/ROW]
[ROW][C]t[/C][C]Observed[/C][C]Fitted[/C][C]Residuals[/C][/ROW]
[ROW][C]13[/C][C]86.2[/C][C]81.6928685897437[/C][C]4.50713141025635[/C][/ROW]
[ROW][C]14[/C][C]91.5[/C][C]88.6350324251591[/C][C]2.8649675748409[/C][/ROW]
[ROW][C]15[/C][C]115.5[/C][C]112.967791629135[/C][C]2.53220837086451[/C][/ROW]
[ROW][C]16[/C][C]113.9[/C][C]111.441827374667[/C][C]2.45817262533261[/C][/ROW]
[ROW][C]17[/C][C]131.9[/C][C]129.730912370406[/C][C]2.16908762959366[/C][/ROW]
[ROW][C]18[/C][C]121.2[/C][C]119.159571701618[/C][C]2.04042829838167[/C][/ROW]
[ROW][C]19[/C][C]105.2[/C][C]123.582766694799[/C][C]-18.3827666947993[/C][/ROW]
[ROW][C]20[/C][C]107.5[/C][C]107.177355837185[/C][C]0.322644162815436[/C][/ROW]
[ROW][C]21[/C][C]113.8[/C][C]103.074473682142[/C][C]10.7255263178582[/C][/ROW]
[ROW][C]22[/C][C]100.5[/C][C]96.1397083172763[/C][C]4.36029168272373[/C][/ROW]
[ROW][C]23[/C][C]104.8[/C][C]100.064036597331[/C][C]4.73596340266879[/C][/ROW]
[ROW][C]24[/C][C]103.8[/C][C]96.116573182612[/C][C]7.683426817388[/C][/ROW]
[ROW][C]25[/C][C]93.1[/C][C]95.7905487154191[/C][C]-2.69054871541913[/C][/ROW]
[ROW][C]26[/C][C]106.2[/C][C]101.068660897861[/C][C]5.13133910213908[/C][/ROW]
[ROW][C]27[/C][C]117.5[/C][C]125.777799727687[/C][C]-8.27779972768693[/C][/ROW]
[ROW][C]28[/C][C]109.9[/C][C]122.773818987328[/C][C]-12.8738189873283[/C][/ROW]
[ROW][C]29[/C][C]123.6[/C][C]138.668755692042[/C][C]-15.0687556920423[/C][/ROW]
[ROW][C]30[/C][C]139.3[/C][C]125.331575135387[/C][C]13.9684248646132[/C][/ROW]
[ROW][C]31[/C][C]111[/C][C]121.03415556426[/C][C]-10.0341555642599[/C][/ROW]
[ROW][C]32[/C][C]122[/C][C]115.255402507748[/C][C]6.74459749225186[/C][/ROW]
[ROW][C]33[/C][C]110.9[/C][C]117.374843596155[/C][C]-6.4748435961547[/C][/ROW]
[ROW][C]34[/C][C]108[/C][C]104.627214975633[/C][C]3.37278502436651[/C][/ROW]
[ROW][C]35[/C][C]103.7[/C][C]108.456159750707[/C][C]-4.75615975070659[/C][/ROW]
[ROW][C]36[/C][C]107.3[/C][C]104.39612657147[/C][C]2.90387342852978[/C][/ROW]
[ROW][C]37[/C][C]92[/C][C]97.8507685165921[/C][C]-5.85076851659205[/C][/ROW]
[ROW][C]38[/C][C]83.4[/C][C]106.30326388638[/C][C]-22.9032638863798[/C][/ROW]
[ROW][C]39[/C][C]110.7[/C][C]119.604051844681[/C][C]-8.90405184468133[/C][/ROW]
[ROW][C]40[/C][C]109[/C][C]113.563133695419[/C][C]-4.56313369541935[/C][/ROW]
[ROW][C]41[/C][C]121.3[/C][C]129.000811924409[/C][C]-7.70081192440874[/C][/ROW]
[ROW][C]42[/C][C]121.4[/C][C]130.930644659785[/C][C]-9.53064465978534[/C][/ROW]
[ROW][C]43[/C][C]129.9[/C][C]110.433022241647[/C][C]19.4669777583532[/C][/ROW]
[ROW][C]44[/C][C]109.7[/C][C]116.95855323575[/C][C]-7.25855323574963[/C][/ROW]
[ROW][C]45[/C][C]113.1[/C][C]109.848169194384[/C][C]3.25183080561584[/C][/ROW]
[ROW][C]46[/C][C]109.4[/C][C]103.026329329433[/C][C]6.37367067056749[/C][/ROW]
[ROW][C]47[/C][C]101[/C][C]102.765329972248[/C][C]-1.76532997224776[/C][/ROW]
[ROW][C]48[/C][C]109[/C][C]102.623689618352[/C][C]6.37631038164815[/C][/ROW]
[ROW][C]49[/C][C]92.8[/C][C]91.8071673798209[/C][C]0.992832620179101[/C][/ROW]
[ROW][C]50[/C][C]91.1[/C][C]92.3494933385653[/C][C]-1.2494933385653[/C][/ROW]
[ROW][C]51[/C][C]114.5[/C][C]115.777860709779[/C][C]-1.27786070977913[/C][/ROW]
[ROW][C]52[/C][C]118.6[/C][C]113.054983938202[/C][C]5.54501606179797[/C][/ROW]
[ROW][C]53[/C][C]120.2[/C][C]128.492433170935[/C][C]-8.29243317093515[/C][/ROW]
[ROW][C]54[/C][C]135.9[/C][C]129.544707350249[/C][C]6.35529264975057[/C][/ROW]
[ROW][C]55[/C][C]122.8[/C][C]126.272514494047[/C][C]-3.47251449404666[/C][/ROW]
[ROW][C]56[/C][C]106[/C][C]116.066588539826[/C][C]-10.0665885398259[/C][/ROW]
[ROW][C]57[/C][C]118.1[/C][C]113.89421036605[/C][C]4.2057896339501[/C][/ROW]
[ROW][C]58[/C][C]108.9[/C][C]108.82537287068[/C][C]0.0746271293196941[/C][/ROW]
[ROW][C]59[/C][C]97.3[/C][C]103.522742249632[/C][C]-6.22274224963182[/C][/ROW]
[ROW][C]60[/C][C]113.9[/C][C]106.783671204439[/C][C]7.1163287955613[/C][/ROW]
[ROW][C]61[/C][C]88.3[/C][C]93.2870493977737[/C][C]-4.98704939777372[/C][/ROW]
[ROW][C]62[/C][C]88.3[/C][C]91.7119944039267[/C][C]-3.41199440392673[/C][/ROW]
[ROW][C]63[/C][C]114.6[/C][C]114.665775662015[/C][C]-0.0657756620150565[/C][/ROW]
[ROW][C]64[/C][C]118.8[/C][C]115.426255937272[/C][C]3.37374406272778[/C][/ROW]
[ROW][C]65[/C][C]111.9[/C][C]123.39977718203[/C][C]-11.4997771820296[/C][/ROW]
[ROW][C]66[/C][C]130.1[/C][C]131.200583628524[/C][C]-1.10058362852382[/C][/ROW]
[ROW][C]67[/C][C]124.3[/C][C]121.622695156597[/C][C]2.67730484340281[/C][/ROW]
[ROW][C]68[/C][C]112.2[/C][C]108.75745883391[/C][C]3.44254116608973[/C][/ROW]
[ROW][C]69[/C][C]110[/C][C]115.664817754997[/C][C]-5.66481775499729[/C][/ROW]
[ROW][C]70[/C][C]105.8[/C][C]106.925327655956[/C][C]-1.12532765595603[/C][/ROW]
[ROW][C]71[/C][C]105.1[/C][C]98.0863892530112[/C][C]7.01361074698882[/C][/ROW]
[ROW][C]72[/C][C]106.7[/C][C]109.938973374162[/C][C]-3.23897337416174[/C][/ROW]
[/TABLE]
Source: https://freestatistics.org/blog/index.php?pk=&T=2

Globally Unique Identifier (entire table): ba.freestatistics.org/blog/index.php?pk=&T=2

As an alternative you can also use a QR Code:  

The GUIDs for individual cells are displayed in the table below:

Interpolation Forecasts of Exponential Smoothing
tObservedFittedResiduals
1386.281.69286858974374.50713141025635
1491.588.63503242515912.8649675748409
15115.5112.9677916291352.53220837086451
16113.9111.4418273746672.45817262533261
17131.9129.7309123704062.16908762959366
18121.2119.1595717016182.04042829838167
19105.2123.582766694799-18.3827666947993
20107.5107.1773558371850.322644162815436
21113.8103.07447368214210.7255263178582
22100.596.13970831727634.36029168272373
23104.8100.0640365973314.73596340266879
24103.896.1165731826127.683426817388
2593.195.7905487154191-2.69054871541913
26106.2101.0686608978615.13133910213908
27117.5125.777799727687-8.27779972768693
28109.9122.773818987328-12.8738189873283
29123.6138.668755692042-15.0687556920423
30139.3125.33157513538713.9684248646132
31111121.03415556426-10.0341555642599
32122115.2554025077486.74459749225186
33110.9117.374843596155-6.4748435961547
34108104.6272149756333.37278502436651
35103.7108.456159750707-4.75615975070659
36107.3104.396126571472.90387342852978
379297.8507685165921-5.85076851659205
3883.4106.30326388638-22.9032638863798
39110.7119.604051844681-8.90405184468133
40109113.563133695419-4.56313369541935
41121.3129.000811924409-7.70081192440874
42121.4130.930644659785-9.53064465978534
43129.9110.43302224164719.4669777583532
44109.7116.95855323575-7.25855323574963
45113.1109.8481691943843.25183080561584
46109.4103.0263293294336.37367067056749
47101102.765329972248-1.76532997224776
48109102.6236896183526.37631038164815
4992.891.80716737982090.992832620179101
5091.192.3494933385653-1.2494933385653
51114.5115.777860709779-1.27786070977913
52118.6113.0549839382025.54501606179797
53120.2128.492433170935-8.29243317093515
54135.9129.5447073502496.35529264975057
55122.8126.272514494047-3.47251449404666
56106116.066588539826-10.0665885398259
57118.1113.894210366054.2057896339501
58108.9108.825372870680.0746271293196941
5997.3103.522742249632-6.22274224963182
60113.9106.7836712044397.1163287955613
6188.393.2870493977737-4.98704939777372
6288.391.7119944039267-3.41199440392673
63114.6114.665775662015-0.0657756620150565
64118.8115.4262559372723.37374406272778
65111.9123.39977718203-11.4997771820296
66130.1131.200583628524-1.10058362852382
67124.3121.6226951565972.67730484340281
68112.2108.757458833913.44254116608973
69110115.664817754997-5.66481775499729
70105.8106.925327655956-1.12532765595603
71105.198.08638925301127.01361074698882
72106.7109.938973374162-3.23897337416174


Extrapolation Forecasts of Exponential Smoothing
tForecast95% Lower Bound95% Upper Bound
7388.691278021940273.6702797715162103.712276272364
7488.526034599245473.3288304180973103.723238780394
75113.59472013161598.1990207634837128.990419499746
76116.038811024437100.421604027181131.656018021692
77115.914211225038100.051899456823131.776522993254
78130.637492959177114.50603197855146.768953939804
79123.158646048786106.733677731246139.583614366326
80110.30120975427593.5581896908293127.044229817722
81112.0820057130994.9963223251602129.16768910102
82106.47519415736689.0222779019129123.928110412819
83101.94958308645784.1050045979755119.794161574939
84107.58323876342589.3227952503961125.843682276455

\begin{tabular}{lllllllll}
\hline
Extrapolation Forecasts of Exponential Smoothing \tabularnewline
t & Forecast & 95% Lower Bound & 95% Upper Bound \tabularnewline
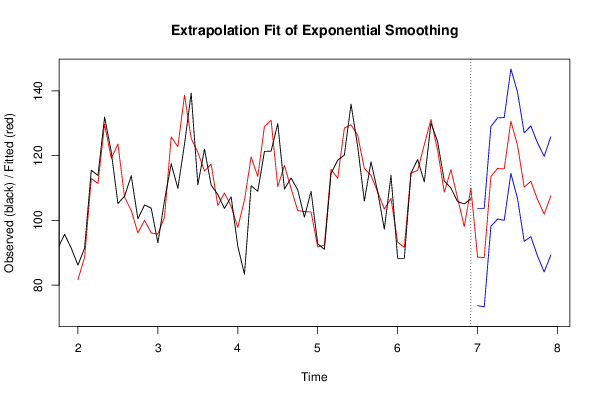
73 & 88.6912780219402 & 73.6702797715162 & 103.712276272364 \tabularnewline
74 & 88.5260345992454 & 73.3288304180973 & 103.723238780394 \tabularnewline
75 & 113.594720131615 & 98.1990207634837 & 128.990419499746 \tabularnewline
76 & 116.038811024437 & 100.421604027181 & 131.656018021692 \tabularnewline
77 & 115.914211225038 & 100.051899456823 & 131.776522993254 \tabularnewline
78 & 130.637492959177 & 114.50603197855 & 146.768953939804 \tabularnewline
79 & 123.158646048786 & 106.733677731246 & 139.583614366326 \tabularnewline
80 & 110.301209754275 & 93.5581896908293 & 127.044229817722 \tabularnewline
81 & 112.08200571309 & 94.9963223251602 & 129.16768910102 \tabularnewline
82 & 106.475194157366 & 89.0222779019129 & 123.928110412819 \tabularnewline
83 & 101.949583086457 & 84.1050045979755 & 119.794161574939 \tabularnewline
84 & 107.583238763425 & 89.3227952503961 & 125.843682276455 \tabularnewline
\hline
\end{tabular}
%Source: https://freestatistics.org/blog/index.php?pk=&T=3

[TABLE]
[ROW][C]Extrapolation Forecasts of Exponential Smoothing[/C][/ROW]
[ROW][C]t[/C][C]Forecast[/C][C]95% Lower Bound[/C][C]95% Upper Bound[/C][/ROW]
[ROW][C]73[/C][C]88.6912780219402[/C][C]73.6702797715162[/C][C]103.712276272364[/C][/ROW]
[ROW][C]74[/C][C]88.5260345992454[/C][C]73.3288304180973[/C][C]103.723238780394[/C][/ROW]
[ROW][C]75[/C][C]113.594720131615[/C][C]98.1990207634837[/C][C]128.990419499746[/C][/ROW]
[ROW][C]76[/C][C]116.038811024437[/C][C]100.421604027181[/C][C]131.656018021692[/C][/ROW]
[ROW][C]77[/C][C]115.914211225038[/C][C]100.051899456823[/C][C]131.776522993254[/C][/ROW]
[ROW][C]78[/C][C]130.637492959177[/C][C]114.50603197855[/C][C]146.768953939804[/C][/ROW]
[ROW][C]79[/C][C]123.158646048786[/C][C]106.733677731246[/C][C]139.583614366326[/C][/ROW]
[ROW][C]80[/C][C]110.301209754275[/C][C]93.5581896908293[/C][C]127.044229817722[/C][/ROW]
[ROW][C]81[/C][C]112.08200571309[/C][C]94.9963223251602[/C][C]129.16768910102[/C][/ROW]
[ROW][C]82[/C][C]106.475194157366[/C][C]89.0222779019129[/C][C]123.928110412819[/C][/ROW]
[ROW][C]83[/C][C]101.949583086457[/C][C]84.1050045979755[/C][C]119.794161574939[/C][/ROW]
[ROW][C]84[/C][C]107.583238763425[/C][C]89.3227952503961[/C][C]125.843682276455[/C][/ROW]
[/TABLE]
Source: https://freestatistics.org/blog/index.php?pk=&T=3

Globally Unique Identifier (entire table): ba.freestatistics.org/blog/index.php?pk=&T=3

As an alternative you can also use a QR Code:  

The GUIDs for individual cells are displayed in the table below:

Extrapolation Forecasts of Exponential Smoothing
tForecast95% Lower Bound95% Upper Bound
7388.691278021940273.6702797715162103.712276272364
7488.526034599245473.3288304180973103.723238780394
75113.59472013161598.1990207634837128.990419499746
76116.038811024437100.421604027181131.656018021692
77115.914211225038100.051899456823131.776522993254
78130.637492959177114.50603197855146.768953939804
79123.158646048786106.733677731246139.583614366326
80110.30120975427593.5581896908293127.044229817722
81112.0820057130994.9963223251602129.16768910102
82106.47519415736689.0222779019129123.928110412819
83101.94958308645784.1050045979755119.794161574939
84107.58323876342589.3227952503961125.843682276455


Parameters (Session):
par1 = 12 ; par2 = Triple ; par3 = additive ;
Parameters (R input):
par1 = 12 ; par2 = Triple ; par3 = additive ;
R code (references can be found in the software module):
par1 <- as.numeric(par1)
if (par2 == 'Single') K <- 1
if (par2 == 'Double') K <- 2
if (par2 == 'Triple') K <- par1
nx <- length(x)
nxmK <- nx - K
x <- ts(x, frequency = par1)
if (par2 == 'Single') fit <- HoltWinters(x, gamma=F, beta=F)
if (par2 == 'Double') fit <- HoltWinters(x, gamma=F)
if (par2 == 'Triple') fit <- HoltWinters(x, seasonal=par3)
fit
myresid <- x - fit$fitted[,'xhat']
bitmap(file='test1.png')
op <- par(mfrow=c(2,1))
plot(fit,ylab='Observed (black) / Fitted (red)',main='Interpolation Fit of Exponential Smoothing')
plot(myresid,ylab='Residuals',main='Interpolation Prediction Errors')
par(op)
dev.off()
bitmap(file='test2.png')
p <- predict(fit, par1, prediction.interval=TRUE)
np <- length(p[,1])
plot(fit,p,ylab='Observed (black) / Fitted (red)',main='Extrapolation Fit of Exponential Smoothing')
dev.off()
bitmap(file='test3.png')
op <- par(mfrow = c(2,2))
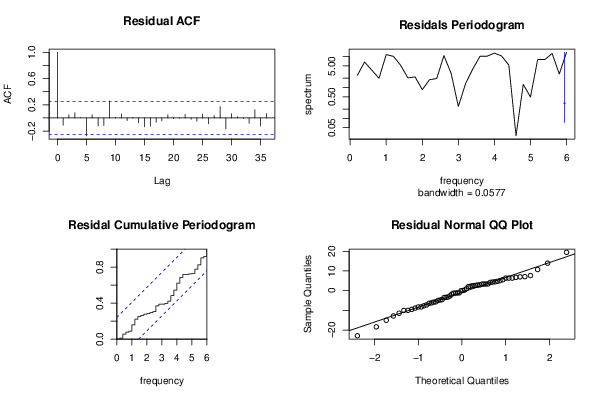
acf(as.numeric(myresid),lag.max = nx/2,main='Residual ACF')
spectrum(myresid,main='Residals Periodogram')
cpgram(myresid,main='Residal Cumulative Periodogram')
qqnorm(myresid,main='Residual Normal QQ Plot')
qqline(myresid)
par(op)
dev.off()
load(file='createtable')
a<-table.start()
a<-table.row.start(a)
a<-table.element(a,'Estimated Parameters of Exponential Smoothing',2,TRUE)
a<-table.row.end(a)
a<-table.row.start(a)
a<-table.element(a,'Parameter',header=TRUE)
a<-table.element(a,'Value',header=TRUE)
a<-table.row.end(a)
a<-table.row.start(a)
a<-table.element(a,'alpha',header=TRUE)
a<-table.element(a,fit$alpha)
a<-table.row.end(a)
a<-table.row.start(a)
a<-table.element(a,'beta',header=TRUE)
a<-table.element(a,fit$beta)
a<-table.row.end(a)
a<-table.row.start(a)
a<-table.element(a,'gamma',header=TRUE)
a<-table.element(a,fit$gamma)
a<-table.row.end(a)
a<-table.end(a)
table.save(a,file='mytable.tab')
a<-table.start()
a<-table.row.start(a)
a<-table.element(a,'Interpolation Forecasts of Exponential Smoothing',4,TRUE)
a<-table.row.end(a)
a<-table.row.start(a)
a<-table.element(a,'t',header=TRUE)
a<-table.element(a,'Observed',header=TRUE)
a<-table.element(a,'Fitted',header=TRUE)
a<-table.element(a,'Residuals',header=TRUE)
a<-table.row.end(a)
for (i in 1:nxmK) {
a<-table.row.start(a)
a<-table.element(a,i+K,header=TRUE)
a<-table.element(a,x[i+K])
a<-table.element(a,fit$fitted[i,'xhat'])
a<-table.element(a,myresid[i])
a<-table.row.end(a)
}
a<-table.end(a)
table.save(a,file='mytable1.tab')
a<-table.start()
a<-table.row.start(a)
a<-table.element(a,'Extrapolation Forecasts of Exponential Smoothing',4,TRUE)
a<-table.row.end(a)
a<-table.row.start(a)
a<-table.element(a,'t',header=TRUE)
a<-table.element(a,'Forecast',header=TRUE)
a<-table.element(a,'95% Lower Bound',header=TRUE)
a<-table.element(a,'95% Upper Bound',header=TRUE)
a<-table.row.end(a)
for (i in 1:np) {
a<-table.row.start(a)
a<-table.element(a,nx+i,header=TRUE)
a<-table.element(a,p[i,'fit'])
a<-table.element(a,p[i,'lwr'])
a<-table.element(a,p[i,'upr'])
a<-table.row.end(a)
}
a<-table.end(a)
table.save(a,file='mytable2.tab')