Free Statistics

of Irreproducible Research!

Author's title

Author*Unverified author*
R Software Modulerwasp_exponentialsmoothing.wasp
Title produced by softwareExponential Smoothing
Date of computationSat, 29 Apr 2017 11:00:13 +0100
Cite this page as followsStatistical Computations at FreeStatistics.org, Office for Research Development and Education, URL https://freestatistics.org/blog/index.php?v=date/2017/Apr/29/t1493460048rjapa2wap2e6gsf.htm/, Retrieved Mon, 13 May 2024 17:24:44 +0200
Statistical Computations at FreeStatistics.org, Office for Research Development and Education, URL https://freestatistics.org/blog/index.php?pk=, Retrieved Mon, 13 May 2024 17:24:44 +0200
QR Codes:

Original text written by user:
IsPrivate?No (this computation is public)
User-defined keywords
Estimated Impact0
Dataseries X:
102.8
103.3
103.3
104
104.3
104.1
103.9
103.8
103.7
103.6
103.6
103.8
104.9
106.2
106.8
107.3
106.9
107.1
106.6
106.8
107.1
107.5
107.6
107.7
108.4
108.8
108.9
109.2
110.1
110.4
110.7
111
111
111.2
111.5
111.4
111.1
110.6
110.8
110.9
110.8
110.9
110.6
110.3
109.7
109.4
109
109.5
109.8
108.5
108.4
108.4
107.9
106.7
106.9
106.9
106.7
106.7
106.6
107.1


Summary of computational transaction
Raw Inputview raw input (R code)
Raw Outputview raw output of R engine
Computing time3 seconds
R Server'Sir Ronald Aylmer Fisher' @ fisher.wessa.net

\begin{tabular}{lllllllll}
\hline
Summary of computational transaction \tabularnewline
Raw Input & view raw input (R code)  \tabularnewline
Raw Output & view raw output of R engine  \tabularnewline
Computing time & 3 seconds \tabularnewline
R Server & 'Sir Ronald Aylmer Fisher' @ fisher.wessa.net \tabularnewline
\hline
\end{tabular}
%Source: https://freestatistics.org/blog/index.php?pk=&T=0

[TABLE]
[ROW][C]Summary of computational transaction[/C][/ROW]
[ROW][C]Raw Input[/C][C]view raw input (R code) [/C][/ROW]
[ROW][C]Raw Output[/C][C]view raw output of R engine [/C][/ROW]
[ROW][C]Computing time[/C][C]3 seconds[/C][/ROW]
[ROW][C]R Server[/C][C]'Sir Ronald Aylmer Fisher' @ fisher.wessa.net[/C][/ROW]
[/TABLE]
Source: https://freestatistics.org/blog/index.php?pk=&T=0

Globally Unique Identifier (entire table): ba.freestatistics.org/blog/index.php?pk=&T=0

As an alternative you can also use a QR Code:  

The GUIDs for individual cells are displayed in the table below:

Summary of computational transaction
Raw Inputview raw input (R code)
Raw Outputview raw output of R engine
Computing time3 seconds
R Server'Sir Ronald Aylmer Fisher' @ fisher.wessa.net


Estimated Parameters of Exponential Smoothing
ParameterValue
alpha0.97103793573623
beta0.0954015405354628
gamma1

\begin{tabular}{lllllllll}
\hline
Estimated Parameters of Exponential Smoothing \tabularnewline
Parameter & Value \tabularnewline
alpha & 0.97103793573623 \tabularnewline
beta & 0.0954015405354628 \tabularnewline
gamma & 1 \tabularnewline
\hline
\end{tabular}
%Source: https://freestatistics.org/blog/index.php?pk=&T=1

[TABLE]
[ROW][C]Estimated Parameters of Exponential Smoothing[/C][/ROW]
[ROW][C]Parameter[/C][C]Value[/C][/ROW]
[ROW][C]alpha[/C][C]0.97103793573623[/C][/ROW]
[ROW][C]beta[/C][C]0.0954015405354628[/C][/ROW]
[ROW][C]gamma[/C][C]1[/C][/ROW]
[/TABLE]
Source: https://freestatistics.org/blog/index.php?pk=&T=1

Globally Unique Identifier (entire table): ba.freestatistics.org/blog/index.php?pk=&T=1

As an alternative you can also use a QR Code:  

The GUIDs for individual cells are displayed in the table below:

Estimated Parameters of Exponential Smoothing
ParameterValue
alpha0.97103793573623
beta0.0954015405354628
gamma1


Interpolation Forecasts of Exponential Smoothing
tObservedFittedResiduals
13104.9103.3991185897441.50088141025641
14106.2106.320731057573-0.120731057572755
15106.8106.927345289524-0.127345289523916
16107.3107.378239772823-0.0782397728225419
17106.9106.944569559325-0.0445695593248843
18107.1107.139465542648-0.0394655426482871
19106.6107.206495023859-0.606495023858528
20106.8106.6167325697750.183267430224859
21107.1106.7525037080750.347496291924827
22107.5107.063272175010.436727824990399
23107.6107.638645662775-0.0386456627754512
24107.7107.961333383467-0.261333383467203
25108.4108.982875300173-0.582875300173072
26108.8109.747757247237-0.94775724723678
27108.9109.38813317371-0.488133173710324
28109.2109.293715338368-0.0937153383681704
29110.1108.6481634956531.45183650434707
30110.4110.2370697656010.162930234399397
31110.7110.4437559329820.256244067017732
32111110.7540869368310.245913063169297
33111111.000717087581-0.000717087581065812
34111.2110.988954831810.211045168190353
35111.5111.3235205438290.176479456171151
36111.4111.860688734372-0.460688734371729
37111.1112.672903855841-1.57290385584118
38110.6112.367715339136-1.76771533913605
39110.8111.051085370277-0.251085370277124
40110.9111.046125711498-0.146125711497589
41110.8110.2374411730550.562558826945263
42110.9110.6861117261910.213888273809062
43110.6110.710319350854-0.110319350854013
44110.3110.395782978885-0.0957829788849409
45109.7110.003194994108-0.303194994107727
46109.4109.3755517864330.0244482135666289
47109109.182341115666-0.18234111566592
48109.5108.9738040410480.526195958952187
49109.8110.424709952859-0.624709952859263
50108.5110.835051179528-2.33505117952761
51108.4108.759323808058-0.359323808057781
52108.4108.390155806420.00984419357985189
53107.9107.5057531881240.394246811876002
54106.7107.517600253829-0.817600253828545
55106.9106.1719601835990.728039816401008
56106.9106.3907442362070.509255763792822
57106.7106.3545354997390.345464500260846
58106.7106.2012161010920.49878389890776
59106.6106.3415176917020.258482308298383
60107.1106.501298170850.5987018291504

\begin{tabular}{lllllllll}
\hline
Interpolation Forecasts of Exponential Smoothing \tabularnewline
t & Observed & Fitted & Residuals \tabularnewline
13 & 104.9 & 103.399118589744 & 1.50088141025641 \tabularnewline
14 & 106.2 & 106.320731057573 & -0.120731057572755 \tabularnewline
15 & 106.8 & 106.927345289524 & -0.127345289523916 \tabularnewline
16 & 107.3 & 107.378239772823 & -0.0782397728225419 \tabularnewline
17 & 106.9 & 106.944569559325 & -0.0445695593248843 \tabularnewline
18 & 107.1 & 107.139465542648 & -0.0394655426482871 \tabularnewline
19 & 106.6 & 107.206495023859 & -0.606495023858528 \tabularnewline
20 & 106.8 & 106.616732569775 & 0.183267430224859 \tabularnewline
21 & 107.1 & 106.752503708075 & 0.347496291924827 \tabularnewline
22 & 107.5 & 107.06327217501 & 0.436727824990399 \tabularnewline
23 & 107.6 & 107.638645662775 & -0.0386456627754512 \tabularnewline
24 & 107.7 & 107.961333383467 & -0.261333383467203 \tabularnewline
25 & 108.4 & 108.982875300173 & -0.582875300173072 \tabularnewline
26 & 108.8 & 109.747757247237 & -0.94775724723678 \tabularnewline
27 & 108.9 & 109.38813317371 & -0.488133173710324 \tabularnewline
28 & 109.2 & 109.293715338368 & -0.0937153383681704 \tabularnewline
29 & 110.1 & 108.648163495653 & 1.45183650434707 \tabularnewline
30 & 110.4 & 110.237069765601 & 0.162930234399397 \tabularnewline
31 & 110.7 & 110.443755932982 & 0.256244067017732 \tabularnewline
32 & 111 & 110.754086936831 & 0.245913063169297 \tabularnewline
33 & 111 & 111.000717087581 & -0.000717087581065812 \tabularnewline
34 & 111.2 & 110.98895483181 & 0.211045168190353 \tabularnewline
35 & 111.5 & 111.323520543829 & 0.176479456171151 \tabularnewline
36 & 111.4 & 111.860688734372 & -0.460688734371729 \tabularnewline
37 & 111.1 & 112.672903855841 & -1.57290385584118 \tabularnewline
38 & 110.6 & 112.367715339136 & -1.76771533913605 \tabularnewline
39 & 110.8 & 111.051085370277 & -0.251085370277124 \tabularnewline
40 & 110.9 & 111.046125711498 & -0.146125711497589 \tabularnewline
41 & 110.8 & 110.237441173055 & 0.562558826945263 \tabularnewline
42 & 110.9 & 110.686111726191 & 0.213888273809062 \tabularnewline
43 & 110.6 & 110.710319350854 & -0.110319350854013 \tabularnewline
44 & 110.3 & 110.395782978885 & -0.0957829788849409 \tabularnewline
45 & 109.7 & 110.003194994108 & -0.303194994107727 \tabularnewline
46 & 109.4 & 109.375551786433 & 0.0244482135666289 \tabularnewline
47 & 109 & 109.182341115666 & -0.18234111566592 \tabularnewline
48 & 109.5 & 108.973804041048 & 0.526195958952187 \tabularnewline
49 & 109.8 & 110.424709952859 & -0.624709952859263 \tabularnewline
50 & 108.5 & 110.835051179528 & -2.33505117952761 \tabularnewline
51 & 108.4 & 108.759323808058 & -0.359323808057781 \tabularnewline
52 & 108.4 & 108.39015580642 & 0.00984419357985189 \tabularnewline
53 & 107.9 & 107.505753188124 & 0.394246811876002 \tabularnewline
54 & 106.7 & 107.517600253829 & -0.817600253828545 \tabularnewline
55 & 106.9 & 106.171960183599 & 0.728039816401008 \tabularnewline
56 & 106.9 & 106.390744236207 & 0.509255763792822 \tabularnewline
57 & 106.7 & 106.354535499739 & 0.345464500260846 \tabularnewline
58 & 106.7 & 106.201216101092 & 0.49878389890776 \tabularnewline
59 & 106.6 & 106.341517691702 & 0.258482308298383 \tabularnewline
60 & 107.1 & 106.50129817085 & 0.5987018291504 \tabularnewline
\hline
\end{tabular}
%Source: https://freestatistics.org/blog/index.php?pk=&T=2

[TABLE]
[ROW][C]Interpolation Forecasts of Exponential Smoothing[/C][/ROW]
[ROW][C]t[/C][C]Observed[/C][C]Fitted[/C][C]Residuals[/C][/ROW]
[ROW][C]13[/C][C]104.9[/C][C]103.399118589744[/C][C]1.50088141025641[/C][/ROW]
[ROW][C]14[/C][C]106.2[/C][C]106.320731057573[/C][C]-0.120731057572755[/C][/ROW]
[ROW][C]15[/C][C]106.8[/C][C]106.927345289524[/C][C]-0.127345289523916[/C][/ROW]
[ROW][C]16[/C][C]107.3[/C][C]107.378239772823[/C][C]-0.0782397728225419[/C][/ROW]
[ROW][C]17[/C][C]106.9[/C][C]106.944569559325[/C][C]-0.0445695593248843[/C][/ROW]
[ROW][C]18[/C][C]107.1[/C][C]107.139465542648[/C][C]-0.0394655426482871[/C][/ROW]
[ROW][C]19[/C][C]106.6[/C][C]107.206495023859[/C][C]-0.606495023858528[/C][/ROW]
[ROW][C]20[/C][C]106.8[/C][C]106.616732569775[/C][C]0.183267430224859[/C][/ROW]
[ROW][C]21[/C][C]107.1[/C][C]106.752503708075[/C][C]0.347496291924827[/C][/ROW]
[ROW][C]22[/C][C]107.5[/C][C]107.06327217501[/C][C]0.436727824990399[/C][/ROW]
[ROW][C]23[/C][C]107.6[/C][C]107.638645662775[/C][C]-0.0386456627754512[/C][/ROW]
[ROW][C]24[/C][C]107.7[/C][C]107.961333383467[/C][C]-0.261333383467203[/C][/ROW]
[ROW][C]25[/C][C]108.4[/C][C]108.982875300173[/C][C]-0.582875300173072[/C][/ROW]
[ROW][C]26[/C][C]108.8[/C][C]109.747757247237[/C][C]-0.94775724723678[/C][/ROW]
[ROW][C]27[/C][C]108.9[/C][C]109.38813317371[/C][C]-0.488133173710324[/C][/ROW]
[ROW][C]28[/C][C]109.2[/C][C]109.293715338368[/C][C]-0.0937153383681704[/C][/ROW]
[ROW][C]29[/C][C]110.1[/C][C]108.648163495653[/C][C]1.45183650434707[/C][/ROW]
[ROW][C]30[/C][C]110.4[/C][C]110.237069765601[/C][C]0.162930234399397[/C][/ROW]
[ROW][C]31[/C][C]110.7[/C][C]110.443755932982[/C][C]0.256244067017732[/C][/ROW]
[ROW][C]32[/C][C]111[/C][C]110.754086936831[/C][C]0.245913063169297[/C][/ROW]
[ROW][C]33[/C][C]111[/C][C]111.000717087581[/C][C]-0.000717087581065812[/C][/ROW]
[ROW][C]34[/C][C]111.2[/C][C]110.98895483181[/C][C]0.211045168190353[/C][/ROW]
[ROW][C]35[/C][C]111.5[/C][C]111.323520543829[/C][C]0.176479456171151[/C][/ROW]
[ROW][C]36[/C][C]111.4[/C][C]111.860688734372[/C][C]-0.460688734371729[/C][/ROW]
[ROW][C]37[/C][C]111.1[/C][C]112.672903855841[/C][C]-1.57290385584118[/C][/ROW]
[ROW][C]38[/C][C]110.6[/C][C]112.367715339136[/C][C]-1.76771533913605[/C][/ROW]
[ROW][C]39[/C][C]110.8[/C][C]111.051085370277[/C][C]-0.251085370277124[/C][/ROW]
[ROW][C]40[/C][C]110.9[/C][C]111.046125711498[/C][C]-0.146125711497589[/C][/ROW]
[ROW][C]41[/C][C]110.8[/C][C]110.237441173055[/C][C]0.562558826945263[/C][/ROW]
[ROW][C]42[/C][C]110.9[/C][C]110.686111726191[/C][C]0.213888273809062[/C][/ROW]
[ROW][C]43[/C][C]110.6[/C][C]110.710319350854[/C][C]-0.110319350854013[/C][/ROW]
[ROW][C]44[/C][C]110.3[/C][C]110.395782978885[/C][C]-0.0957829788849409[/C][/ROW]
[ROW][C]45[/C][C]109.7[/C][C]110.003194994108[/C][C]-0.303194994107727[/C][/ROW]
[ROW][C]46[/C][C]109.4[/C][C]109.375551786433[/C][C]0.0244482135666289[/C][/ROW]
[ROW][C]47[/C][C]109[/C][C]109.182341115666[/C][C]-0.18234111566592[/C][/ROW]
[ROW][C]48[/C][C]109.5[/C][C]108.973804041048[/C][C]0.526195958952187[/C][/ROW]
[ROW][C]49[/C][C]109.8[/C][C]110.424709952859[/C][C]-0.624709952859263[/C][/ROW]
[ROW][C]50[/C][C]108.5[/C][C]110.835051179528[/C][C]-2.33505117952761[/C][/ROW]
[ROW][C]51[/C][C]108.4[/C][C]108.759323808058[/C][C]-0.359323808057781[/C][/ROW]
[ROW][C]52[/C][C]108.4[/C][C]108.39015580642[/C][C]0.00984419357985189[/C][/ROW]
[ROW][C]53[/C][C]107.9[/C][C]107.505753188124[/C][C]0.394246811876002[/C][/ROW]
[ROW][C]54[/C][C]106.7[/C][C]107.517600253829[/C][C]-0.817600253828545[/C][/ROW]
[ROW][C]55[/C][C]106.9[/C][C]106.171960183599[/C][C]0.728039816401008[/C][/ROW]
[ROW][C]56[/C][C]106.9[/C][C]106.390744236207[/C][C]0.509255763792822[/C][/ROW]
[ROW][C]57[/C][C]106.7[/C][C]106.354535499739[/C][C]0.345464500260846[/C][/ROW]
[ROW][C]58[/C][C]106.7[/C][C]106.201216101092[/C][C]0.49878389890776[/C][/ROW]
[ROW][C]59[/C][C]106.6[/C][C]106.341517691702[/C][C]0.258482308298383[/C][/ROW]
[ROW][C]60[/C][C]107.1[/C][C]106.50129817085[/C][C]0.5987018291504[/C][/ROW]
[/TABLE]
Source: https://freestatistics.org/blog/index.php?pk=&T=2

Globally Unique Identifier (entire table): ba.freestatistics.org/blog/index.php?pk=&T=2

As an alternative you can also use a QR Code:  

The GUIDs for individual cells are displayed in the table below:

Interpolation Forecasts of Exponential Smoothing
tObservedFittedResiduals
13104.9103.3991185897441.50088141025641
14106.2106.320731057573-0.120731057572755
15106.8106.927345289524-0.127345289523916
16107.3107.378239772823-0.0782397728225419
17106.9106.944569559325-0.0445695593248843
18107.1107.139465542648-0.0394655426482871
19106.6107.206495023859-0.606495023858528
20106.8106.6167325697750.183267430224859
21107.1106.7525037080750.347496291924827
22107.5107.063272175010.436727824990399
23107.6107.638645662775-0.0386456627754512
24107.7107.961333383467-0.261333383467203
25108.4108.982875300173-0.582875300173072
26108.8109.747757247237-0.94775724723678
27108.9109.38813317371-0.488133173710324
28109.2109.293715338368-0.0937153383681704
29110.1108.6481634956531.45183650434707
30110.4110.2370697656010.162930234399397
31110.7110.4437559329820.256244067017732
32111110.7540869368310.245913063169297
33111111.000717087581-0.000717087581065812
34111.2110.988954831810.211045168190353
35111.5111.3235205438290.176479456171151
36111.4111.860688734372-0.460688734371729
37111.1112.672903855841-1.57290385584118
38110.6112.367715339136-1.76771533913605
39110.8111.051085370277-0.251085370277124
40110.9111.046125711498-0.146125711497589
41110.8110.2374411730550.562558826945263
42110.9110.6861117261910.213888273809062
43110.6110.710319350854-0.110319350854013
44110.3110.395782978885-0.0957829788849409
45109.7110.003194994108-0.303194994107727
46109.4109.3755517864330.0244482135666289
47109109.182341115666-0.18234111566592
48109.5108.9738040410480.526195958952187
49109.8110.424709952859-0.624709952859263
50108.5110.835051179528-2.33505117952761
51108.4108.759323808058-0.359323808057781
52108.4108.390155806420.00984419357985189
53107.9107.5057531881240.394246811876002
54106.7107.517600253829-0.817600253828545
55106.9106.1719601835990.728039816401008
56106.9106.3907442362070.509255763792822
57106.7106.3545354997390.345464500260846
58106.7106.2012161010920.49878389890776
59106.6106.3415176917020.258482308298383
60107.1106.501298170850.5987018291504


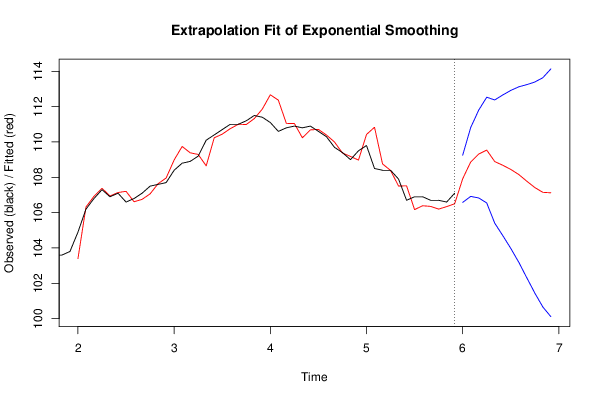
Extrapolation Forecasts of Exponential Smoothing
tForecast95% Lower Bound95% Upper Bound
61107.915734848198106.581134390667109.250335305729
62108.867487753726106.919059028825110.815916478627
63109.317050104576106.83151238004111.802587829113
64109.541423545154106.548715797987112.534131292321
65108.891615509296105.404187866738112.379043151854
66108.682034507356104.703840832715112.660228181998
67108.447319635598103.97758909125112.917050179947
68108.157607851214103.192718963542113.122496738885
69107.779766899554102.314285409055113.245248390053
70107.421043677239101.44834233415113.393745020328
71107.149455815729100.662105561143113.636806070314
72107.123556475802100.113583913425114.133529038179

\begin{tabular}{lllllllll}
\hline
Extrapolation Forecasts of Exponential Smoothing \tabularnewline
t & Forecast & 95% Lower Bound & 95% Upper Bound \tabularnewline
61 & 107.915734848198 & 106.581134390667 & 109.250335305729 \tabularnewline
62 & 108.867487753726 & 106.919059028825 & 110.815916478627 \tabularnewline
63 & 109.317050104576 & 106.83151238004 & 111.802587829113 \tabularnewline
64 & 109.541423545154 & 106.548715797987 & 112.534131292321 \tabularnewline
65 & 108.891615509296 & 105.404187866738 & 112.379043151854 \tabularnewline
66 & 108.682034507356 & 104.703840832715 & 112.660228181998 \tabularnewline
67 & 108.447319635598 & 103.97758909125 & 112.917050179947 \tabularnewline
68 & 108.157607851214 & 103.192718963542 & 113.122496738885 \tabularnewline
69 & 107.779766899554 & 102.314285409055 & 113.245248390053 \tabularnewline
70 & 107.421043677239 & 101.44834233415 & 113.393745020328 \tabularnewline
71 & 107.149455815729 & 100.662105561143 & 113.636806070314 \tabularnewline
72 & 107.123556475802 & 100.113583913425 & 114.133529038179 \tabularnewline
\hline
\end{tabular}
%Source: https://freestatistics.org/blog/index.php?pk=&T=3

[TABLE]
[ROW][C]Extrapolation Forecasts of Exponential Smoothing[/C][/ROW]
[ROW][C]t[/C][C]Forecast[/C][C]95% Lower Bound[/C][C]95% Upper Bound[/C][/ROW]
[ROW][C]61[/C][C]107.915734848198[/C][C]106.581134390667[/C][C]109.250335305729[/C][/ROW]
[ROW][C]62[/C][C]108.867487753726[/C][C]106.919059028825[/C][C]110.815916478627[/C][/ROW]
[ROW][C]63[/C][C]109.317050104576[/C][C]106.83151238004[/C][C]111.802587829113[/C][/ROW]
[ROW][C]64[/C][C]109.541423545154[/C][C]106.548715797987[/C][C]112.534131292321[/C][/ROW]
[ROW][C]65[/C][C]108.891615509296[/C][C]105.404187866738[/C][C]112.379043151854[/C][/ROW]
[ROW][C]66[/C][C]108.682034507356[/C][C]104.703840832715[/C][C]112.660228181998[/C][/ROW]
[ROW][C]67[/C][C]108.447319635598[/C][C]103.97758909125[/C][C]112.917050179947[/C][/ROW]
[ROW][C]68[/C][C]108.157607851214[/C][C]103.192718963542[/C][C]113.122496738885[/C][/ROW]
[ROW][C]69[/C][C]107.779766899554[/C][C]102.314285409055[/C][C]113.245248390053[/C][/ROW]
[ROW][C]70[/C][C]107.421043677239[/C][C]101.44834233415[/C][C]113.393745020328[/C][/ROW]
[ROW][C]71[/C][C]107.149455815729[/C][C]100.662105561143[/C][C]113.636806070314[/C][/ROW]
[ROW][C]72[/C][C]107.123556475802[/C][C]100.113583913425[/C][C]114.133529038179[/C][/ROW]
[/TABLE]
Source: https://freestatistics.org/blog/index.php?pk=&T=3

Globally Unique Identifier (entire table): ba.freestatistics.org/blog/index.php?pk=&T=3

As an alternative you can also use a QR Code:  

The GUIDs for individual cells are displayed in the table below:

Extrapolation Forecasts of Exponential Smoothing
tForecast95% Lower Bound95% Upper Bound
61107.915734848198106.581134390667109.250335305729
62108.867487753726106.919059028825110.815916478627
63109.317050104576106.83151238004111.802587829113
64109.541423545154106.548715797987112.534131292321
65108.891615509296105.404187866738112.379043151854
66108.682034507356104.703840832715112.660228181998
67108.447319635598103.97758909125112.917050179947
68108.157607851214103.192718963542113.122496738885
69107.779766899554102.314285409055113.245248390053
70107.421043677239101.44834233415113.393745020328
71107.149455815729100.662105561143113.636806070314
72107.123556475802100.113583913425114.133529038179


Parameters (Session):
par1 = 12 ; par2 = Triple ; par3 = additive ;
Parameters (R input):
par1 = 12 ; par2 = Triple ; par3 = additive ;
R code (references can be found in the software module):
par1 <- as.numeric(par1)
if (par2 == 'Single') K <- 1
if (par2 == 'Double') K <- 2
if (par2 == 'Triple') K <- par1
nx <- length(x)
nxmK <- nx - K
x <- ts(x, frequency = par1)
if (par2 == 'Single') fit <- HoltWinters(x, gamma=F, beta=F)
if (par2 == 'Double') fit <- HoltWinters(x, gamma=F)
if (par2 == 'Triple') fit <- HoltWinters(x, seasonal=par3)
fit
myresid <- x - fit$fitted[,'xhat']
bitmap(file='test1.png')
op <- par(mfrow=c(2,1))
plot(fit,ylab='Observed (black) / Fitted (red)',main='Interpolation Fit of Exponential Smoothing')
plot(myresid,ylab='Residuals',main='Interpolation Prediction Errors')
par(op)
dev.off()
bitmap(file='test2.png')
p <- predict(fit, par1, prediction.interval=TRUE)
np <- length(p[,1])
plot(fit,p,ylab='Observed (black) / Fitted (red)',main='Extrapolation Fit of Exponential Smoothing')
dev.off()
bitmap(file='test3.png')
op <- par(mfrow = c(2,2))
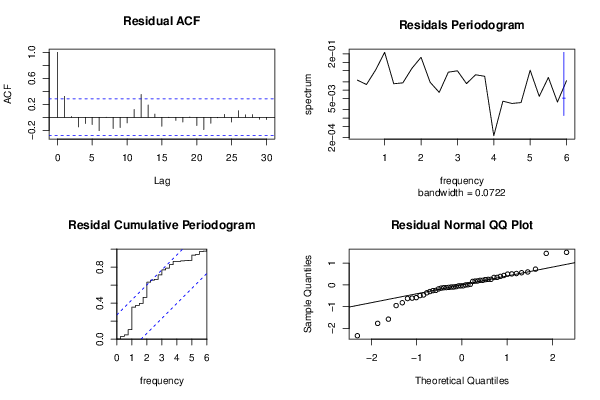
acf(as.numeric(myresid),lag.max = nx/2,main='Residual ACF')
spectrum(myresid,main='Residals Periodogram')
cpgram(myresid,main='Residal Cumulative Periodogram')
qqnorm(myresid,main='Residual Normal QQ Plot')
qqline(myresid)
par(op)
dev.off()
load(file='createtable')
a<-table.start()
a<-table.row.start(a)
a<-table.element(a,'Estimated Parameters of Exponential Smoothing',2,TRUE)
a<-table.row.end(a)
a<-table.row.start(a)
a<-table.element(a,'Parameter',header=TRUE)
a<-table.element(a,'Value',header=TRUE)
a<-table.row.end(a)
a<-table.row.start(a)
a<-table.element(a,'alpha',header=TRUE)
a<-table.element(a,fit$alpha)
a<-table.row.end(a)
a<-table.row.start(a)
a<-table.element(a,'beta',header=TRUE)
a<-table.element(a,fit$beta)
a<-table.row.end(a)
a<-table.row.start(a)
a<-table.element(a,'gamma',header=TRUE)
a<-table.element(a,fit$gamma)
a<-table.row.end(a)
a<-table.end(a)
table.save(a,file='mytable.tab')
a<-table.start()
a<-table.row.start(a)
a<-table.element(a,'Interpolation Forecasts of Exponential Smoothing',4,TRUE)
a<-table.row.end(a)
a<-table.row.start(a)
a<-table.element(a,'t',header=TRUE)
a<-table.element(a,'Observed',header=TRUE)
a<-table.element(a,'Fitted',header=TRUE)
a<-table.element(a,'Residuals',header=TRUE)
a<-table.row.end(a)
for (i in 1:nxmK) {
a<-table.row.start(a)
a<-table.element(a,i+K,header=TRUE)
a<-table.element(a,x[i+K])
a<-table.element(a,fit$fitted[i,'xhat'])
a<-table.element(a,myresid[i])
a<-table.row.end(a)
}
a<-table.end(a)
table.save(a,file='mytable1.tab')
a<-table.start()
a<-table.row.start(a)
a<-table.element(a,'Extrapolation Forecasts of Exponential Smoothing',4,TRUE)
a<-table.row.end(a)
a<-table.row.start(a)
a<-table.element(a,'t',header=TRUE)
a<-table.element(a,'Forecast',header=TRUE)
a<-table.element(a,'95% Lower Bound',header=TRUE)
a<-table.element(a,'95% Upper Bound',header=TRUE)
a<-table.row.end(a)
for (i in 1:np) {
a<-table.row.start(a)
a<-table.element(a,nx+i,header=TRUE)
a<-table.element(a,p[i,'fit'])
a<-table.element(a,p[i,'lwr'])
a<-table.element(a,p[i,'upr'])
a<-table.row.end(a)
}
a<-table.end(a)
table.save(a,file='mytable2.tab')