Free Statistics

of Irreproducible Research!

Author's title

Author*Unverified author*
R Software Modulerwasp_exponentialsmoothing.wasp
Title produced by softwareExponential Smoothing
Date of computationFri, 28 Apr 2017 13:45:03 +0100
Cite this page as followsStatistical Computations at FreeStatistics.org, Office for Research Development and Education, URL https://freestatistics.org/blog/index.php?v=date/2017/Apr/28/t1493383692pq13q6qc0b30heu.htm/, Retrieved Fri, 10 May 2024 18:09:06 +0200
Statistical Computations at FreeStatistics.org, Office for Research Development and Education, URL https://freestatistics.org/blog/index.php?pk=, Retrieved Fri, 10 May 2024 18:09:06 +0200
QR Codes:

Original text written by user:
IsPrivate?No (this computation is public)
User-defined keywordsOpdracht10_oef2
Estimated Impact0
Dataseries X:
3.65
3.66
3.36
3.19
2.81
2.25
2.32
2.85
2.75
2.78
2.26
2.23
1.46
1.19
1.11
1
1.18
1.59
1.51
1.01
0.9
0.63
0.81
0.97
1.14
0.97
0.89
0.62
0.36
0.27
0.34
0.02
-0.12
0.09
-0.11
-0.38
-0.65
-0.4
-0.4
0.29
0.56
0.63
0.46
0.91
1.06
1.28
1.52
1.5
1.74
1.39
2.24
2.04
2.2
2.16
2.28
2.16
1.87
1.81
1.77
2.03
2.65


Summary of computational transaction
Raw Inputview raw input (R code)
Raw Outputview raw output of R engine
Computing time3 seconds
R Server'George Udny Yule' @ yule.wessa.net

\begin{tabular}{lllllllll}
\hline
Summary of computational transaction \tabularnewline
Raw Input & view raw input (R code)  \tabularnewline
Raw Output & view raw output of R engine  \tabularnewline
Computing time & 3 seconds \tabularnewline
R Server & 'George Udny Yule' @ yule.wessa.net \tabularnewline
\hline
\end{tabular}
%Source: https://freestatistics.org/blog/index.php?pk=&T=0

[TABLE]
[ROW][C]Summary of computational transaction[/C][/ROW]
[ROW][C]Raw Input[/C][C]view raw input (R code) [/C][/ROW]
[ROW][C]Raw Output[/C][C]view raw output of R engine [/C][/ROW]
[ROW][C]Computing time[/C][C]3 seconds[/C][/ROW]
[ROW][C]R Server[/C][C]'George Udny Yule' @ yule.wessa.net[/C][/ROW]
[/TABLE]
Source: https://freestatistics.org/blog/index.php?pk=&T=0

Globally Unique Identifier (entire table): ba.freestatistics.org/blog/index.php?pk=&T=0

As an alternative you can also use a QR Code:  

The GUIDs for individual cells are displayed in the table below:

Summary of computational transaction
Raw Inputview raw input (R code)
Raw Outputview raw output of R engine
Computing time3 seconds
R Server'George Udny Yule' @ yule.wessa.net


Estimated Parameters of Exponential Smoothing
ParameterValue
alpha0.999927022282636
betaFALSE
gammaFALSE

\begin{tabular}{lllllllll}
\hline
Estimated Parameters of Exponential Smoothing \tabularnewline
Parameter & Value \tabularnewline
alpha & 0.999927022282636 \tabularnewline
beta & FALSE \tabularnewline
gamma & FALSE \tabularnewline
\hline
\end{tabular}
%Source: https://freestatistics.org/blog/index.php?pk=&T=1

[TABLE]
[ROW][C]Estimated Parameters of Exponential Smoothing[/C][/ROW]
[ROW][C]Parameter[/C][C]Value[/C][/ROW]
[ROW][C]alpha[/C][C]0.999927022282636[/C][/ROW]
[ROW][C]beta[/C][C]FALSE[/C][/ROW]
[ROW][C]gamma[/C][C]FALSE[/C][/ROW]
[/TABLE]
Source: https://freestatistics.org/blog/index.php?pk=&T=1

Globally Unique Identifier (entire table): ba.freestatistics.org/blog/index.php?pk=&T=1

As an alternative you can also use a QR Code:  

The GUIDs for individual cells are displayed in the table below:

Estimated Parameters of Exponential Smoothing
ParameterValue
alpha0.999927022282636
betaFALSE
gammaFALSE


Interpolation Forecasts of Exponential Smoothing
tObservedFittedResiduals
23.663.650.0100000000000002
33.363.65999927022283-0.299999270222826
43.193.36002189326195-0.170021893261952
52.813.19001240780967-0.380012407809672
62.252.81002773243809-0.560027732438092
72.322.250040869545570.0699591304544258
82.852.319994894542350.53000510545765
92.752.84996132143721-0.0999613214372124
102.782.750007294949060.0299927050509363
112.262.77999781120085-0.519997811200848
122.232.2600379482533-0.0300379482532955
131.462.2300021921009-0.770002192100898
141.191.46005619300235-0.270056193002345
151.111.19001970808453-0.0800197080845253
1611.11000583965564-0.11000583965564
171.181.000008027975070.179991972024925
181.591.179986864596740.410013135403262
191.511.58997007817729-0.079970078177289
201.011.51000583603376-0.500005836033763
210.91.01003648928458-0.110036489284583
220.630.900008030211815-0.270008030211815
230.810.6300197045697150.179980295430285
240.970.8099868654488690.160013134551131
251.140.9699883226066920.170011677393308
260.971.13998759293586-0.169987592935859
270.890.970012405306513-0.0800124053065128
280.620.8900058391227-0.2700058391227
290.360.620019704409814-0.260019704409814
300.270.360018975644498-0.0900189756444976
310.340.2700065693793620.069993430620638
320.020.339994892039203-0.319994892039203
33-0.120.0200233524967893-0.140023352496789
340.09-0.1199897814153570.209989781415357
35-0.110.0899846754250824-0.199984675425082
36-0.38-0.10998540557488-0.27001459442512
37-0.65-0.379980294951244-0.270019705048756
38-0.4-0.6499802945782820.249980294578282
39-0.4-0.4000182429912841.82429912844451e-05
400.29-0.4000000013313320.690000001331332
410.560.2899496453749210.270050354625079
420.630.5599802923415460.0700197076584539
430.460.629994890121565-0.169994890121564
440.910.4600124058390450.449987594160955
451.060.9099671609325360.150032839067464
461.281.059989050945880.220010949054125
471.521.279983944103140.240016055896857
481.51.51998248417611-0.0199824841761098
491.741.500001458276080.239998541723918
501.391.73998248545425-0.349982485454254
512.241.390025540922910.849974459077094
522.042.23993797080416-0.199937970804159
532.22.040014591016720.159985408983276
542.162.19998832463004-0.0399883246300408
552.282.160002918256650.119997081743347
562.162.27999124288688-0.119991242886884
571.872.16000875668701-0.29000875668701
581.811.87002116417708-0.0600211641770789
591.771.81000438020756-0.0400043802075554
602.031.770002919428350.259997080571648
612.652.029981026006540.620018973993462

\begin{tabular}{lllllllll}
\hline
Interpolation Forecasts of Exponential Smoothing \tabularnewline
t & Observed & Fitted & Residuals \tabularnewline
2 & 3.66 & 3.65 & 0.0100000000000002 \tabularnewline
3 & 3.36 & 3.65999927022283 & -0.299999270222826 \tabularnewline
4 & 3.19 & 3.36002189326195 & -0.170021893261952 \tabularnewline
5 & 2.81 & 3.19001240780967 & -0.380012407809672 \tabularnewline
6 & 2.25 & 2.81002773243809 & -0.560027732438092 \tabularnewline
7 & 2.32 & 2.25004086954557 & 0.0699591304544258 \tabularnewline
8 & 2.85 & 2.31999489454235 & 0.53000510545765 \tabularnewline
9 & 2.75 & 2.84996132143721 & -0.0999613214372124 \tabularnewline
10 & 2.78 & 2.75000729494906 & 0.0299927050509363 \tabularnewline
11 & 2.26 & 2.77999781120085 & -0.519997811200848 \tabularnewline
12 & 2.23 & 2.2600379482533 & -0.0300379482532955 \tabularnewline
13 & 1.46 & 2.2300021921009 & -0.770002192100898 \tabularnewline
14 & 1.19 & 1.46005619300235 & -0.270056193002345 \tabularnewline
15 & 1.11 & 1.19001970808453 & -0.0800197080845253 \tabularnewline
16 & 1 & 1.11000583965564 & -0.11000583965564 \tabularnewline
17 & 1.18 & 1.00000802797507 & 0.179991972024925 \tabularnewline
18 & 1.59 & 1.17998686459674 & 0.410013135403262 \tabularnewline
19 & 1.51 & 1.58997007817729 & -0.079970078177289 \tabularnewline
20 & 1.01 & 1.51000583603376 & -0.500005836033763 \tabularnewline
21 & 0.9 & 1.01003648928458 & -0.110036489284583 \tabularnewline
22 & 0.63 & 0.900008030211815 & -0.270008030211815 \tabularnewline
23 & 0.81 & 0.630019704569715 & 0.179980295430285 \tabularnewline
24 & 0.97 & 0.809986865448869 & 0.160013134551131 \tabularnewline
25 & 1.14 & 0.969988322606692 & 0.170011677393308 \tabularnewline
26 & 0.97 & 1.13998759293586 & -0.169987592935859 \tabularnewline
27 & 0.89 & 0.970012405306513 & -0.0800124053065128 \tabularnewline
28 & 0.62 & 0.8900058391227 & -0.2700058391227 \tabularnewline
29 & 0.36 & 0.620019704409814 & -0.260019704409814 \tabularnewline
30 & 0.27 & 0.360018975644498 & -0.0900189756444976 \tabularnewline
31 & 0.34 & 0.270006569379362 & 0.069993430620638 \tabularnewline
32 & 0.02 & 0.339994892039203 & -0.319994892039203 \tabularnewline
33 & -0.12 & 0.0200233524967893 & -0.140023352496789 \tabularnewline
34 & 0.09 & -0.119989781415357 & 0.209989781415357 \tabularnewline
35 & -0.11 & 0.0899846754250824 & -0.199984675425082 \tabularnewline
36 & -0.38 & -0.10998540557488 & -0.27001459442512 \tabularnewline
37 & -0.65 & -0.379980294951244 & -0.270019705048756 \tabularnewline
38 & -0.4 & -0.649980294578282 & 0.249980294578282 \tabularnewline
39 & -0.4 & -0.400018242991284 & 1.82429912844451e-05 \tabularnewline
40 & 0.29 & -0.400000001331332 & 0.690000001331332 \tabularnewline
41 & 0.56 & 0.289949645374921 & 0.270050354625079 \tabularnewline
42 & 0.63 & 0.559980292341546 & 0.0700197076584539 \tabularnewline
43 & 0.46 & 0.629994890121565 & -0.169994890121564 \tabularnewline
44 & 0.91 & 0.460012405839045 & 0.449987594160955 \tabularnewline
45 & 1.06 & 0.909967160932536 & 0.150032839067464 \tabularnewline
46 & 1.28 & 1.05998905094588 & 0.220010949054125 \tabularnewline
47 & 1.52 & 1.27998394410314 & 0.240016055896857 \tabularnewline
48 & 1.5 & 1.51998248417611 & -0.0199824841761098 \tabularnewline
49 & 1.74 & 1.50000145827608 & 0.239998541723918 \tabularnewline
50 & 1.39 & 1.73998248545425 & -0.349982485454254 \tabularnewline
51 & 2.24 & 1.39002554092291 & 0.849974459077094 \tabularnewline
52 & 2.04 & 2.23993797080416 & -0.199937970804159 \tabularnewline
53 & 2.2 & 2.04001459101672 & 0.159985408983276 \tabularnewline
54 & 2.16 & 2.19998832463004 & -0.0399883246300408 \tabularnewline
55 & 2.28 & 2.16000291825665 & 0.119997081743347 \tabularnewline
56 & 2.16 & 2.27999124288688 & -0.119991242886884 \tabularnewline
57 & 1.87 & 2.16000875668701 & -0.29000875668701 \tabularnewline
58 & 1.81 & 1.87002116417708 & -0.0600211641770789 \tabularnewline
59 & 1.77 & 1.81000438020756 & -0.0400043802075554 \tabularnewline
60 & 2.03 & 1.77000291942835 & 0.259997080571648 \tabularnewline
61 & 2.65 & 2.02998102600654 & 0.620018973993462 \tabularnewline
\hline
\end{tabular}
%Source: https://freestatistics.org/blog/index.php?pk=&T=2

[TABLE]
[ROW][C]Interpolation Forecasts of Exponential Smoothing[/C][/ROW]
[ROW][C]t[/C][C]Observed[/C][C]Fitted[/C][C]Residuals[/C][/ROW]
[ROW][C]2[/C][C]3.66[/C][C]3.65[/C][C]0.0100000000000002[/C][/ROW]
[ROW][C]3[/C][C]3.36[/C][C]3.65999927022283[/C][C]-0.299999270222826[/C][/ROW]
[ROW][C]4[/C][C]3.19[/C][C]3.36002189326195[/C][C]-0.170021893261952[/C][/ROW]
[ROW][C]5[/C][C]2.81[/C][C]3.19001240780967[/C][C]-0.380012407809672[/C][/ROW]
[ROW][C]6[/C][C]2.25[/C][C]2.81002773243809[/C][C]-0.560027732438092[/C][/ROW]
[ROW][C]7[/C][C]2.32[/C][C]2.25004086954557[/C][C]0.0699591304544258[/C][/ROW]
[ROW][C]8[/C][C]2.85[/C][C]2.31999489454235[/C][C]0.53000510545765[/C][/ROW]
[ROW][C]9[/C][C]2.75[/C][C]2.84996132143721[/C][C]-0.0999613214372124[/C][/ROW]
[ROW][C]10[/C][C]2.78[/C][C]2.75000729494906[/C][C]0.0299927050509363[/C][/ROW]
[ROW][C]11[/C][C]2.26[/C][C]2.77999781120085[/C][C]-0.519997811200848[/C][/ROW]
[ROW][C]12[/C][C]2.23[/C][C]2.2600379482533[/C][C]-0.0300379482532955[/C][/ROW]
[ROW][C]13[/C][C]1.46[/C][C]2.2300021921009[/C][C]-0.770002192100898[/C][/ROW]
[ROW][C]14[/C][C]1.19[/C][C]1.46005619300235[/C][C]-0.270056193002345[/C][/ROW]
[ROW][C]15[/C][C]1.11[/C][C]1.19001970808453[/C][C]-0.0800197080845253[/C][/ROW]
[ROW][C]16[/C][C]1[/C][C]1.11000583965564[/C][C]-0.11000583965564[/C][/ROW]
[ROW][C]17[/C][C]1.18[/C][C]1.00000802797507[/C][C]0.179991972024925[/C][/ROW]
[ROW][C]18[/C][C]1.59[/C][C]1.17998686459674[/C][C]0.410013135403262[/C][/ROW]
[ROW][C]19[/C][C]1.51[/C][C]1.58997007817729[/C][C]-0.079970078177289[/C][/ROW]
[ROW][C]20[/C][C]1.01[/C][C]1.51000583603376[/C][C]-0.500005836033763[/C][/ROW]
[ROW][C]21[/C][C]0.9[/C][C]1.01003648928458[/C][C]-0.110036489284583[/C][/ROW]
[ROW][C]22[/C][C]0.63[/C][C]0.900008030211815[/C][C]-0.270008030211815[/C][/ROW]
[ROW][C]23[/C][C]0.81[/C][C]0.630019704569715[/C][C]0.179980295430285[/C][/ROW]
[ROW][C]24[/C][C]0.97[/C][C]0.809986865448869[/C][C]0.160013134551131[/C][/ROW]
[ROW][C]25[/C][C]1.14[/C][C]0.969988322606692[/C][C]0.170011677393308[/C][/ROW]
[ROW][C]26[/C][C]0.97[/C][C]1.13998759293586[/C][C]-0.169987592935859[/C][/ROW]
[ROW][C]27[/C][C]0.89[/C][C]0.970012405306513[/C][C]-0.0800124053065128[/C][/ROW]
[ROW][C]28[/C][C]0.62[/C][C]0.8900058391227[/C][C]-0.2700058391227[/C][/ROW]
[ROW][C]29[/C][C]0.36[/C][C]0.620019704409814[/C][C]-0.260019704409814[/C][/ROW]
[ROW][C]30[/C][C]0.27[/C][C]0.360018975644498[/C][C]-0.0900189756444976[/C][/ROW]
[ROW][C]31[/C][C]0.34[/C][C]0.270006569379362[/C][C]0.069993430620638[/C][/ROW]
[ROW][C]32[/C][C]0.02[/C][C]0.339994892039203[/C][C]-0.319994892039203[/C][/ROW]
[ROW][C]33[/C][C]-0.12[/C][C]0.0200233524967893[/C][C]-0.140023352496789[/C][/ROW]
[ROW][C]34[/C][C]0.09[/C][C]-0.119989781415357[/C][C]0.209989781415357[/C][/ROW]
[ROW][C]35[/C][C]-0.11[/C][C]0.0899846754250824[/C][C]-0.199984675425082[/C][/ROW]
[ROW][C]36[/C][C]-0.38[/C][C]-0.10998540557488[/C][C]-0.27001459442512[/C][/ROW]
[ROW][C]37[/C][C]-0.65[/C][C]-0.379980294951244[/C][C]-0.270019705048756[/C][/ROW]
[ROW][C]38[/C][C]-0.4[/C][C]-0.649980294578282[/C][C]0.249980294578282[/C][/ROW]
[ROW][C]39[/C][C]-0.4[/C][C]-0.400018242991284[/C][C]1.82429912844451e-05[/C][/ROW]
[ROW][C]40[/C][C]0.29[/C][C]-0.400000001331332[/C][C]0.690000001331332[/C][/ROW]
[ROW][C]41[/C][C]0.56[/C][C]0.289949645374921[/C][C]0.270050354625079[/C][/ROW]
[ROW][C]42[/C][C]0.63[/C][C]0.559980292341546[/C][C]0.0700197076584539[/C][/ROW]
[ROW][C]43[/C][C]0.46[/C][C]0.629994890121565[/C][C]-0.169994890121564[/C][/ROW]
[ROW][C]44[/C][C]0.91[/C][C]0.460012405839045[/C][C]0.449987594160955[/C][/ROW]
[ROW][C]45[/C][C]1.06[/C][C]0.909967160932536[/C][C]0.150032839067464[/C][/ROW]
[ROW][C]46[/C][C]1.28[/C][C]1.05998905094588[/C][C]0.220010949054125[/C][/ROW]
[ROW][C]47[/C][C]1.52[/C][C]1.27998394410314[/C][C]0.240016055896857[/C][/ROW]
[ROW][C]48[/C][C]1.5[/C][C]1.51998248417611[/C][C]-0.0199824841761098[/C][/ROW]
[ROW][C]49[/C][C]1.74[/C][C]1.50000145827608[/C][C]0.239998541723918[/C][/ROW]
[ROW][C]50[/C][C]1.39[/C][C]1.73998248545425[/C][C]-0.349982485454254[/C][/ROW]
[ROW][C]51[/C][C]2.24[/C][C]1.39002554092291[/C][C]0.849974459077094[/C][/ROW]
[ROW][C]52[/C][C]2.04[/C][C]2.23993797080416[/C][C]-0.199937970804159[/C][/ROW]
[ROW][C]53[/C][C]2.2[/C][C]2.04001459101672[/C][C]0.159985408983276[/C][/ROW]
[ROW][C]54[/C][C]2.16[/C][C]2.19998832463004[/C][C]-0.0399883246300408[/C][/ROW]
[ROW][C]55[/C][C]2.28[/C][C]2.16000291825665[/C][C]0.119997081743347[/C][/ROW]
[ROW][C]56[/C][C]2.16[/C][C]2.27999124288688[/C][C]-0.119991242886884[/C][/ROW]
[ROW][C]57[/C][C]1.87[/C][C]2.16000875668701[/C][C]-0.29000875668701[/C][/ROW]
[ROW][C]58[/C][C]1.81[/C][C]1.87002116417708[/C][C]-0.0600211641770789[/C][/ROW]
[ROW][C]59[/C][C]1.77[/C][C]1.81000438020756[/C][C]-0.0400043802075554[/C][/ROW]
[ROW][C]60[/C][C]2.03[/C][C]1.77000291942835[/C][C]0.259997080571648[/C][/ROW]
[ROW][C]61[/C][C]2.65[/C][C]2.02998102600654[/C][C]0.620018973993462[/C][/ROW]
[/TABLE]
Source: https://freestatistics.org/blog/index.php?pk=&T=2

Globally Unique Identifier (entire table): ba.freestatistics.org/blog/index.php?pk=&T=2

As an alternative you can also use a QR Code:  

The GUIDs for individual cells are displayed in the table below:

Interpolation Forecasts of Exponential Smoothing
tObservedFittedResiduals
23.663.650.0100000000000002
33.363.65999927022283-0.299999270222826
43.193.36002189326195-0.170021893261952
52.813.19001240780967-0.380012407809672
62.252.81002773243809-0.560027732438092
72.322.250040869545570.0699591304544258
82.852.319994894542350.53000510545765
92.752.84996132143721-0.0999613214372124
102.782.750007294949060.0299927050509363
112.262.77999781120085-0.519997811200848
122.232.2600379482533-0.0300379482532955
131.462.2300021921009-0.770002192100898
141.191.46005619300235-0.270056193002345
151.111.19001970808453-0.0800197080845253
1611.11000583965564-0.11000583965564
171.181.000008027975070.179991972024925
181.591.179986864596740.410013135403262
191.511.58997007817729-0.079970078177289
201.011.51000583603376-0.500005836033763
210.91.01003648928458-0.110036489284583
220.630.900008030211815-0.270008030211815
230.810.6300197045697150.179980295430285
240.970.8099868654488690.160013134551131
251.140.9699883226066920.170011677393308
260.971.13998759293586-0.169987592935859
270.890.970012405306513-0.0800124053065128
280.620.8900058391227-0.2700058391227
290.360.620019704409814-0.260019704409814
300.270.360018975644498-0.0900189756444976
310.340.2700065693793620.069993430620638
320.020.339994892039203-0.319994892039203
33-0.120.0200233524967893-0.140023352496789
340.09-0.1199897814153570.209989781415357
35-0.110.0899846754250824-0.199984675425082
36-0.38-0.10998540557488-0.27001459442512
37-0.65-0.379980294951244-0.270019705048756
38-0.4-0.6499802945782820.249980294578282
39-0.4-0.4000182429912841.82429912844451e-05
400.29-0.4000000013313320.690000001331332
410.560.2899496453749210.270050354625079
420.630.5599802923415460.0700197076584539
430.460.629994890121565-0.169994890121564
440.910.4600124058390450.449987594160955
451.060.9099671609325360.150032839067464
461.281.059989050945880.220010949054125
471.521.279983944103140.240016055896857
481.51.51998248417611-0.0199824841761098
491.741.500001458276080.239998541723918
501.391.73998248545425-0.349982485454254
512.241.390025540922910.849974459077094
522.042.23993797080416-0.199937970804159
532.22.040014591016720.159985408983276
542.162.19998832463004-0.0399883246300408
552.282.160002918256650.119997081743347
562.162.27999124288688-0.119991242886884
571.872.16000875668701-0.29000875668701
581.811.87002116417708-0.0600211641770789
591.771.81000438020756-0.0400043802075554
602.031.770002919428350.259997080571648
612.652.029981026006540.620018973993462


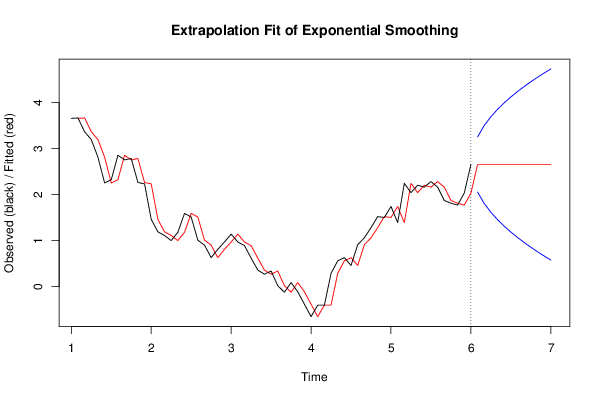
Extrapolation Forecasts of Exponential Smoothing
tForecast95% Lower Bound95% Upper Bound
622.649954752430562.051602451627423.24830705323369
632.649954752430561.803787689791283.49612181506983
642.649954752430561.613628587598863.68628091726225
652.649954752430561.453315649804393.84659385505672
662.649954752430561.312076445575583.98783305928553
672.649954752430561.184386062135794.11552344272532
682.649954752430561.06696239363934.23294711122181
692.649954752430560.9576669429812674.34224256187984
702.649954752430560.8550142932426054.44489521161851
712.649954752430560.7579229149476254.54198658991348
722.649954752430560.6655763368887484.63433316797236
732.649954752430560.5773402397709074.7225692650902

\begin{tabular}{lllllllll}
\hline
Extrapolation Forecasts of Exponential Smoothing \tabularnewline
t & Forecast & 95% Lower Bound & 95% Upper Bound \tabularnewline
62 & 2.64995475243056 & 2.05160245162742 & 3.24830705323369 \tabularnewline
63 & 2.64995475243056 & 1.80378768979128 & 3.49612181506983 \tabularnewline
64 & 2.64995475243056 & 1.61362858759886 & 3.68628091726225 \tabularnewline
65 & 2.64995475243056 & 1.45331564980439 & 3.84659385505672 \tabularnewline
66 & 2.64995475243056 & 1.31207644557558 & 3.98783305928553 \tabularnewline
67 & 2.64995475243056 & 1.18438606213579 & 4.11552344272532 \tabularnewline
68 & 2.64995475243056 & 1.0669623936393 & 4.23294711122181 \tabularnewline
69 & 2.64995475243056 & 0.957666942981267 & 4.34224256187984 \tabularnewline
70 & 2.64995475243056 & 0.855014293242605 & 4.44489521161851 \tabularnewline
71 & 2.64995475243056 & 0.757922914947625 & 4.54198658991348 \tabularnewline
72 & 2.64995475243056 & 0.665576336888748 & 4.63433316797236 \tabularnewline
73 & 2.64995475243056 & 0.577340239770907 & 4.7225692650902 \tabularnewline
\hline
\end{tabular}
%Source: https://freestatistics.org/blog/index.php?pk=&T=3

[TABLE]
[ROW][C]Extrapolation Forecasts of Exponential Smoothing[/C][/ROW]
[ROW][C]t[/C][C]Forecast[/C][C]95% Lower Bound[/C][C]95% Upper Bound[/C][/ROW]
[ROW][C]62[/C][C]2.64995475243056[/C][C]2.05160245162742[/C][C]3.24830705323369[/C][/ROW]
[ROW][C]63[/C][C]2.64995475243056[/C][C]1.80378768979128[/C][C]3.49612181506983[/C][/ROW]
[ROW][C]64[/C][C]2.64995475243056[/C][C]1.61362858759886[/C][C]3.68628091726225[/C][/ROW]
[ROW][C]65[/C][C]2.64995475243056[/C][C]1.45331564980439[/C][C]3.84659385505672[/C][/ROW]
[ROW][C]66[/C][C]2.64995475243056[/C][C]1.31207644557558[/C][C]3.98783305928553[/C][/ROW]
[ROW][C]67[/C][C]2.64995475243056[/C][C]1.18438606213579[/C][C]4.11552344272532[/C][/ROW]
[ROW][C]68[/C][C]2.64995475243056[/C][C]1.0669623936393[/C][C]4.23294711122181[/C][/ROW]
[ROW][C]69[/C][C]2.64995475243056[/C][C]0.957666942981267[/C][C]4.34224256187984[/C][/ROW]
[ROW][C]70[/C][C]2.64995475243056[/C][C]0.855014293242605[/C][C]4.44489521161851[/C][/ROW]
[ROW][C]71[/C][C]2.64995475243056[/C][C]0.757922914947625[/C][C]4.54198658991348[/C][/ROW]
[ROW][C]72[/C][C]2.64995475243056[/C][C]0.665576336888748[/C][C]4.63433316797236[/C][/ROW]
[ROW][C]73[/C][C]2.64995475243056[/C][C]0.577340239770907[/C][C]4.7225692650902[/C][/ROW]
[/TABLE]
Source: https://freestatistics.org/blog/index.php?pk=&T=3

Globally Unique Identifier (entire table): ba.freestatistics.org/blog/index.php?pk=&T=3

As an alternative you can also use a QR Code:  

The GUIDs for individual cells are displayed in the table below:

Extrapolation Forecasts of Exponential Smoothing
tForecast95% Lower Bound95% Upper Bound
622.649954752430562.051602451627423.24830705323369
632.649954752430561.803787689791283.49612181506983
642.649954752430561.613628587598863.68628091726225
652.649954752430561.453315649804393.84659385505672
662.649954752430561.312076445575583.98783305928553
672.649954752430561.184386062135794.11552344272532
682.649954752430561.06696239363934.23294711122181
692.649954752430560.9576669429812674.34224256187984
702.649954752430560.8550142932426054.44489521161851
712.649954752430560.7579229149476254.54198658991348
722.649954752430560.6655763368887484.63433316797236
732.649954752430560.5773402397709074.7225692650902


Parameters (Session):
par1 = 12 ; par2 = Single ; par3 = additive ;
Parameters (R input):
par1 = 12 ; par2 = Single ; par3 = additive ;
R code (references can be found in the software module):
par1 <- as.numeric(par1)
if (par2 == 'Single') K <- 1
if (par2 == 'Double') K <- 2
if (par2 == 'Triple') K <- par1
nx <- length(x)
nxmK <- nx - K
x <- ts(x, frequency = par1)
if (par2 == 'Single') fit <- HoltWinters(x, gamma=F, beta=F)
if (par2 == 'Double') fit <- HoltWinters(x, gamma=F)
if (par2 == 'Triple') fit <- HoltWinters(x, seasonal=par3)
fit
myresid <- x - fit$fitted[,'xhat']
bitmap(file='test1.png')
op <- par(mfrow=c(2,1))
plot(fit,ylab='Observed (black) / Fitted (red)',main='Interpolation Fit of Exponential Smoothing')
plot(myresid,ylab='Residuals',main='Interpolation Prediction Errors')
par(op)
dev.off()
bitmap(file='test2.png')
p <- predict(fit, par1, prediction.interval=TRUE)
np <- length(p[,1])
plot(fit,p,ylab='Observed (black) / Fitted (red)',main='Extrapolation Fit of Exponential Smoothing')
dev.off()
bitmap(file='test3.png')
op <- par(mfrow = c(2,2))
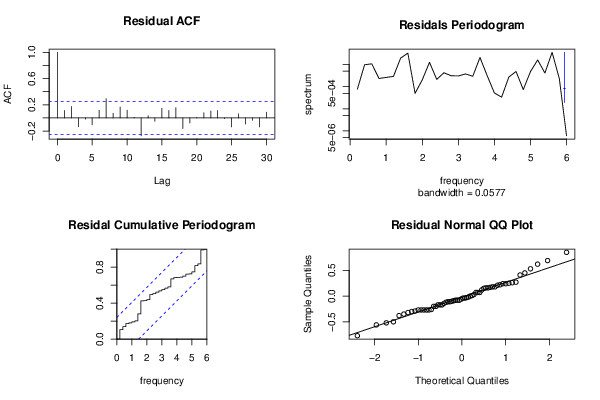
acf(as.numeric(myresid),lag.max = nx/2,main='Residual ACF')
spectrum(myresid,main='Residals Periodogram')
cpgram(myresid,main='Residal Cumulative Periodogram')
qqnorm(myresid,main='Residual Normal QQ Plot')
qqline(myresid)
par(op)
dev.off()
load(file='createtable')
a<-table.start()
a<-table.row.start(a)
a<-table.element(a,'Estimated Parameters of Exponential Smoothing',2,TRUE)
a<-table.row.end(a)
a<-table.row.start(a)
a<-table.element(a,'Parameter',header=TRUE)
a<-table.element(a,'Value',header=TRUE)
a<-table.row.end(a)
a<-table.row.start(a)
a<-table.element(a,'alpha',header=TRUE)
a<-table.element(a,fit$alpha)
a<-table.row.end(a)
a<-table.row.start(a)
a<-table.element(a,'beta',header=TRUE)
a<-table.element(a,fit$beta)
a<-table.row.end(a)
a<-table.row.start(a)
a<-table.element(a,'gamma',header=TRUE)
a<-table.element(a,fit$gamma)
a<-table.row.end(a)
a<-table.end(a)
table.save(a,file='mytable.tab')
a<-table.start()
a<-table.row.start(a)
a<-table.element(a,'Interpolation Forecasts of Exponential Smoothing',4,TRUE)
a<-table.row.end(a)
a<-table.row.start(a)
a<-table.element(a,'t',header=TRUE)
a<-table.element(a,'Observed',header=TRUE)
a<-table.element(a,'Fitted',header=TRUE)
a<-table.element(a,'Residuals',header=TRUE)
a<-table.row.end(a)
for (i in 1:nxmK) {
a<-table.row.start(a)
a<-table.element(a,i+K,header=TRUE)
a<-table.element(a,x[i+K])
a<-table.element(a,fit$fitted[i,'xhat'])
a<-table.element(a,myresid[i])
a<-table.row.end(a)
}
a<-table.end(a)
table.save(a,file='mytable1.tab')
a<-table.start()
a<-table.row.start(a)
a<-table.element(a,'Extrapolation Forecasts of Exponential Smoothing',4,TRUE)
a<-table.row.end(a)
a<-table.row.start(a)
a<-table.element(a,'t',header=TRUE)
a<-table.element(a,'Forecast',header=TRUE)
a<-table.element(a,'95% Lower Bound',header=TRUE)
a<-table.element(a,'95% Upper Bound',header=TRUE)
a<-table.row.end(a)
for (i in 1:np) {
a<-table.row.start(a)
a<-table.element(a,nx+i,header=TRUE)
a<-table.element(a,p[i,'fit'])
a<-table.element(a,p[i,'lwr'])
a<-table.element(a,p[i,'upr'])
a<-table.row.end(a)
}
a<-table.end(a)
table.save(a,file='mytable2.tab')