Free Statistics

of Irreproducible Research!

Author's title

Standard Deviation/Mean Plot - Aantal werkloze vrouwen x1000 - Lola Borghgr...

Author*Unverified author*
R Software Modulerwasp_smp.wasp
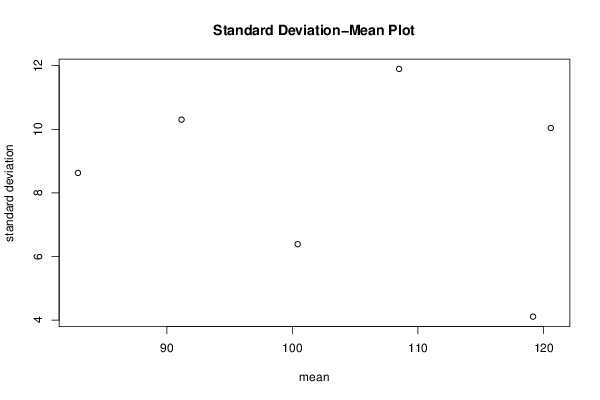
Title produced by softwareStandard Deviation-Mean Plot
Date of computationTue, 25 Apr 2017 22:07:53 +0100
Cite this page as followsStatistical Computations at FreeStatistics.org, Office for Research Development and Education, URL https://freestatistics.org/blog/index.php?v=date/2017/Apr/25/t1493154539w015ftml8wtkesu.htm/, Retrieved Sun, 12 May 2024 03:42:22 +0200
Statistical Computations at FreeStatistics.org, Office for Research Development and Education, URL https://freestatistics.org/blog/index.php?pk=, Retrieved Sun, 12 May 2024 03:42:22 +0200
QR Codes:

Original text written by user:
IsPrivate?No (this computation is public)
User-defined keywords
Estimated Impact0
Dataseries X:
88
90
82
75
79
70
71
75
89
92
94
90
102
98
100
98
100
91
93
92
106
109
108
108
118
119
124
118
119
113
114
115
125
125
118
122
132
133
136
128
126
114
108
107
117
119
113
114
124
125
124
118
111
99
94
93
107
107
103
97
103
107
104
101
92
85
83
77
90
87
87
78


Summary of computational transaction
Raw Inputview raw input (R code)
Raw Outputview raw output of R engine
Computing time1 seconds
R Server'Gwilym Jenkins' @ jenkins.wessa.net

\begin{tabular}{lllllllll}
\hline
Summary of computational transaction \tabularnewline
Raw Input & view raw input (R code)  \tabularnewline
Raw Output & view raw output of R engine  \tabularnewline
Computing time & 1 seconds \tabularnewline
R Server & 'Gwilym Jenkins' @ jenkins.wessa.net \tabularnewline
\hline
\end{tabular}
%Source: https://freestatistics.org/blog/index.php?pk=&T=0

[TABLE]
[ROW][C]Summary of computational transaction[/C][/ROW]
[ROW][C]Raw Input[/C][C]view raw input (R code) [/C][/ROW]
[ROW][C]Raw Output[/C][C]view raw output of R engine [/C][/ROW]
[ROW][C]Computing time[/C][C]1 seconds[/C][/ROW]
[ROW][C]R Server[/C][C]'Gwilym Jenkins' @ jenkins.wessa.net[/C][/ROW]
[/TABLE]
Source: https://freestatistics.org/blog/index.php?pk=&T=0

Globally Unique Identifier (entire table): ba.freestatistics.org/blog/index.php?pk=&T=0

As an alternative you can also use a QR Code:  

The GUIDs for individual cells are displayed in the table below:

Summary of computational transaction
Raw Inputview raw input (R code)
Raw Outputview raw output of R engine
Computing time1 seconds
R Server'Gwilym Jenkins' @ jenkins.wessa.net


Standard Deviation-Mean Plot
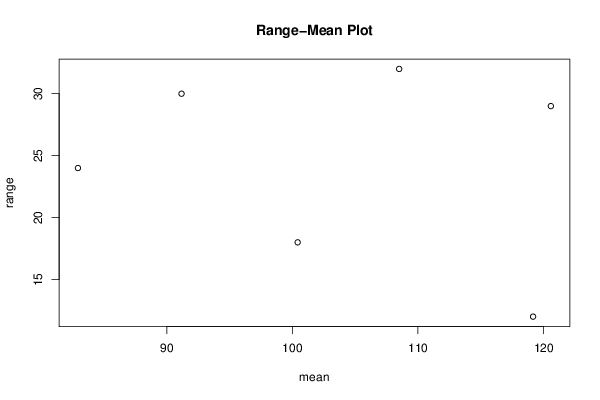
SectionMeanStandard DeviationRange
182.91666666666678.6282657409800324
2100.4166666666676.3883179367190318
3119.1666666666674.1083802013430912
4120.58333333333310.040448498976829
5108.511.897287697011232
691.166666666666710.302985739654130

\begin{tabular}{lllllllll}
\hline
Standard Deviation-Mean Plot \tabularnewline
Section & Mean & Standard Deviation & Range \tabularnewline
1 & 82.9166666666667 & 8.62826574098003 & 24 \tabularnewline
2 & 100.416666666667 & 6.38831793671903 & 18 \tabularnewline
3 & 119.166666666667 & 4.10838020134309 & 12 \tabularnewline
4 & 120.583333333333 & 10.0404484989768 & 29 \tabularnewline
5 & 108.5 & 11.8972876970112 & 32 \tabularnewline
6 & 91.1666666666667 & 10.3029857396541 & 30 \tabularnewline
\hline
\end{tabular}
%Source: https://freestatistics.org/blog/index.php?pk=&T=1

[TABLE]
[ROW][C]Standard Deviation-Mean Plot[/C][/ROW]
[ROW][C]Section[/C][C]Mean[/C][C]Standard Deviation[/C][C]Range[/C][/ROW]
[ROW][C]1[/C][C]82.9166666666667[/C][C]8.62826574098003[/C][C]24[/C][/ROW]
[ROW][C]2[/C][C]100.416666666667[/C][C]6.38831793671903[/C][C]18[/C][/ROW]
[ROW][C]3[/C][C]119.166666666667[/C][C]4.10838020134309[/C][C]12[/C][/ROW]
[ROW][C]4[/C][C]120.583333333333[/C][C]10.0404484989768[/C][C]29[/C][/ROW]
[ROW][C]5[/C][C]108.5[/C][C]11.8972876970112[/C][C]32[/C][/ROW]
[ROW][C]6[/C][C]91.1666666666667[/C][C]10.3029857396541[/C][C]30[/C][/ROW]
[/TABLE]
Source: https://freestatistics.org/blog/index.php?pk=&T=1

Globally Unique Identifier (entire table): ba.freestatistics.org/blog/index.php?pk=&T=1

As an alternative you can also use a QR Code:  

The GUIDs for individual cells are displayed in the table below:

Standard Deviation-Mean Plot
SectionMeanStandard DeviationRange
182.91666666666678.6282657409800324
2100.4166666666676.3883179367190318
3119.1666666666674.1083802013430912
4120.58333333333310.040448498976829
5108.511.897287697011232
691.166666666666710.302985739654130


Regression: S.E.(k) = alpha + beta * Mean(k)
alpha12.5397500612254
beta-0.0383345075113098
S.D.0.0924540511487746
T-STAT-0.414633074862484
p-value0.699682788805942

\begin{tabular}{lllllllll}
\hline
Regression: S.E.(k) = alpha + beta * Mean(k) \tabularnewline
alpha & 12.5397500612254 \tabularnewline
beta & -0.0383345075113098 \tabularnewline
S.D. & 0.0924540511487746 \tabularnewline
T-STAT & -0.414633074862484 \tabularnewline
p-value & 0.699682788805942 \tabularnewline
\hline
\end{tabular}
%Source: https://freestatistics.org/blog/index.php?pk=&T=2

[TABLE]
[ROW][C]Regression: S.E.(k) = alpha + beta * Mean(k)[/C][/ROW]
[ROW][C]alpha[/C][C]12.5397500612254[/C][/ROW]
[ROW][C]beta[/C][C]-0.0383345075113098[/C][/ROW]
[ROW][C]S.D.[/C][C]0.0924540511487746[/C][/ROW]
[ROW][C]T-STAT[/C][C]-0.414633074862484[/C][/ROW]
[ROW][C]p-value[/C][C]0.699682788805942[/C][/ROW]
[/TABLE]
Source: https://freestatistics.org/blog/index.php?pk=&T=2

Globally Unique Identifier (entire table): ba.freestatistics.org/blog/index.php?pk=&T=2

As an alternative you can also use a QR Code:  

The GUIDs for individual cells are displayed in the table below:

Regression: S.E.(k) = alpha + beta * Mean(k)
alpha12.5397500612254
beta-0.0383345075113098
S.D.0.0924540511487746
T-STAT-0.414633074862484
p-value0.699682788805942


Regression: ln S.E.(k) = alpha + beta * ln Mean(k)
alpha5.50823288881331
beta-0.737837430742525
S.D.1.26448272809937
T-STAT-0.583509299373004
p-value0.590868397934254
Lambda1.73783743074253

\begin{tabular}{lllllllll}
\hline
Regression: ln S.E.(k) = alpha + beta * ln Mean(k) \tabularnewline
alpha & 5.50823288881331 \tabularnewline
beta & -0.737837430742525 \tabularnewline
S.D. & 1.26448272809937 \tabularnewline
T-STAT & -0.583509299373004 \tabularnewline
p-value & 0.590868397934254 \tabularnewline
Lambda & 1.73783743074253 \tabularnewline
\hline
\end{tabular}
%Source: https://freestatistics.org/blog/index.php?pk=&T=3

[TABLE]
[ROW][C]Regression: ln S.E.(k) = alpha + beta * ln Mean(k)[/C][/ROW]
[ROW][C]alpha[/C][C]5.50823288881331[/C][/ROW]
[ROW][C]beta[/C][C]-0.737837430742525[/C][/ROW]
[ROW][C]S.D.[/C][C]1.26448272809937[/C][/ROW]
[ROW][C]T-STAT[/C][C]-0.583509299373004[/C][/ROW]
[ROW][C]p-value[/C][C]0.590868397934254[/C][/ROW]
[ROW][C]Lambda[/C][C]1.73783743074253[/C][/ROW]
[/TABLE]
Source: https://freestatistics.org/blog/index.php?pk=&T=3

Globally Unique Identifier (entire table): ba.freestatistics.org/blog/index.php?pk=&T=3

As an alternative you can also use a QR Code:  

The GUIDs for individual cells are displayed in the table below:

Regression: ln S.E.(k) = alpha + beta * ln Mean(k)
alpha5.50823288881331
beta-0.737837430742525
S.D.1.26448272809937
T-STAT-0.583509299373004
p-value0.590868397934254
Lambda1.73783743074253


Parameters (Session):
par1 = 12 ;
Parameters (R input):
par1 = 12 ;
R code (references can be found in the software module):
par1 <- as.numeric(par1)
(n <- length(x))
(np <- floor(n / par1))
arr <- array(NA,dim=c(par1,np))
j <- 0
k <- 1
for (i in 1:(np*par1))
{
j = j + 1
arr[j,k] <- x[i]
if (j == par1) {
j = 0
k=k+1
}
}
arr
arr.mean <- array(NA,dim=np)
arr.sd <- array(NA,dim=np)
arr.range <- array(NA,dim=np)
for (j in 1:np)
{
arr.mean[j] <- mean(arr[,j],na.rm=TRUE)
arr.sd[j] <- sd(arr[,j],na.rm=TRUE)
arr.range[j] <- max(arr[,j],na.rm=TRUE) - min(arr[,j],na.rm=TRUE)
}
arr.mean
arr.sd
arr.range
(lm1 <- lm(arr.sd~arr.mean))
(lnlm1 <- lm(log(arr.sd)~log(arr.mean)))
(lm2 <- lm(arr.range~arr.mean))
bitmap(file='test1.png')
plot(arr.mean,arr.sd,main='Standard Deviation-Mean Plot',xlab='mean',ylab='standard deviation')
dev.off()
bitmap(file='test2.png')
plot(arr.mean,arr.range,main='Range-Mean Plot',xlab='mean',ylab='range')
dev.off()
load(file='createtable')
a<-table.start()
a<-table.row.start(a)
a<-table.element(a,'Standard Deviation-Mean Plot',4,TRUE)
a<-table.row.end(a)
a<-table.row.start(a)
a<-table.element(a,'Section',header=TRUE)
a<-table.element(a,'Mean',header=TRUE)
a<-table.element(a,'Standard Deviation',header=TRUE)
a<-table.element(a,'Range',header=TRUE)
a<-table.row.end(a)
for (j in 1:np) {
a<-table.row.start(a)
a<-table.element(a,j,header=TRUE)
a<-table.element(a,arr.mean[j])
a<-table.element(a,arr.sd[j] )
a<-table.element(a,arr.range[j] )
a<-table.row.end(a)
}
a<-table.end(a)
table.save(a,file='mytable.tab')
a<-table.start()
a<-table.row.start(a)
a<-table.element(a,'Regression: S.E.(k) = alpha + beta * Mean(k)',2,TRUE)
a<-table.row.end(a)
a<-table.row.start(a)
a<-table.element(a,'alpha',header=TRUE)
a<-table.element(a,lm1$coefficients[[1]])
a<-table.row.end(a)
a<-table.row.start(a)
a<-table.element(a,'beta',header=TRUE)
a<-table.element(a,lm1$coefficients[[2]])
a<-table.row.end(a)
a<-table.row.start(a)
a<-table.element(a,'S.D.',header=TRUE)
a<-table.element(a,summary(lm1)$coefficients[2,2])
a<-table.row.end(a)
a<-table.row.start(a)
a<-table.element(a,'T-STAT',header=TRUE)
a<-table.element(a,summary(lm1)$coefficients[2,3])
a<-table.row.end(a)
a<-table.row.start(a)
a<-table.element(a,'p-value',header=TRUE)
a<-table.element(a,summary(lm1)$coefficients[2,4])
a<-table.row.end(a)
a<-table.end(a)
table.save(a,file='mytable1.tab')
a<-table.start()
a<-table.row.start(a)
a<-table.element(a,'Regression: ln S.E.(k) = alpha + beta * ln Mean(k)',2,TRUE)
a<-table.row.end(a)
a<-table.row.start(a)
a<-table.element(a,'alpha',header=TRUE)
a<-table.element(a,lnlm1$coefficients[[1]])
a<-table.row.end(a)
a<-table.row.start(a)
a<-table.element(a,'beta',header=TRUE)
a<-table.element(a,lnlm1$coefficients[[2]])
a<-table.row.end(a)
a<-table.row.start(a)
a<-table.element(a,'S.D.',header=TRUE)
a<-table.element(a,summary(lnlm1)$coefficients[2,2])
a<-table.row.end(a)
a<-table.row.start(a)
a<-table.element(a,'T-STAT',header=TRUE)
a<-table.element(a,summary(lnlm1)$coefficients[2,3])
a<-table.row.end(a)
a<-table.row.start(a)
a<-table.element(a,'p-value',header=TRUE)
a<-table.element(a,summary(lnlm1)$coefficients[2,4])
a<-table.row.end(a)
a<-table.row.start(a)
a<-table.element(a,'Lambda',header=TRUE)
a<-table.element(a,1-lnlm1$coefficients[[2]])
a<-table.row.end(a)
a<-table.end(a)
table.save(a,file='mytable2.tab')