Free Statistics

of Irreproducible Research!

Author's title

Author*Unverified author*
R Software Modulerwasp_smp.wasp
Title produced by softwareStandard Deviation-Mean Plot
Date of computationTue, 25 Apr 2017 12:41:56 +0100
Cite this page as followsStatistical Computations at FreeStatistics.org, Office for Research Development and Education, URL https://freestatistics.org/blog/index.php?v=date/2017/Apr/25/t1493120562ihizn2lmw5c9ur8.htm/, Retrieved Sat, 11 May 2024 15:41:57 +0200
Statistical Computations at FreeStatistics.org, Office for Research Development and Education, URL https://freestatistics.org/blog/index.php?pk=, Retrieved Sat, 11 May 2024 15:41:57 +0200
QR Codes:

Original text written by user:
IsPrivate?No (this computation is public)
User-defined keywords
Estimated Impact0
Dataseries X:
8899
8899
9093
9093
9093
9116
9116
9116
10073
10073
10073
9223
9223
9223
9151
9151
9151
6727
6727
6727
7232
7232
7232
6370
6370
6370
6862
6862
6862
7029
7029
7029
7031
7031
7031
7223
7223
7223
8065
8065
8065
7657
7657
7657
7328
7328
7328
7115
7115
7115
7926
7926
7926
8681
8681
8681
8670
8670
8670
8028
8028


Summary of computational transaction
Raw Inputview raw input (R code)
Raw Outputview raw output of R engine
Computing time1 seconds
R Server'Sir Ronald Aylmer Fisher' @ fisher.wessa.net

\begin{tabular}{lllllllll}
\hline
Summary of computational transaction \tabularnewline
Raw Input & view raw input (R code)  \tabularnewline
Raw Output & view raw output of R engine  \tabularnewline
Computing time & 1 seconds \tabularnewline
R Server & 'Sir Ronald Aylmer Fisher' @ fisher.wessa.net \tabularnewline
\hline
\end{tabular}
%Source: https://freestatistics.org/blog/index.php?pk=&T=0

[TABLE]
[ROW][C]Summary of computational transaction[/C][/ROW]
[ROW][C]Raw Input[/C][C]view raw input (R code) [/C][/ROW]
[ROW][C]Raw Output[/C][C]view raw output of R engine [/C][/ROW]
[ROW][C]Computing time[/C][C]1 seconds[/C][/ROW]
[ROW][C]R Server[/C][C]'Sir Ronald Aylmer Fisher' @ fisher.wessa.net[/C][/ROW]
[/TABLE]
Source: https://freestatistics.org/blog/index.php?pk=&T=0

Globally Unique Identifier (entire table): ba.freestatistics.org/blog/index.php?pk=&T=0

As an alternative you can also use a QR Code:  

The GUIDs for individual cells are displayed in the table below:

Summary of computational transaction
Raw Inputview raw input (R code)
Raw Outputview raw output of R engine
Computing time1 seconds
R Server'Sir Ronald Aylmer Fisher' @ fisher.wessa.net


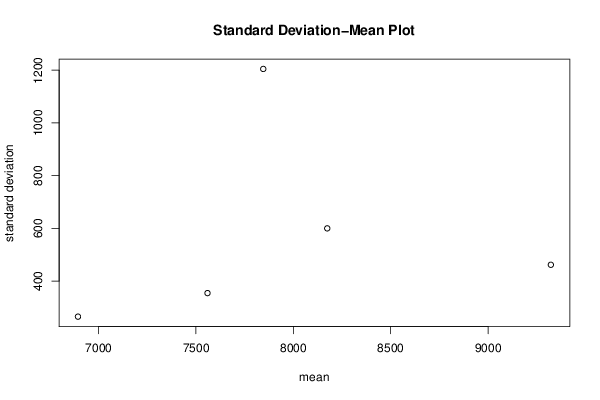
Standard Deviation-Mean Plot
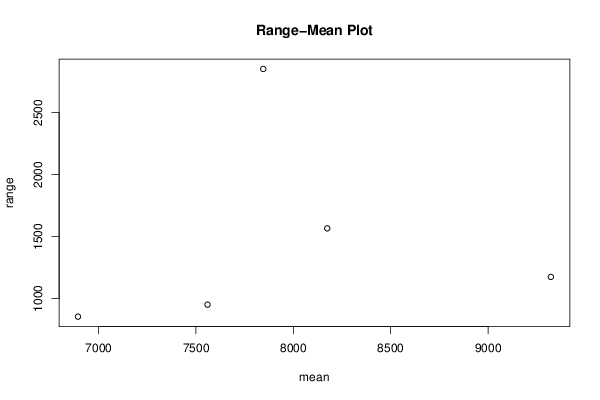
SectionMeanStandard DeviationRange
19322.25461.6464851731541174
27845.51204.815225365592853
36894.08333333333264.82359766227853
47559.25354.186680361437950
58174.08333333333599.8473227464311566

\begin{tabular}{lllllllll}
\hline
Standard Deviation-Mean Plot \tabularnewline
Section & Mean & Standard Deviation & Range \tabularnewline
1 & 9322.25 & 461.646485173154 & 1174 \tabularnewline
2 & 7845.5 & 1204.81522536559 & 2853 \tabularnewline
3 & 6894.08333333333 & 264.82359766227 & 853 \tabularnewline
4 & 7559.25 & 354.186680361437 & 950 \tabularnewline
5 & 8174.08333333333 & 599.847322746431 & 1566 \tabularnewline
\hline
\end{tabular}
%Source: https://freestatistics.org/blog/index.php?pk=&T=1

[TABLE]
[ROW][C]Standard Deviation-Mean Plot[/C][/ROW]
[ROW][C]Section[/C][C]Mean[/C][C]Standard Deviation[/C][C]Range[/C][/ROW]
[ROW][C]1[/C][C]9322.25[/C][C]461.646485173154[/C][C]1174[/C][/ROW]
[ROW][C]2[/C][C]7845.5[/C][C]1204.81522536559[/C][C]2853[/C][/ROW]
[ROW][C]3[/C][C]6894.08333333333[/C][C]264.82359766227[/C][C]853[/C][/ROW]
[ROW][C]4[/C][C]7559.25[/C][C]354.186680361437[/C][C]950[/C][/ROW]
[ROW][C]5[/C][C]8174.08333333333[/C][C]599.847322746431[/C][C]1566[/C][/ROW]
[/TABLE]
Source: https://freestatistics.org/blog/index.php?pk=&T=1

Globally Unique Identifier (entire table): ba.freestatistics.org/blog/index.php?pk=&T=1

As an alternative you can also use a QR Code:  

The GUIDs for individual cells are displayed in the table below:

Standard Deviation-Mean Plot
SectionMeanStandard DeviationRange
19322.25461.6464851731541174
27845.51204.815225365592853
36894.08333333333264.82359766227853
47559.25354.186680361437950
58174.08333333333599.8473227464311566


Regression: S.E.(k) = alpha + beta * Mean(k)
alpha86.5691668469894
beta0.0616274206768979
S.D.0.23737920058481
T-STAT0.259615924752766
p-value0.811956849686926

\begin{tabular}{lllllllll}
\hline
Regression: S.E.(k) = alpha + beta * Mean(k) \tabularnewline
alpha & 86.5691668469894 \tabularnewline
beta & 0.0616274206768979 \tabularnewline
S.D. & 0.23737920058481 \tabularnewline
T-STAT & 0.259615924752766 \tabularnewline
p-value & 0.811956849686926 \tabularnewline
\hline
\end{tabular}
%Source: https://freestatistics.org/blog/index.php?pk=&T=2

[TABLE]
[ROW][C]Regression: S.E.(k) = alpha + beta * Mean(k)[/C][/ROW]
[ROW][C]alpha[/C][C]86.5691668469894[/C][/ROW]
[ROW][C]beta[/C][C]0.0616274206768979[/C][/ROW]
[ROW][C]S.D.[/C][C]0.23737920058481[/C][/ROW]
[ROW][C]T-STAT[/C][C]0.259615924752766[/C][/ROW]
[ROW][C]p-value[/C][C]0.811956849686926[/C][/ROW]
[/TABLE]
Source: https://freestatistics.org/blog/index.php?pk=&T=2

Globally Unique Identifier (entire table): ba.freestatistics.org/blog/index.php?pk=&T=2

As an alternative you can also use a QR Code:  

The GUIDs for individual cells are displayed in the table below:

Regression: S.E.(k) = alpha + beta * Mean(k)
alpha86.5691668469894
beta0.0616274206768979
S.D.0.23737920058481
T-STAT0.259615924752766
p-value0.811956849686926


Regression: ln S.E.(k) = alpha + beta * ln Mean(k)
alpha-10.0038134119209
beta1.80667401854433
S.D.2.825674009779
T-STAT0.639378078395402
p-value0.568051726605682
Lambda-0.806674018544325

\begin{tabular}{lllllllll}
\hline
Regression: ln S.E.(k) = alpha + beta * ln Mean(k) \tabularnewline
alpha & -10.0038134119209 \tabularnewline
beta & 1.80667401854433 \tabularnewline
S.D. & 2.825674009779 \tabularnewline
T-STAT & 0.639378078395402 \tabularnewline
p-value & 0.568051726605682 \tabularnewline
Lambda & -0.806674018544325 \tabularnewline
\hline
\end{tabular}
%Source: https://freestatistics.org/blog/index.php?pk=&T=3

[TABLE]
[ROW][C]Regression: ln S.E.(k) = alpha + beta * ln Mean(k)[/C][/ROW]
[ROW][C]alpha[/C][C]-10.0038134119209[/C][/ROW]
[ROW][C]beta[/C][C]1.80667401854433[/C][/ROW]
[ROW][C]S.D.[/C][C]2.825674009779[/C][/ROW]
[ROW][C]T-STAT[/C][C]0.639378078395402[/C][/ROW]
[ROW][C]p-value[/C][C]0.568051726605682[/C][/ROW]
[ROW][C]Lambda[/C][C]-0.806674018544325[/C][/ROW]
[/TABLE]
Source: https://freestatistics.org/blog/index.php?pk=&T=3

Globally Unique Identifier (entire table): ba.freestatistics.org/blog/index.php?pk=&T=3

As an alternative you can also use a QR Code:  

The GUIDs for individual cells are displayed in the table below:

Regression: ln S.E.(k) = alpha + beta * ln Mean(k)
alpha-10.0038134119209
beta1.80667401854433
S.D.2.825674009779
T-STAT0.639378078395402
p-value0.568051726605682
Lambda-0.806674018544325


Parameters (Session):
par1 = 12 ;
Parameters (R input):
par1 = 12 ;
R code (references can be found in the software module):
par1 <- as.numeric(par1)
(n <- length(x))
(np <- floor(n / par1))
arr <- array(NA,dim=c(par1,np))
j <- 0
k <- 1
for (i in 1:(np*par1))
{
j = j + 1
arr[j,k] <- x[i]
if (j == par1) {
j = 0
k=k+1
}
}
arr
arr.mean <- array(NA,dim=np)
arr.sd <- array(NA,dim=np)
arr.range <- array(NA,dim=np)
for (j in 1:np)
{
arr.mean[j] <- mean(arr[,j],na.rm=TRUE)
arr.sd[j] <- sd(arr[,j],na.rm=TRUE)
arr.range[j] <- max(arr[,j],na.rm=TRUE) - min(arr[,j],na.rm=TRUE)
}
arr.mean
arr.sd
arr.range
(lm1 <- lm(arr.sd~arr.mean))
(lnlm1 <- lm(log(arr.sd)~log(arr.mean)))
(lm2 <- lm(arr.range~arr.mean))
bitmap(file='test1.png')
plot(arr.mean,arr.sd,main='Standard Deviation-Mean Plot',xlab='mean',ylab='standard deviation')
dev.off()
bitmap(file='test2.png')
plot(arr.mean,arr.range,main='Range-Mean Plot',xlab='mean',ylab='range')
dev.off()
load(file='createtable')
a<-table.start()
a<-table.row.start(a)
a<-table.element(a,'Standard Deviation-Mean Plot',4,TRUE)
a<-table.row.end(a)
a<-table.row.start(a)
a<-table.element(a,'Section',header=TRUE)
a<-table.element(a,'Mean',header=TRUE)
a<-table.element(a,'Standard Deviation',header=TRUE)
a<-table.element(a,'Range',header=TRUE)
a<-table.row.end(a)
for (j in 1:np) {
a<-table.row.start(a)
a<-table.element(a,j,header=TRUE)
a<-table.element(a,arr.mean[j])
a<-table.element(a,arr.sd[j] )
a<-table.element(a,arr.range[j] )
a<-table.row.end(a)
}
a<-table.end(a)
table.save(a,file='mytable.tab')
a<-table.start()
a<-table.row.start(a)
a<-table.element(a,'Regression: S.E.(k) = alpha + beta * Mean(k)',2,TRUE)
a<-table.row.end(a)
a<-table.row.start(a)
a<-table.element(a,'alpha',header=TRUE)
a<-table.element(a,lm1$coefficients[[1]])
a<-table.row.end(a)
a<-table.row.start(a)
a<-table.element(a,'beta',header=TRUE)
a<-table.element(a,lm1$coefficients[[2]])
a<-table.row.end(a)
a<-table.row.start(a)
a<-table.element(a,'S.D.',header=TRUE)
a<-table.element(a,summary(lm1)$coefficients[2,2])
a<-table.row.end(a)
a<-table.row.start(a)
a<-table.element(a,'T-STAT',header=TRUE)
a<-table.element(a,summary(lm1)$coefficients[2,3])
a<-table.row.end(a)
a<-table.row.start(a)
a<-table.element(a,'p-value',header=TRUE)
a<-table.element(a,summary(lm1)$coefficients[2,4])
a<-table.row.end(a)
a<-table.end(a)
table.save(a,file='mytable1.tab')
a<-table.start()
a<-table.row.start(a)
a<-table.element(a,'Regression: ln S.E.(k) = alpha + beta * ln Mean(k)',2,TRUE)
a<-table.row.end(a)
a<-table.row.start(a)
a<-table.element(a,'alpha',header=TRUE)
a<-table.element(a,lnlm1$coefficients[[1]])
a<-table.row.end(a)
a<-table.row.start(a)
a<-table.element(a,'beta',header=TRUE)
a<-table.element(a,lnlm1$coefficients[[2]])
a<-table.row.end(a)
a<-table.row.start(a)
a<-table.element(a,'S.D.',header=TRUE)
a<-table.element(a,summary(lnlm1)$coefficients[2,2])
a<-table.row.end(a)
a<-table.row.start(a)
a<-table.element(a,'T-STAT',header=TRUE)
a<-table.element(a,summary(lnlm1)$coefficients[2,3])
a<-table.row.end(a)
a<-table.row.start(a)
a<-table.element(a,'p-value',header=TRUE)
a<-table.element(a,summary(lnlm1)$coefficients[2,4])
a<-table.row.end(a)
a<-table.row.start(a)
a<-table.element(a,'Lambda',header=TRUE)
a<-table.element(a,1-lnlm1$coefficients[[2]])
a<-table.row.end(a)
a<-table.end(a)
table.save(a,file='mytable2.tab')