Free Statistics

of Irreproducible Research!

Author's title

Author*Unverified author*
R Software Modulerwasp_autocorrelation.wasp
Title produced by software(Partial) Autocorrelation Function
Date of computationFri, 21 Oct 2016 15:30:31 +0100
Cite this page as followsStatistical Computations at FreeStatistics.org, Office for Research Development and Education, URL https://freestatistics.org/blog/index.php?v=date/2016/Oct/21/t1477060342sgax5c7ypamck6i.htm/, Retrieved Fri, 17 May 2024 03:23:25 +0200
Statistical Computations at FreeStatistics.org, Office for Research Development and Education, URL https://freestatistics.org/blog/index.php?pk=, Retrieved Fri, 17 May 2024 03:23:25 +0200
QR Codes:

Original text written by user:
IsPrivate?No (this computation is public)
User-defined keywords
Estimated Impact0
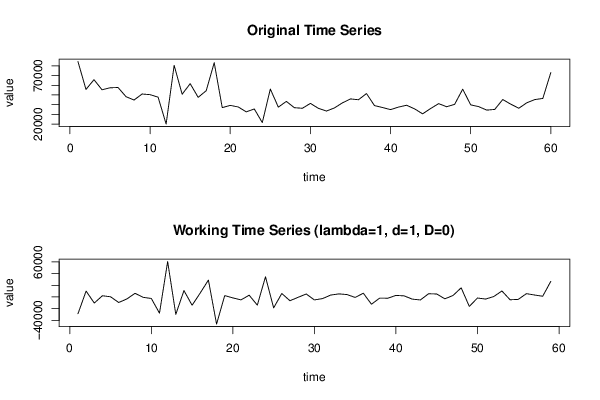
Dataseries X:
84543
55735
65814
55382
57422
57729
48213
44789
50998
50328
47719
19946
80608
50747
61687
47539
54412
83362
36911
39254
37597
32557
35537
21500
56125
37432
43347
36870
36247
41293
36190
33381
36609
41861
45926
45079
51469
39013
37036
34865
37505
39379
35653
30515
35984
41068
37851
40333
56004
39797
37960
34357
35069
45299
40475
36277
41910
45234
46425
73241


Summary of computational transaction
Raw Inputview raw input (R code)
Raw Outputview raw output of R engine
Computing time1 seconds
R Server'Herman Ole Andreas Wold' @ wold.wessa.net

\begin{tabular}{lllllllll}
\hline
Summary of computational transaction \tabularnewline
Raw Input & view raw input (R code)  \tabularnewline
Raw Output & view raw output of R engine  \tabularnewline
Computing time & 1 seconds \tabularnewline
R Server & 'Herman Ole Andreas Wold' @ wold.wessa.net \tabularnewline
\hline
\end{tabular}
%Source: https://freestatistics.org/blog/index.php?pk=&T=0

[TABLE]
[ROW][C]Summary of computational transaction[/C][/ROW]
[ROW][C]Raw Input[/C][C]view raw input (R code) [/C][/ROW]
[ROW][C]Raw Output[/C][C]view raw output of R engine [/C][/ROW]
[ROW][C]Computing time[/C][C]1 seconds[/C][/ROW]
[ROW][C]R Server[/C][C]'Herman Ole Andreas Wold' @ wold.wessa.net[/C][/ROW]
[/TABLE]
Source: https://freestatistics.org/blog/index.php?pk=&T=0

Globally Unique Identifier (entire table): ba.freestatistics.org/blog/index.php?pk=&T=0

As an alternative you can also use a QR Code:  

The GUIDs for individual cells are displayed in the table below:

Summary of computational transaction
Raw Inputview raw input (R code)
Raw Outputview raw output of R engine
Computing time1 seconds
R Server'Herman Ole Andreas Wold' @ wold.wessa.net


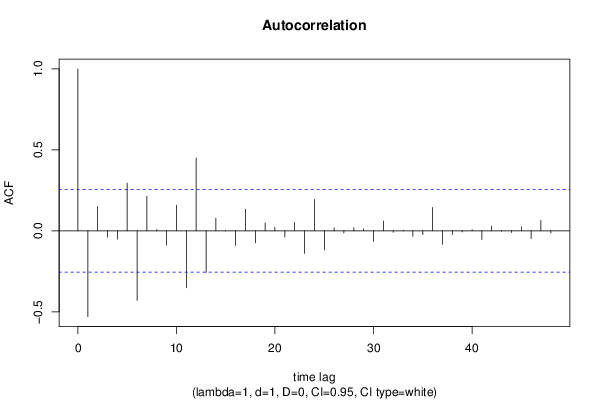
Autocorrelation Function
Time lag kACF(k)T-STATP-value
1-0.53013-4.0727e-05
20.1497861.15050.127284
3-0.03947-0.30320.381411
4-0.051334-0.39430.347388
50.2949262.26540.013588
6-0.429783-3.30120.000819
70.2135411.64020.053138
80.0081430.06250.47517
9-0.088491-0.67970.249673
100.1585591.21790.114052
11-0.351528-2.70010.004515
120.4496953.45420.000514
13-0.256723-1.97190.026656
140.0778060.59760.276184
15-0.001396-0.01070.495741
16-0.090512-0.69520.244818
170.1330441.02190.155492
18-0.074208-0.570.285419
190.0488540.37530.354407
200.0226680.17410.431185
21-0.037942-0.29140.385868
220.0520430.39970.345394
23-0.139337-1.07030.144428
240.1933591.48520.071405
25-0.117856-0.90530.184502
260.0182920.14050.444371
27-0.013374-0.10270.459265
280.0188970.14520.442543
290.0115560.08880.464786
30-0.064869-0.49830.310073
310.0598630.45980.323668
32-0.008541-0.06560.473956
330.0036380.02790.4889
34-0.033059-0.25390.400217
35-0.02313-0.17770.429797
360.144111.10690.136409
37-0.083603-0.64220.261625
38-0.022743-0.17470.43096
39-0.0065-0.04990.480176
400.0070070.05380.478629
41-0.053561-0.41140.341132
420.0289730.22250.412328
43-0.002491-0.01910.492401
44-0.010598-0.08140.467697
450.0245960.18890.4254
46-0.047883-0.36780.357171
470.0643450.49420.311486
48-0.012682-0.09740.461365

\begin{tabular}{lllllllll}
\hline
Autocorrelation Function \tabularnewline
Time lag k & ACF(k) & T-STAT & P-value \tabularnewline
1 & -0.53013 & -4.072 & 7e-05 \tabularnewline
2 & 0.149786 & 1.1505 & 0.127284 \tabularnewline
3 & -0.03947 & -0.3032 & 0.381411 \tabularnewline
4 & -0.051334 & -0.3943 & 0.347388 \tabularnewline
5 & 0.294926 & 2.2654 & 0.013588 \tabularnewline
6 & -0.429783 & -3.3012 & 0.000819 \tabularnewline
7 & 0.213541 & 1.6402 & 0.053138 \tabularnewline
8 & 0.008143 & 0.0625 & 0.47517 \tabularnewline
9 & -0.088491 & -0.6797 & 0.249673 \tabularnewline
10 & 0.158559 & 1.2179 & 0.114052 \tabularnewline
11 & -0.351528 & -2.7001 & 0.004515 \tabularnewline
12 & 0.449695 & 3.4542 & 0.000514 \tabularnewline
13 & -0.256723 & -1.9719 & 0.026656 \tabularnewline
14 & 0.077806 & 0.5976 & 0.276184 \tabularnewline
15 & -0.001396 & -0.0107 & 0.495741 \tabularnewline
16 & -0.090512 & -0.6952 & 0.244818 \tabularnewline
17 & 0.133044 & 1.0219 & 0.155492 \tabularnewline
18 & -0.074208 & -0.57 & 0.285419 \tabularnewline
19 & 0.048854 & 0.3753 & 0.354407 \tabularnewline
20 & 0.022668 & 0.1741 & 0.431185 \tabularnewline
21 & -0.037942 & -0.2914 & 0.385868 \tabularnewline
22 & 0.052043 & 0.3997 & 0.345394 \tabularnewline
23 & -0.139337 & -1.0703 & 0.144428 \tabularnewline
24 & 0.193359 & 1.4852 & 0.071405 \tabularnewline
25 & -0.117856 & -0.9053 & 0.184502 \tabularnewline
26 & 0.018292 & 0.1405 & 0.444371 \tabularnewline
27 & -0.013374 & -0.1027 & 0.459265 \tabularnewline
28 & 0.018897 & 0.1452 & 0.442543 \tabularnewline
29 & 0.011556 & 0.0888 & 0.464786 \tabularnewline
30 & -0.064869 & -0.4983 & 0.310073 \tabularnewline
31 & 0.059863 & 0.4598 & 0.323668 \tabularnewline
32 & -0.008541 & -0.0656 & 0.473956 \tabularnewline
33 & 0.003638 & 0.0279 & 0.4889 \tabularnewline
34 & -0.033059 & -0.2539 & 0.400217 \tabularnewline
35 & -0.02313 & -0.1777 & 0.429797 \tabularnewline
36 & 0.14411 & 1.1069 & 0.136409 \tabularnewline
37 & -0.083603 & -0.6422 & 0.261625 \tabularnewline
38 & -0.022743 & -0.1747 & 0.43096 \tabularnewline
39 & -0.0065 & -0.0499 & 0.480176 \tabularnewline
40 & 0.007007 & 0.0538 & 0.478629 \tabularnewline
41 & -0.053561 & -0.4114 & 0.341132 \tabularnewline
42 & 0.028973 & 0.2225 & 0.412328 \tabularnewline
43 & -0.002491 & -0.0191 & 0.492401 \tabularnewline
44 & -0.010598 & -0.0814 & 0.467697 \tabularnewline
45 & 0.024596 & 0.1889 & 0.4254 \tabularnewline
46 & -0.047883 & -0.3678 & 0.357171 \tabularnewline
47 & 0.064345 & 0.4942 & 0.311486 \tabularnewline
48 & -0.012682 & -0.0974 & 0.461365 \tabularnewline
\hline
\end{tabular}
%Source: https://freestatistics.org/blog/index.php?pk=&T=1

[TABLE]
[ROW][C]Autocorrelation Function[/C][/ROW]
[ROW][C]Time lag k[/C][C]ACF(k)[/C][C]T-STAT[/C][C]P-value[/C][/ROW]
[ROW][C]1[/C][C]-0.53013[/C][C]-4.072[/C][C]7e-05[/C][/ROW]
[ROW][C]2[/C][C]0.149786[/C][C]1.1505[/C][C]0.127284[/C][/ROW]
[ROW][C]3[/C][C]-0.03947[/C][C]-0.3032[/C][C]0.381411[/C][/ROW]
[ROW][C]4[/C][C]-0.051334[/C][C]-0.3943[/C][C]0.347388[/C][/ROW]
[ROW][C]5[/C][C]0.294926[/C][C]2.2654[/C][C]0.013588[/C][/ROW]
[ROW][C]6[/C][C]-0.429783[/C][C]-3.3012[/C][C]0.000819[/C][/ROW]
[ROW][C]7[/C][C]0.213541[/C][C]1.6402[/C][C]0.053138[/C][/ROW]
[ROW][C]8[/C][C]0.008143[/C][C]0.0625[/C][C]0.47517[/C][/ROW]
[ROW][C]9[/C][C]-0.088491[/C][C]-0.6797[/C][C]0.249673[/C][/ROW]
[ROW][C]10[/C][C]0.158559[/C][C]1.2179[/C][C]0.114052[/C][/ROW]
[ROW][C]11[/C][C]-0.351528[/C][C]-2.7001[/C][C]0.004515[/C][/ROW]
[ROW][C]12[/C][C]0.449695[/C][C]3.4542[/C][C]0.000514[/C][/ROW]
[ROW][C]13[/C][C]-0.256723[/C][C]-1.9719[/C][C]0.026656[/C][/ROW]
[ROW][C]14[/C][C]0.077806[/C][C]0.5976[/C][C]0.276184[/C][/ROW]
[ROW][C]15[/C][C]-0.001396[/C][C]-0.0107[/C][C]0.495741[/C][/ROW]
[ROW][C]16[/C][C]-0.090512[/C][C]-0.6952[/C][C]0.244818[/C][/ROW]
[ROW][C]17[/C][C]0.133044[/C][C]1.0219[/C][C]0.155492[/C][/ROW]
[ROW][C]18[/C][C]-0.074208[/C][C]-0.57[/C][C]0.285419[/C][/ROW]
[ROW][C]19[/C][C]0.048854[/C][C]0.3753[/C][C]0.354407[/C][/ROW]
[ROW][C]20[/C][C]0.022668[/C][C]0.1741[/C][C]0.431185[/C][/ROW]
[ROW][C]21[/C][C]-0.037942[/C][C]-0.2914[/C][C]0.385868[/C][/ROW]
[ROW][C]22[/C][C]0.052043[/C][C]0.3997[/C][C]0.345394[/C][/ROW]
[ROW][C]23[/C][C]-0.139337[/C][C]-1.0703[/C][C]0.144428[/C][/ROW]
[ROW][C]24[/C][C]0.193359[/C][C]1.4852[/C][C]0.071405[/C][/ROW]
[ROW][C]25[/C][C]-0.117856[/C][C]-0.9053[/C][C]0.184502[/C][/ROW]
[ROW][C]26[/C][C]0.018292[/C][C]0.1405[/C][C]0.444371[/C][/ROW]
[ROW][C]27[/C][C]-0.013374[/C][C]-0.1027[/C][C]0.459265[/C][/ROW]
[ROW][C]28[/C][C]0.018897[/C][C]0.1452[/C][C]0.442543[/C][/ROW]
[ROW][C]29[/C][C]0.011556[/C][C]0.0888[/C][C]0.464786[/C][/ROW]
[ROW][C]30[/C][C]-0.064869[/C][C]-0.4983[/C][C]0.310073[/C][/ROW]
[ROW][C]31[/C][C]0.059863[/C][C]0.4598[/C][C]0.323668[/C][/ROW]
[ROW][C]32[/C][C]-0.008541[/C][C]-0.0656[/C][C]0.473956[/C][/ROW]
[ROW][C]33[/C][C]0.003638[/C][C]0.0279[/C][C]0.4889[/C][/ROW]
[ROW][C]34[/C][C]-0.033059[/C][C]-0.2539[/C][C]0.400217[/C][/ROW]
[ROW][C]35[/C][C]-0.02313[/C][C]-0.1777[/C][C]0.429797[/C][/ROW]
[ROW][C]36[/C][C]0.14411[/C][C]1.1069[/C][C]0.136409[/C][/ROW]
[ROW][C]37[/C][C]-0.083603[/C][C]-0.6422[/C][C]0.261625[/C][/ROW]
[ROW][C]38[/C][C]-0.022743[/C][C]-0.1747[/C][C]0.43096[/C][/ROW]
[ROW][C]39[/C][C]-0.0065[/C][C]-0.0499[/C][C]0.480176[/C][/ROW]
[ROW][C]40[/C][C]0.007007[/C][C]0.0538[/C][C]0.478629[/C][/ROW]
[ROW][C]41[/C][C]-0.053561[/C][C]-0.4114[/C][C]0.341132[/C][/ROW]
[ROW][C]42[/C][C]0.028973[/C][C]0.2225[/C][C]0.412328[/C][/ROW]
[ROW][C]43[/C][C]-0.002491[/C][C]-0.0191[/C][C]0.492401[/C][/ROW]
[ROW][C]44[/C][C]-0.010598[/C][C]-0.0814[/C][C]0.467697[/C][/ROW]
[ROW][C]45[/C][C]0.024596[/C][C]0.1889[/C][C]0.4254[/C][/ROW]
[ROW][C]46[/C][C]-0.047883[/C][C]-0.3678[/C][C]0.357171[/C][/ROW]
[ROW][C]47[/C][C]0.064345[/C][C]0.4942[/C][C]0.311486[/C][/ROW]
[ROW][C]48[/C][C]-0.012682[/C][C]-0.0974[/C][C]0.461365[/C][/ROW]
[/TABLE]
Source: https://freestatistics.org/blog/index.php?pk=&T=1

Globally Unique Identifier (entire table): ba.freestatistics.org/blog/index.php?pk=&T=1

As an alternative you can also use a QR Code:  

The GUIDs for individual cells are displayed in the table below:

Autocorrelation Function
Time lag kACF(k)T-STATP-value
1-0.53013-4.0727e-05
20.1497861.15050.127284
3-0.03947-0.30320.381411
4-0.051334-0.39430.347388
50.2949262.26540.013588
6-0.429783-3.30120.000819
70.2135411.64020.053138
80.0081430.06250.47517
9-0.088491-0.67970.249673
100.1585591.21790.114052
11-0.351528-2.70010.004515
120.4496953.45420.000514
13-0.256723-1.97190.026656
140.0778060.59760.276184
15-0.001396-0.01070.495741
16-0.090512-0.69520.244818
170.1330441.02190.155492
18-0.074208-0.570.285419
190.0488540.37530.354407
200.0226680.17410.431185
21-0.037942-0.29140.385868
220.0520430.39970.345394
23-0.139337-1.07030.144428
240.1933591.48520.071405
25-0.117856-0.90530.184502
260.0182920.14050.444371
27-0.013374-0.10270.459265
280.0188970.14520.442543
290.0115560.08880.464786
30-0.064869-0.49830.310073
310.0598630.45980.323668
32-0.008541-0.06560.473956
330.0036380.02790.4889
34-0.033059-0.25390.400217
35-0.02313-0.17770.429797
360.144111.10690.136409
37-0.083603-0.64220.261625
38-0.022743-0.17470.43096
39-0.0065-0.04990.480176
400.0070070.05380.478629
41-0.053561-0.41140.341132
420.0289730.22250.412328
43-0.002491-0.01910.492401
44-0.010598-0.08140.467697
450.0245960.18890.4254
46-0.047883-0.36780.357171
470.0643450.49420.311486
48-0.012682-0.09740.461365


Partial Autocorrelation Function
Time lag kPACF(k)T-STATP-value
1-0.53013-4.0727e-05
2-0.182557-1.40220.083041
3-0.060931-0.4680.320747
4-0.109403-0.84030.202055
50.3124372.39990.009788
6-0.178979-1.37480.087202
7-0.160472-1.23260.111305
80.0799410.6140.270776
9-0.066967-0.51440.304454
100.065880.5060.307359
11-0.181882-1.39710.083813
120.1578941.21280.115019
130.0265690.20410.419497
140.0486850.3740.354888
15-0.004162-0.0320.487302
16-0.019215-0.14760.441584
17-0.179105-1.37570.087052
180.1627831.25040.108052
190.1176930.9040.184831
200.0411450.3160.376544
210.1028990.79040.216236
22-0.070907-0.54460.294025
23-0.132204-1.01550.157013
240.0981430.75390.226968
250.0738420.56720.286369
26-0.058445-0.44890.327564
27-0.009931-0.07630.469728
280.0355780.27330.392796
29-0.010545-0.0810.467859
30-0.069926-0.53710.296606
310.0430470.33060.371041
32-0.041809-0.32110.37462
33-0.045726-0.35120.363334
340.0189070.14520.442514
350.0549170.42180.337343
360.0440490.33830.368152
370.0876390.67320.251736
38-0.087118-0.66920.253
39-0.119052-0.91450.182099
40-0.062422-0.47950.316686
41-0.153524-1.17920.121518
420.0403670.31010.378802
430.069380.53290.298047
44-0.038305-0.29420.384808
45-0.00838-0.06440.474447
46-0.029031-0.2230.412156
470.0221060.16980.432874
480.0123160.09460.462476

\begin{tabular}{lllllllll}
\hline
Partial Autocorrelation Function \tabularnewline
Time lag k & PACF(k) & T-STAT & P-value \tabularnewline
1 & -0.53013 & -4.072 & 7e-05 \tabularnewline
2 & -0.182557 & -1.4022 & 0.083041 \tabularnewline
3 & -0.060931 & -0.468 & 0.320747 \tabularnewline
4 & -0.109403 & -0.8403 & 0.202055 \tabularnewline
5 & 0.312437 & 2.3999 & 0.009788 \tabularnewline
6 & -0.178979 & -1.3748 & 0.087202 \tabularnewline
7 & -0.160472 & -1.2326 & 0.111305 \tabularnewline
8 & 0.079941 & 0.614 & 0.270776 \tabularnewline
9 & -0.066967 & -0.5144 & 0.304454 \tabularnewline
10 & 0.06588 & 0.506 & 0.307359 \tabularnewline
11 & -0.181882 & -1.3971 & 0.083813 \tabularnewline
12 & 0.157894 & 1.2128 & 0.115019 \tabularnewline
13 & 0.026569 & 0.2041 & 0.419497 \tabularnewline
14 & 0.048685 & 0.374 & 0.354888 \tabularnewline
15 & -0.004162 & -0.032 & 0.487302 \tabularnewline
16 & -0.019215 & -0.1476 & 0.441584 \tabularnewline
17 & -0.179105 & -1.3757 & 0.087052 \tabularnewline
18 & 0.162783 & 1.2504 & 0.108052 \tabularnewline
19 & 0.117693 & 0.904 & 0.184831 \tabularnewline
20 & 0.041145 & 0.316 & 0.376544 \tabularnewline
21 & 0.102899 & 0.7904 & 0.216236 \tabularnewline
22 & -0.070907 & -0.5446 & 0.294025 \tabularnewline
23 & -0.132204 & -1.0155 & 0.157013 \tabularnewline
24 & 0.098143 & 0.7539 & 0.226968 \tabularnewline
25 & 0.073842 & 0.5672 & 0.286369 \tabularnewline
26 & -0.058445 & -0.4489 & 0.327564 \tabularnewline
27 & -0.009931 & -0.0763 & 0.469728 \tabularnewline
28 & 0.035578 & 0.2733 & 0.392796 \tabularnewline
29 & -0.010545 & -0.081 & 0.467859 \tabularnewline
30 & -0.069926 & -0.5371 & 0.296606 \tabularnewline
31 & 0.043047 & 0.3306 & 0.371041 \tabularnewline
32 & -0.041809 & -0.3211 & 0.37462 \tabularnewline
33 & -0.045726 & -0.3512 & 0.363334 \tabularnewline
34 & 0.018907 & 0.1452 & 0.442514 \tabularnewline
35 & 0.054917 & 0.4218 & 0.337343 \tabularnewline
36 & 0.044049 & 0.3383 & 0.368152 \tabularnewline
37 & 0.087639 & 0.6732 & 0.251736 \tabularnewline
38 & -0.087118 & -0.6692 & 0.253 \tabularnewline
39 & -0.119052 & -0.9145 & 0.182099 \tabularnewline
40 & -0.062422 & -0.4795 & 0.316686 \tabularnewline
41 & -0.153524 & -1.1792 & 0.121518 \tabularnewline
42 & 0.040367 & 0.3101 & 0.378802 \tabularnewline
43 & 0.06938 & 0.5329 & 0.298047 \tabularnewline
44 & -0.038305 & -0.2942 & 0.384808 \tabularnewline
45 & -0.00838 & -0.0644 & 0.474447 \tabularnewline
46 & -0.029031 & -0.223 & 0.412156 \tabularnewline
47 & 0.022106 & 0.1698 & 0.432874 \tabularnewline
48 & 0.012316 & 0.0946 & 0.462476 \tabularnewline
\hline
\end{tabular}
%Source: https://freestatistics.org/blog/index.php?pk=&T=2

[TABLE]
[ROW][C]Partial Autocorrelation Function[/C][/ROW]
[ROW][C]Time lag k[/C][C]PACF(k)[/C][C]T-STAT[/C][C]P-value[/C][/ROW]
[ROW][C]1[/C][C]-0.53013[/C][C]-4.072[/C][C]7e-05[/C][/ROW]
[ROW][C]2[/C][C]-0.182557[/C][C]-1.4022[/C][C]0.083041[/C][/ROW]
[ROW][C]3[/C][C]-0.060931[/C][C]-0.468[/C][C]0.320747[/C][/ROW]
[ROW][C]4[/C][C]-0.109403[/C][C]-0.8403[/C][C]0.202055[/C][/ROW]
[ROW][C]5[/C][C]0.312437[/C][C]2.3999[/C][C]0.009788[/C][/ROW]
[ROW][C]6[/C][C]-0.178979[/C][C]-1.3748[/C][C]0.087202[/C][/ROW]
[ROW][C]7[/C][C]-0.160472[/C][C]-1.2326[/C][C]0.111305[/C][/ROW]
[ROW][C]8[/C][C]0.079941[/C][C]0.614[/C][C]0.270776[/C][/ROW]
[ROW][C]9[/C][C]-0.066967[/C][C]-0.5144[/C][C]0.304454[/C][/ROW]
[ROW][C]10[/C][C]0.06588[/C][C]0.506[/C][C]0.307359[/C][/ROW]
[ROW][C]11[/C][C]-0.181882[/C][C]-1.3971[/C][C]0.083813[/C][/ROW]
[ROW][C]12[/C][C]0.157894[/C][C]1.2128[/C][C]0.115019[/C][/ROW]
[ROW][C]13[/C][C]0.026569[/C][C]0.2041[/C][C]0.419497[/C][/ROW]
[ROW][C]14[/C][C]0.048685[/C][C]0.374[/C][C]0.354888[/C][/ROW]
[ROW][C]15[/C][C]-0.004162[/C][C]-0.032[/C][C]0.487302[/C][/ROW]
[ROW][C]16[/C][C]-0.019215[/C][C]-0.1476[/C][C]0.441584[/C][/ROW]
[ROW][C]17[/C][C]-0.179105[/C][C]-1.3757[/C][C]0.087052[/C][/ROW]
[ROW][C]18[/C][C]0.162783[/C][C]1.2504[/C][C]0.108052[/C][/ROW]
[ROW][C]19[/C][C]0.117693[/C][C]0.904[/C][C]0.184831[/C][/ROW]
[ROW][C]20[/C][C]0.041145[/C][C]0.316[/C][C]0.376544[/C][/ROW]
[ROW][C]21[/C][C]0.102899[/C][C]0.7904[/C][C]0.216236[/C][/ROW]
[ROW][C]22[/C][C]-0.070907[/C][C]-0.5446[/C][C]0.294025[/C][/ROW]
[ROW][C]23[/C][C]-0.132204[/C][C]-1.0155[/C][C]0.157013[/C][/ROW]
[ROW][C]24[/C][C]0.098143[/C][C]0.7539[/C][C]0.226968[/C][/ROW]
[ROW][C]25[/C][C]0.073842[/C][C]0.5672[/C][C]0.286369[/C][/ROW]
[ROW][C]26[/C][C]-0.058445[/C][C]-0.4489[/C][C]0.327564[/C][/ROW]
[ROW][C]27[/C][C]-0.009931[/C][C]-0.0763[/C][C]0.469728[/C][/ROW]
[ROW][C]28[/C][C]0.035578[/C][C]0.2733[/C][C]0.392796[/C][/ROW]
[ROW][C]29[/C][C]-0.010545[/C][C]-0.081[/C][C]0.467859[/C][/ROW]
[ROW][C]30[/C][C]-0.069926[/C][C]-0.5371[/C][C]0.296606[/C][/ROW]
[ROW][C]31[/C][C]0.043047[/C][C]0.3306[/C][C]0.371041[/C][/ROW]
[ROW][C]32[/C][C]-0.041809[/C][C]-0.3211[/C][C]0.37462[/C][/ROW]
[ROW][C]33[/C][C]-0.045726[/C][C]-0.3512[/C][C]0.363334[/C][/ROW]
[ROW][C]34[/C][C]0.018907[/C][C]0.1452[/C][C]0.442514[/C][/ROW]
[ROW][C]35[/C][C]0.054917[/C][C]0.4218[/C][C]0.337343[/C][/ROW]
[ROW][C]36[/C][C]0.044049[/C][C]0.3383[/C][C]0.368152[/C][/ROW]
[ROW][C]37[/C][C]0.087639[/C][C]0.6732[/C][C]0.251736[/C][/ROW]
[ROW][C]38[/C][C]-0.087118[/C][C]-0.6692[/C][C]0.253[/C][/ROW]
[ROW][C]39[/C][C]-0.119052[/C][C]-0.9145[/C][C]0.182099[/C][/ROW]
[ROW][C]40[/C][C]-0.062422[/C][C]-0.4795[/C][C]0.316686[/C][/ROW]
[ROW][C]41[/C][C]-0.153524[/C][C]-1.1792[/C][C]0.121518[/C][/ROW]
[ROW][C]42[/C][C]0.040367[/C][C]0.3101[/C][C]0.378802[/C][/ROW]
[ROW][C]43[/C][C]0.06938[/C][C]0.5329[/C][C]0.298047[/C][/ROW]
[ROW][C]44[/C][C]-0.038305[/C][C]-0.2942[/C][C]0.384808[/C][/ROW]
[ROW][C]45[/C][C]-0.00838[/C][C]-0.0644[/C][C]0.474447[/C][/ROW]
[ROW][C]46[/C][C]-0.029031[/C][C]-0.223[/C][C]0.412156[/C][/ROW]
[ROW][C]47[/C][C]0.022106[/C][C]0.1698[/C][C]0.432874[/C][/ROW]
[ROW][C]48[/C][C]0.012316[/C][C]0.0946[/C][C]0.462476[/C][/ROW]
[/TABLE]
Source: https://freestatistics.org/blog/index.php?pk=&T=2

Globally Unique Identifier (entire table): ba.freestatistics.org/blog/index.php?pk=&T=2

As an alternative you can also use a QR Code:  

The GUIDs for individual cells are displayed in the table below:

Partial Autocorrelation Function
Time lag kPACF(k)T-STATP-value
1-0.53013-4.0727e-05
2-0.182557-1.40220.083041
3-0.060931-0.4680.320747
4-0.109403-0.84030.202055
50.3124372.39990.009788
6-0.178979-1.37480.087202
7-0.160472-1.23260.111305
80.0799410.6140.270776
9-0.066967-0.51440.304454
100.065880.5060.307359
11-0.181882-1.39710.083813
120.1578941.21280.115019
130.0265690.20410.419497
140.0486850.3740.354888
15-0.004162-0.0320.487302
16-0.019215-0.14760.441584
17-0.179105-1.37570.087052
180.1627831.25040.108052
190.1176930.9040.184831
200.0411450.3160.376544
210.1028990.79040.216236
22-0.070907-0.54460.294025
23-0.132204-1.01550.157013
240.0981430.75390.226968
250.0738420.56720.286369
26-0.058445-0.44890.327564
27-0.009931-0.07630.469728
280.0355780.27330.392796
29-0.010545-0.0810.467859
30-0.069926-0.53710.296606
310.0430470.33060.371041
32-0.041809-0.32110.37462
33-0.045726-0.35120.363334
340.0189070.14520.442514
350.0549170.42180.337343
360.0440490.33830.368152
370.0876390.67320.251736
38-0.087118-0.66920.253
39-0.119052-0.91450.182099
40-0.062422-0.47950.316686
41-0.153524-1.17920.121518
420.0403670.31010.378802
430.069380.53290.298047
44-0.038305-0.29420.384808
45-0.00838-0.06440.474447
46-0.029031-0.2230.412156
470.0221060.16980.432874
480.0123160.09460.462476


Parameters (Session):
par1 = 48 ; par2 = 1 ; par3 = 1 ; par4 = 0 ; par5 = 12 ; par6 = White Noise ; par7 = 0.95 ;
Parameters (R input):
par1 = 48 ; par2 = 1 ; par3 = 1 ; par4 = 0 ; par5 = 12 ; par6 = White Noise ; par7 = 0.95 ; par8 = ;
R code (references can be found in the software module):
par8 <- ''
par7 <- '0.95'
par6 <- 'White Noise'
par5 <- '12'
par4 <- '0'
par3 <- '0'
par2 <- '1'
par1 <- '48'
if (par1 == 'Default') {
par1 = 10*log10(length(x))
} else {
par1 <- as.numeric(par1)
}
par2 <- as.numeric(par2)
par3 <- as.numeric(par3)
par4 <- as.numeric(par4)
par5 <- as.numeric(par5)
if (par6 == 'White Noise') par6 <- 'white' else par6 <- 'ma'
par7 <- as.numeric(par7)
if (par8 != '') par8 <- as.numeric(par8)
x <- na.omit(x)
ox <- x
if (par8 == '') {
if (par2 == 0) {
x <- log(x)
} else {
x <- (x ^ par2 - 1) / par2
}
} else {
x <- log(x,base=par8)
}
if (par3 > 0) x <- diff(x,lag=1,difference=par3)
if (par4 > 0) x <- diff(x,lag=par5,difference=par4)
bitmap(file='picts.png')
op <- par(mfrow=c(2,1))
plot(ox,type='l',main='Original Time Series',xlab='time',ylab='value')
if (par8=='') {
mytitle <- paste('Working Time Series (lambda=',par2,', d=',par3,', D=',par4,')',sep='')
mysub <- paste('(lambda=',par2,', d=',par3,', D=',par4,', CI=', par7, ', CI type=',par6,')',sep='')
} else {
mytitle <- paste('Working Time Series (base=',par8,', d=',par3,', D=',par4,')',sep='')
mysub <- paste('(base=',par8,', d=',par3,', D=',par4,', CI=', par7, ', CI type=',par6,')',sep='')
}
plot(x,type='l', main=mytitle,xlab='time',ylab='value')
par(op)
dev.off()
bitmap(file='pic1.png')
racf <- acf(x, par1, main='Autocorrelation', xlab='time lag', ylab='ACF', ci.type=par6, ci=par7, sub=mysub)
dev.off()
bitmap(file='pic2.png')
rpacf <- pacf(x,par1,main='Partial Autocorrelation',xlab='lags',ylab='PACF',sub=mysub)
dev.off()
(myacf <- c(racf$acf))
(mypacf <- c(rpacf$acf))
lengthx <- length(x)
sqrtn <- sqrt(lengthx)
load(file='createtable')
a<-table.start()
a<-table.row.start(a)
a<-table.element(a,'Autocorrelation Function',4,TRUE)
a<-table.row.end(a)
a<-table.row.start(a)
a<-table.element(a,'Time lag k',header=TRUE)
a<-table.element(a,hyperlink('basics.htm','ACF(k)','click here for more information about the Autocorrelation Function'),header=TRUE)
a<-table.element(a,'T-STAT',header=TRUE)
a<-table.element(a,'P-value',header=TRUE)
a<-table.row.end(a)
for (i in 2:(par1+1)) {
a<-table.row.start(a)
a<-table.element(a,i-1,header=TRUE)
a<-table.element(a,round(myacf[i],6))
mytstat <- myacf[i]*sqrtn
a<-table.element(a,round(mytstat,4))
a<-table.element(a,round(1-pt(abs(mytstat),lengthx),6))
a<-table.row.end(a)
}
a<-table.end(a)
table.save(a,file='mytable.tab')
a<-table.start()
a<-table.row.start(a)
a<-table.element(a,'Partial Autocorrelation Function',4,TRUE)
a<-table.row.end(a)
a<-table.row.start(a)
a<-table.element(a,'Time lag k',header=TRUE)
a<-table.element(a,hyperlink('basics.htm','PACF(k)','click here for more information about the Partial Autocorrelation Function'),header=TRUE)
a<-table.element(a,'T-STAT',header=TRUE)
a<-table.element(a,'P-value',header=TRUE)
a<-table.row.end(a)
for (i in 1:par1) {
a<-table.row.start(a)
a<-table.element(a,i,header=TRUE)
a<-table.element(a,round(mypacf[i],6))
mytstat <- mypacf[i]*sqrtn
a<-table.element(a,round(mytstat,4))
a<-table.element(a,round(1-pt(abs(mytstat),lengthx),6))
a<-table.row.end(a)
}
a<-table.end(a)
table.save(a,file='mytable1.tab')