Free Statistics

of Irreproducible Research!

Author's title

Author*Unverified author*
R Software Modulerwasp_autocorrelation.wasp
Title produced by software(Partial) Autocorrelation Function
Date of computationFri, 21 Oct 2016 15:26:13 +0100
Cite this page as followsStatistical Computations at FreeStatistics.org, Office for Research Development and Education, URL https://freestatistics.org/blog/index.php?v=date/2016/Oct/21/t1477060030q0qbtevmceziuu4.htm/, Retrieved Fri, 17 May 2024 15:23:08 +0200
Statistical Computations at FreeStatistics.org, Office for Research Development and Education, URL https://freestatistics.org/blog/index.php?pk=, Retrieved Fri, 17 May 2024 15:23:08 +0200
QR Codes:

Original text written by user:
IsPrivate?No (this computation is public)
User-defined keywords
Estimated Impact0
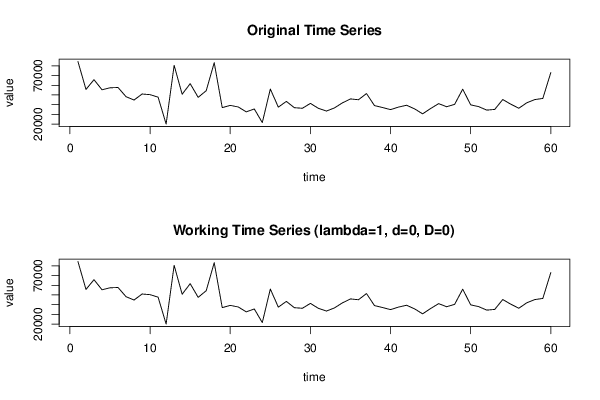
Dataseries X:
84543
55735
65814
55382
57422
57729
48213
44789
50998
50328
47719
19946
80608
50747
61687
47539
54412
83362
36911
39254
37597
32557
35537
21500
56125
37432
43347
36870
36247
41293
36190
33381
36609
41861
45926
45079
51469
39013
37036
34865
37505
39379
35653
30515
35984
41068
37851
40333
56004
39797
37960
34357
35069
45299
40475
36277
41910
45234
46425
73241


Summary of computational transaction
Raw Inputview raw input (R code)
Raw Outputview raw output of R engine
Computing time1 seconds
R Server'Sir Ronald Aylmer Fisher' @ fisher.wessa.net

\begin{tabular}{lllllllll}
\hline
Summary of computational transaction \tabularnewline
Raw Input & view raw input (R code)  \tabularnewline
Raw Output & view raw output of R engine  \tabularnewline
Computing time & 1 seconds \tabularnewline
R Server & 'Sir Ronald Aylmer Fisher' @ fisher.wessa.net \tabularnewline
\hline
\end{tabular}
%Source: https://freestatistics.org/blog/index.php?pk=&T=0

[TABLE]
[ROW][C]Summary of computational transaction[/C][/ROW]
[ROW][C]Raw Input[/C][C]view raw input (R code) [/C][/ROW]
[ROW][C]Raw Output[/C][C]view raw output of R engine [/C][/ROW]
[ROW][C]Computing time[/C][C]1 seconds[/C][/ROW]
[ROW][C]R Server[/C][C]'Sir Ronald Aylmer Fisher' @ fisher.wessa.net[/C][/ROW]
[/TABLE]
Source: https://freestatistics.org/blog/index.php?pk=&T=0

Globally Unique Identifier (entire table): ba.freestatistics.org/blog/index.php?pk=&T=0

As an alternative you can also use a QR Code:  

The GUIDs for individual cells are displayed in the table below:

Summary of computational transaction
Raw Inputview raw input (R code)
Raw Outputview raw output of R engine
Computing time1 seconds
R Server'Sir Ronald Aylmer Fisher' @ fisher.wessa.net


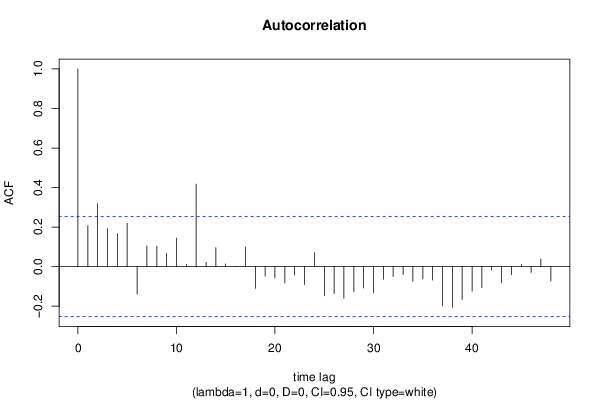
Autocorrelation Function
Time lag kACF(k)T-STATP-value
10.207441.60680.056672
20.3188952.47020.008183
30.1913771.48240.071734
40.1670531.2940.100314
50.2194511.69990.047168
6-0.14006-1.08490.141152
70.1050310.81360.209555
80.1032560.79980.213485
90.0678210.52530.300643
100.1442831.11760.134094
110.0113220.08770.465205
120.4175653.23440.000992
130.0215440.16690.434014
140.0960240.74380.229951
150.0130950.10140.459773
160.0013490.01040.49585
170.099810.77310.221241
18-0.110174-0.85340.198416
19-0.048494-0.37560.354259
20-0.056884-0.44060.330535
21-0.08218-0.63660.263416
22-0.042522-0.32940.37151
23-0.090407-0.70030.243228
240.0706690.54740.293067
25-0.147561-1.1430.128788
26-0.135633-1.05060.148826
27-0.160344-1.2420.109531
28-0.127064-0.98420.164477
29-0.108026-0.83680.203021
30-0.132405-1.02560.154597
31-0.0634-0.49110.312576
32-0.050278-0.38950.349159
33-0.040097-0.31060.378595
34-0.073571-0.56990.285445
35-0.062032-0.48050.316311
36-0.068048-0.52710.300035
37-0.197837-1.53240.065335
38-0.205288-1.59020.058528
39-0.16616-1.28710.101507
40-0.123919-0.95990.170485
41-0.106222-0.82280.206941
42-0.017115-0.13260.447487
43-0.081589-0.6320.264898
44-0.041424-0.32090.374712
450.0109210.08460.466432
46-0.029168-0.22590.411011
470.0386910.29970.38272
48-0.072953-0.56510.287058

\begin{tabular}{lllllllll}
\hline
Autocorrelation Function \tabularnewline
Time lag k & ACF(k) & T-STAT & P-value \tabularnewline
1 & 0.20744 & 1.6068 & 0.056672 \tabularnewline
2 & 0.318895 & 2.4702 & 0.008183 \tabularnewline
3 & 0.191377 & 1.4824 & 0.071734 \tabularnewline
4 & 0.167053 & 1.294 & 0.100314 \tabularnewline
5 & 0.219451 & 1.6999 & 0.047168 \tabularnewline
6 & -0.14006 & -1.0849 & 0.141152 \tabularnewline
7 & 0.105031 & 0.8136 & 0.209555 \tabularnewline
8 & 0.103256 & 0.7998 & 0.213485 \tabularnewline
9 & 0.067821 & 0.5253 & 0.300643 \tabularnewline
10 & 0.144283 & 1.1176 & 0.134094 \tabularnewline
11 & 0.011322 & 0.0877 & 0.465205 \tabularnewline
12 & 0.417565 & 3.2344 & 0.000992 \tabularnewline
13 & 0.021544 & 0.1669 & 0.434014 \tabularnewline
14 & 0.096024 & 0.7438 & 0.229951 \tabularnewline
15 & 0.013095 & 0.1014 & 0.459773 \tabularnewline
16 & 0.001349 & 0.0104 & 0.49585 \tabularnewline
17 & 0.09981 & 0.7731 & 0.221241 \tabularnewline
18 & -0.110174 & -0.8534 & 0.198416 \tabularnewline
19 & -0.048494 & -0.3756 & 0.354259 \tabularnewline
20 & -0.056884 & -0.4406 & 0.330535 \tabularnewline
21 & -0.08218 & -0.6366 & 0.263416 \tabularnewline
22 & -0.042522 & -0.3294 & 0.37151 \tabularnewline
23 & -0.090407 & -0.7003 & 0.243228 \tabularnewline
24 & 0.070669 & 0.5474 & 0.293067 \tabularnewline
25 & -0.147561 & -1.143 & 0.128788 \tabularnewline
26 & -0.135633 & -1.0506 & 0.148826 \tabularnewline
27 & -0.160344 & -1.242 & 0.109531 \tabularnewline
28 & -0.127064 & -0.9842 & 0.164477 \tabularnewline
29 & -0.108026 & -0.8368 & 0.203021 \tabularnewline
30 & -0.132405 & -1.0256 & 0.154597 \tabularnewline
31 & -0.0634 & -0.4911 & 0.312576 \tabularnewline
32 & -0.050278 & -0.3895 & 0.349159 \tabularnewline
33 & -0.040097 & -0.3106 & 0.378595 \tabularnewline
34 & -0.073571 & -0.5699 & 0.285445 \tabularnewline
35 & -0.062032 & -0.4805 & 0.316311 \tabularnewline
36 & -0.068048 & -0.5271 & 0.300035 \tabularnewline
37 & -0.197837 & -1.5324 & 0.065335 \tabularnewline
38 & -0.205288 & -1.5902 & 0.058528 \tabularnewline
39 & -0.16616 & -1.2871 & 0.101507 \tabularnewline
40 & -0.123919 & -0.9599 & 0.170485 \tabularnewline
41 & -0.106222 & -0.8228 & 0.206941 \tabularnewline
42 & -0.017115 & -0.1326 & 0.447487 \tabularnewline
43 & -0.081589 & -0.632 & 0.264898 \tabularnewline
44 & -0.041424 & -0.3209 & 0.374712 \tabularnewline
45 & 0.010921 & 0.0846 & 0.466432 \tabularnewline
46 & -0.029168 & -0.2259 & 0.411011 \tabularnewline
47 & 0.038691 & 0.2997 & 0.38272 \tabularnewline
48 & -0.072953 & -0.5651 & 0.287058 \tabularnewline
\hline
\end{tabular}
%Source: https://freestatistics.org/blog/index.php?pk=&T=1

[TABLE]
[ROW][C]Autocorrelation Function[/C][/ROW]
[ROW][C]Time lag k[/C][C]ACF(k)[/C][C]T-STAT[/C][C]P-value[/C][/ROW]
[ROW][C]1[/C][C]0.20744[/C][C]1.6068[/C][C]0.056672[/C][/ROW]
[ROW][C]2[/C][C]0.318895[/C][C]2.4702[/C][C]0.008183[/C][/ROW]
[ROW][C]3[/C][C]0.191377[/C][C]1.4824[/C][C]0.071734[/C][/ROW]
[ROW][C]4[/C][C]0.167053[/C][C]1.294[/C][C]0.100314[/C][/ROW]
[ROW][C]5[/C][C]0.219451[/C][C]1.6999[/C][C]0.047168[/C][/ROW]
[ROW][C]6[/C][C]-0.14006[/C][C]-1.0849[/C][C]0.141152[/C][/ROW]
[ROW][C]7[/C][C]0.105031[/C][C]0.8136[/C][C]0.209555[/C][/ROW]
[ROW][C]8[/C][C]0.103256[/C][C]0.7998[/C][C]0.213485[/C][/ROW]
[ROW][C]9[/C][C]0.067821[/C][C]0.5253[/C][C]0.300643[/C][/ROW]
[ROW][C]10[/C][C]0.144283[/C][C]1.1176[/C][C]0.134094[/C][/ROW]
[ROW][C]11[/C][C]0.011322[/C][C]0.0877[/C][C]0.465205[/C][/ROW]
[ROW][C]12[/C][C]0.417565[/C][C]3.2344[/C][C]0.000992[/C][/ROW]
[ROW][C]13[/C][C]0.021544[/C][C]0.1669[/C][C]0.434014[/C][/ROW]
[ROW][C]14[/C][C]0.096024[/C][C]0.7438[/C][C]0.229951[/C][/ROW]
[ROW][C]15[/C][C]0.013095[/C][C]0.1014[/C][C]0.459773[/C][/ROW]
[ROW][C]16[/C][C]0.001349[/C][C]0.0104[/C][C]0.49585[/C][/ROW]
[ROW][C]17[/C][C]0.09981[/C][C]0.7731[/C][C]0.221241[/C][/ROW]
[ROW][C]18[/C][C]-0.110174[/C][C]-0.8534[/C][C]0.198416[/C][/ROW]
[ROW][C]19[/C][C]-0.048494[/C][C]-0.3756[/C][C]0.354259[/C][/ROW]
[ROW][C]20[/C][C]-0.056884[/C][C]-0.4406[/C][C]0.330535[/C][/ROW]
[ROW][C]21[/C][C]-0.08218[/C][C]-0.6366[/C][C]0.263416[/C][/ROW]
[ROW][C]22[/C][C]-0.042522[/C][C]-0.3294[/C][C]0.37151[/C][/ROW]
[ROW][C]23[/C][C]-0.090407[/C][C]-0.7003[/C][C]0.243228[/C][/ROW]
[ROW][C]24[/C][C]0.070669[/C][C]0.5474[/C][C]0.293067[/C][/ROW]
[ROW][C]25[/C][C]-0.147561[/C][C]-1.143[/C][C]0.128788[/C][/ROW]
[ROW][C]26[/C][C]-0.135633[/C][C]-1.0506[/C][C]0.148826[/C][/ROW]
[ROW][C]27[/C][C]-0.160344[/C][C]-1.242[/C][C]0.109531[/C][/ROW]
[ROW][C]28[/C][C]-0.127064[/C][C]-0.9842[/C][C]0.164477[/C][/ROW]
[ROW][C]29[/C][C]-0.108026[/C][C]-0.8368[/C][C]0.203021[/C][/ROW]
[ROW][C]30[/C][C]-0.132405[/C][C]-1.0256[/C][C]0.154597[/C][/ROW]
[ROW][C]31[/C][C]-0.0634[/C][C]-0.4911[/C][C]0.312576[/C][/ROW]
[ROW][C]32[/C][C]-0.050278[/C][C]-0.3895[/C][C]0.349159[/C][/ROW]
[ROW][C]33[/C][C]-0.040097[/C][C]-0.3106[/C][C]0.378595[/C][/ROW]
[ROW][C]34[/C][C]-0.073571[/C][C]-0.5699[/C][C]0.285445[/C][/ROW]
[ROW][C]35[/C][C]-0.062032[/C][C]-0.4805[/C][C]0.316311[/C][/ROW]
[ROW][C]36[/C][C]-0.068048[/C][C]-0.5271[/C][C]0.300035[/C][/ROW]
[ROW][C]37[/C][C]-0.197837[/C][C]-1.5324[/C][C]0.065335[/C][/ROW]
[ROW][C]38[/C][C]-0.205288[/C][C]-1.5902[/C][C]0.058528[/C][/ROW]
[ROW][C]39[/C][C]-0.16616[/C][C]-1.2871[/C][C]0.101507[/C][/ROW]
[ROW][C]40[/C][C]-0.123919[/C][C]-0.9599[/C][C]0.170485[/C][/ROW]
[ROW][C]41[/C][C]-0.106222[/C][C]-0.8228[/C][C]0.206941[/C][/ROW]
[ROW][C]42[/C][C]-0.017115[/C][C]-0.1326[/C][C]0.447487[/C][/ROW]
[ROW][C]43[/C][C]-0.081589[/C][C]-0.632[/C][C]0.264898[/C][/ROW]
[ROW][C]44[/C][C]-0.041424[/C][C]-0.3209[/C][C]0.374712[/C][/ROW]
[ROW][C]45[/C][C]0.010921[/C][C]0.0846[/C][C]0.466432[/C][/ROW]
[ROW][C]46[/C][C]-0.029168[/C][C]-0.2259[/C][C]0.411011[/C][/ROW]
[ROW][C]47[/C][C]0.038691[/C][C]0.2997[/C][C]0.38272[/C][/ROW]
[ROW][C]48[/C][C]-0.072953[/C][C]-0.5651[/C][C]0.287058[/C][/ROW]
[/TABLE]
Source: https://freestatistics.org/blog/index.php?pk=&T=1

Globally Unique Identifier (entire table): ba.freestatistics.org/blog/index.php?pk=&T=1

As an alternative you can also use a QR Code:  

The GUIDs for individual cells are displayed in the table below:

Autocorrelation Function
Time lag kACF(k)T-STATP-value
10.207441.60680.056672
20.3188952.47020.008183
30.1913771.48240.071734
40.1670531.2940.100314
50.2194511.69990.047168
6-0.14006-1.08490.141152
70.1050310.81360.209555
80.1032560.79980.213485
90.0678210.52530.300643
100.1442831.11760.134094
110.0113220.08770.465205
120.4175653.23440.000992
130.0215440.16690.434014
140.0960240.74380.229951
150.0130950.10140.459773
160.0013490.01040.49585
170.099810.77310.221241
18-0.110174-0.85340.198416
19-0.048494-0.37560.354259
20-0.056884-0.44060.330535
21-0.08218-0.63660.263416
22-0.042522-0.32940.37151
23-0.090407-0.70030.243228
240.0706690.54740.293067
25-0.147561-1.1430.128788
26-0.135633-1.05060.148826
27-0.160344-1.2420.109531
28-0.127064-0.98420.164477
29-0.108026-0.83680.203021
30-0.132405-1.02560.154597
31-0.0634-0.49110.312576
32-0.050278-0.38950.349159
33-0.040097-0.31060.378595
34-0.073571-0.56990.285445
35-0.062032-0.48050.316311
36-0.068048-0.52710.300035
37-0.197837-1.53240.065335
38-0.205288-1.59020.058528
39-0.16616-1.28710.101507
40-0.123919-0.95990.170485
41-0.106222-0.82280.206941
42-0.017115-0.13260.447487
43-0.081589-0.6320.264898
44-0.041424-0.32090.374712
450.0109210.08460.466432
46-0.029168-0.22590.411011
470.0386910.29970.38272
48-0.072953-0.56510.287058


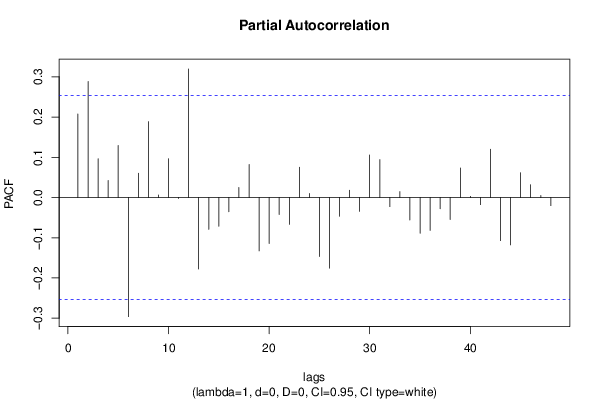
Partial Autocorrelation Function
Time lag kPACF(k)T-STATP-value
10.207441.60680.056672
20.2882682.23290.014648
30.0962980.74590.229313
40.0422650.32740.372259
50.1290840.99990.160692
6-0.296052-2.29320.012678
70.0604140.4680.320753
80.1885441.46050.07469
90.0063580.04930.480442
100.0962720.74570.229374
11-0.002502-0.01940.492302
120.3194242.47420.008099
13-0.177616-1.37580.086997
14-0.079124-0.61290.271132
15-0.071372-0.55280.291212
16-0.03552-0.27510.392078
170.0249270.19310.423773
180.0822010.63670.263363
19-0.132604-1.02710.154237
20-0.114352-0.88580.18964
21-0.042376-0.32820.371935
22-0.06685-0.51780.303244
230.0752030.58250.281199
240.0098430.07620.469738
25-0.146408-1.13410.130638
26-0.175564-1.35990.089472
27-0.046465-0.35990.360086
280.0181860.14090.444223
29-0.034482-0.26710.395157
300.1056150.81810.208272
310.0942210.72980.234166
32-0.022789-0.17650.430238
330.0146390.11340.45505
34-0.056101-0.43460.332721
35-0.088757-0.68750.247207
36-0.081654-0.63250.264736
37-0.028015-0.2170.41447
38-0.054722-0.42390.336586
390.0731480.56660.286548
400.0028340.0220.49128
41-0.01781-0.1380.445367
420.1198860.92860.1784
43-0.10727-0.83090.204659
44-0.117786-0.91240.182614
450.0613750.47540.318112
460.0315970.24470.403743
470.0050120.03880.484581
48-0.020236-0.15670.437984

\begin{tabular}{lllllllll}
\hline
Partial Autocorrelation Function \tabularnewline
Time lag k & PACF(k) & T-STAT & P-value \tabularnewline
1 & 0.20744 & 1.6068 & 0.056672 \tabularnewline
2 & 0.288268 & 2.2329 & 0.014648 \tabularnewline
3 & 0.096298 & 0.7459 & 0.229313 \tabularnewline
4 & 0.042265 & 0.3274 & 0.372259 \tabularnewline
5 & 0.129084 & 0.9999 & 0.160692 \tabularnewline
6 & -0.296052 & -2.2932 & 0.012678 \tabularnewline
7 & 0.060414 & 0.468 & 0.320753 \tabularnewline
8 & 0.188544 & 1.4605 & 0.07469 \tabularnewline
9 & 0.006358 & 0.0493 & 0.480442 \tabularnewline
10 & 0.096272 & 0.7457 & 0.229374 \tabularnewline
11 & -0.002502 & -0.0194 & 0.492302 \tabularnewline
12 & 0.319424 & 2.4742 & 0.008099 \tabularnewline
13 & -0.177616 & -1.3758 & 0.086997 \tabularnewline
14 & -0.079124 & -0.6129 & 0.271132 \tabularnewline
15 & -0.071372 & -0.5528 & 0.291212 \tabularnewline
16 & -0.03552 & -0.2751 & 0.392078 \tabularnewline
17 & 0.024927 & 0.1931 & 0.423773 \tabularnewline
18 & 0.082201 & 0.6367 & 0.263363 \tabularnewline
19 & -0.132604 & -1.0271 & 0.154237 \tabularnewline
20 & -0.114352 & -0.8858 & 0.18964 \tabularnewline
21 & -0.042376 & -0.3282 & 0.371935 \tabularnewline
22 & -0.06685 & -0.5178 & 0.303244 \tabularnewline
23 & 0.075203 & 0.5825 & 0.281199 \tabularnewline
24 & 0.009843 & 0.0762 & 0.469738 \tabularnewline
25 & -0.146408 & -1.1341 & 0.130638 \tabularnewline
26 & -0.175564 & -1.3599 & 0.089472 \tabularnewline
27 & -0.046465 & -0.3599 & 0.360086 \tabularnewline
28 & 0.018186 & 0.1409 & 0.444223 \tabularnewline
29 & -0.034482 & -0.2671 & 0.395157 \tabularnewline
30 & 0.105615 & 0.8181 & 0.208272 \tabularnewline
31 & 0.094221 & 0.7298 & 0.234166 \tabularnewline
32 & -0.022789 & -0.1765 & 0.430238 \tabularnewline
33 & 0.014639 & 0.1134 & 0.45505 \tabularnewline
34 & -0.056101 & -0.4346 & 0.332721 \tabularnewline
35 & -0.088757 & -0.6875 & 0.247207 \tabularnewline
36 & -0.081654 & -0.6325 & 0.264736 \tabularnewline
37 & -0.028015 & -0.217 & 0.41447 \tabularnewline
38 & -0.054722 & -0.4239 & 0.336586 \tabularnewline
39 & 0.073148 & 0.5666 & 0.286548 \tabularnewline
40 & 0.002834 & 0.022 & 0.49128 \tabularnewline
41 & -0.01781 & -0.138 & 0.445367 \tabularnewline
42 & 0.119886 & 0.9286 & 0.1784 \tabularnewline
43 & -0.10727 & -0.8309 & 0.204659 \tabularnewline
44 & -0.117786 & -0.9124 & 0.182614 \tabularnewline
45 & 0.061375 & 0.4754 & 0.318112 \tabularnewline
46 & 0.031597 & 0.2447 & 0.403743 \tabularnewline
47 & 0.005012 & 0.0388 & 0.484581 \tabularnewline
48 & -0.020236 & -0.1567 & 0.437984 \tabularnewline
\hline
\end{tabular}
%Source: https://freestatistics.org/blog/index.php?pk=&T=2

[TABLE]
[ROW][C]Partial Autocorrelation Function[/C][/ROW]
[ROW][C]Time lag k[/C][C]PACF(k)[/C][C]T-STAT[/C][C]P-value[/C][/ROW]
[ROW][C]1[/C][C]0.20744[/C][C]1.6068[/C][C]0.056672[/C][/ROW]
[ROW][C]2[/C][C]0.288268[/C][C]2.2329[/C][C]0.014648[/C][/ROW]
[ROW][C]3[/C][C]0.096298[/C][C]0.7459[/C][C]0.229313[/C][/ROW]
[ROW][C]4[/C][C]0.042265[/C][C]0.3274[/C][C]0.372259[/C][/ROW]
[ROW][C]5[/C][C]0.129084[/C][C]0.9999[/C][C]0.160692[/C][/ROW]
[ROW][C]6[/C][C]-0.296052[/C][C]-2.2932[/C][C]0.012678[/C][/ROW]
[ROW][C]7[/C][C]0.060414[/C][C]0.468[/C][C]0.320753[/C][/ROW]
[ROW][C]8[/C][C]0.188544[/C][C]1.4605[/C][C]0.07469[/C][/ROW]
[ROW][C]9[/C][C]0.006358[/C][C]0.0493[/C][C]0.480442[/C][/ROW]
[ROW][C]10[/C][C]0.096272[/C][C]0.7457[/C][C]0.229374[/C][/ROW]
[ROW][C]11[/C][C]-0.002502[/C][C]-0.0194[/C][C]0.492302[/C][/ROW]
[ROW][C]12[/C][C]0.319424[/C][C]2.4742[/C][C]0.008099[/C][/ROW]
[ROW][C]13[/C][C]-0.177616[/C][C]-1.3758[/C][C]0.086997[/C][/ROW]
[ROW][C]14[/C][C]-0.079124[/C][C]-0.6129[/C][C]0.271132[/C][/ROW]
[ROW][C]15[/C][C]-0.071372[/C][C]-0.5528[/C][C]0.291212[/C][/ROW]
[ROW][C]16[/C][C]-0.03552[/C][C]-0.2751[/C][C]0.392078[/C][/ROW]
[ROW][C]17[/C][C]0.024927[/C][C]0.1931[/C][C]0.423773[/C][/ROW]
[ROW][C]18[/C][C]0.082201[/C][C]0.6367[/C][C]0.263363[/C][/ROW]
[ROW][C]19[/C][C]-0.132604[/C][C]-1.0271[/C][C]0.154237[/C][/ROW]
[ROW][C]20[/C][C]-0.114352[/C][C]-0.8858[/C][C]0.18964[/C][/ROW]
[ROW][C]21[/C][C]-0.042376[/C][C]-0.3282[/C][C]0.371935[/C][/ROW]
[ROW][C]22[/C][C]-0.06685[/C][C]-0.5178[/C][C]0.303244[/C][/ROW]
[ROW][C]23[/C][C]0.075203[/C][C]0.5825[/C][C]0.281199[/C][/ROW]
[ROW][C]24[/C][C]0.009843[/C][C]0.0762[/C][C]0.469738[/C][/ROW]
[ROW][C]25[/C][C]-0.146408[/C][C]-1.1341[/C][C]0.130638[/C][/ROW]
[ROW][C]26[/C][C]-0.175564[/C][C]-1.3599[/C][C]0.089472[/C][/ROW]
[ROW][C]27[/C][C]-0.046465[/C][C]-0.3599[/C][C]0.360086[/C][/ROW]
[ROW][C]28[/C][C]0.018186[/C][C]0.1409[/C][C]0.444223[/C][/ROW]
[ROW][C]29[/C][C]-0.034482[/C][C]-0.2671[/C][C]0.395157[/C][/ROW]
[ROW][C]30[/C][C]0.105615[/C][C]0.8181[/C][C]0.208272[/C][/ROW]
[ROW][C]31[/C][C]0.094221[/C][C]0.7298[/C][C]0.234166[/C][/ROW]
[ROW][C]32[/C][C]-0.022789[/C][C]-0.1765[/C][C]0.430238[/C][/ROW]
[ROW][C]33[/C][C]0.014639[/C][C]0.1134[/C][C]0.45505[/C][/ROW]
[ROW][C]34[/C][C]-0.056101[/C][C]-0.4346[/C][C]0.332721[/C][/ROW]
[ROW][C]35[/C][C]-0.088757[/C][C]-0.6875[/C][C]0.247207[/C][/ROW]
[ROW][C]36[/C][C]-0.081654[/C][C]-0.6325[/C][C]0.264736[/C][/ROW]
[ROW][C]37[/C][C]-0.028015[/C][C]-0.217[/C][C]0.41447[/C][/ROW]
[ROW][C]38[/C][C]-0.054722[/C][C]-0.4239[/C][C]0.336586[/C][/ROW]
[ROW][C]39[/C][C]0.073148[/C][C]0.5666[/C][C]0.286548[/C][/ROW]
[ROW][C]40[/C][C]0.002834[/C][C]0.022[/C][C]0.49128[/C][/ROW]
[ROW][C]41[/C][C]-0.01781[/C][C]-0.138[/C][C]0.445367[/C][/ROW]
[ROW][C]42[/C][C]0.119886[/C][C]0.9286[/C][C]0.1784[/C][/ROW]
[ROW][C]43[/C][C]-0.10727[/C][C]-0.8309[/C][C]0.204659[/C][/ROW]
[ROW][C]44[/C][C]-0.117786[/C][C]-0.9124[/C][C]0.182614[/C][/ROW]
[ROW][C]45[/C][C]0.061375[/C][C]0.4754[/C][C]0.318112[/C][/ROW]
[ROW][C]46[/C][C]0.031597[/C][C]0.2447[/C][C]0.403743[/C][/ROW]
[ROW][C]47[/C][C]0.005012[/C][C]0.0388[/C][C]0.484581[/C][/ROW]
[ROW][C]48[/C][C]-0.020236[/C][C]-0.1567[/C][C]0.437984[/C][/ROW]
[/TABLE]
Source: https://freestatistics.org/blog/index.php?pk=&T=2

Globally Unique Identifier (entire table): ba.freestatistics.org/blog/index.php?pk=&T=2

As an alternative you can also use a QR Code:  

The GUIDs for individual cells are displayed in the table below:

Partial Autocorrelation Function
Time lag kPACF(k)T-STATP-value
10.207441.60680.056672
20.2882682.23290.014648
30.0962980.74590.229313
40.0422650.32740.372259
50.1290840.99990.160692
6-0.296052-2.29320.012678
70.0604140.4680.320753
80.1885441.46050.07469
90.0063580.04930.480442
100.0962720.74570.229374
11-0.002502-0.01940.492302
120.3194242.47420.008099
13-0.177616-1.37580.086997
14-0.079124-0.61290.271132
15-0.071372-0.55280.291212
16-0.03552-0.27510.392078
170.0249270.19310.423773
180.0822010.63670.263363
19-0.132604-1.02710.154237
20-0.114352-0.88580.18964
21-0.042376-0.32820.371935
22-0.06685-0.51780.303244
230.0752030.58250.281199
240.0098430.07620.469738
25-0.146408-1.13410.130638
26-0.175564-1.35990.089472
27-0.046465-0.35990.360086
280.0181860.14090.444223
29-0.034482-0.26710.395157
300.1056150.81810.208272
310.0942210.72980.234166
32-0.022789-0.17650.430238
330.0146390.11340.45505
34-0.056101-0.43460.332721
35-0.088757-0.68750.247207
36-0.081654-0.63250.264736
37-0.028015-0.2170.41447
38-0.054722-0.42390.336586
390.0731480.56660.286548
400.0028340.0220.49128
41-0.01781-0.1380.445367
420.1198860.92860.1784
43-0.10727-0.83090.204659
44-0.117786-0.91240.182614
450.0613750.47540.318112
460.0315970.24470.403743
470.0050120.03880.484581
48-0.020236-0.15670.437984


Parameters (Session):
par1 = 48 ; par2 = 1 ; par3 = 0 ; par4 = 0 ; par5 = 12 ; par6 = White Noise ; par7 = 0.95 ;
Parameters (R input):
par1 = 48 ; par2 = 1 ; par3 = 0 ; par4 = 0 ; par5 = 12 ; par6 = White Noise ; par7 = 0.95 ; par8 = ;
R code (references can be found in the software module):
if (par1 == 'Default') {
par1 = 10*log10(length(x))
} else {
par1 <- as.numeric(par1)
}
par2 <- as.numeric(par2)
par3 <- as.numeric(par3)
par4 <- as.numeric(par4)
par5 <- as.numeric(par5)
if (par6 == 'White Noise') par6 <- 'white' else par6 <- 'ma'
par7 <- as.numeric(par7)
if (par8 != '') par8 <- as.numeric(par8)
x <- na.omit(x)
ox <- x
if (par8 == '') {
if (par2 == 0) {
x <- log(x)
} else {
x <- (x ^ par2 - 1) / par2
}
} else {
x <- log(x,base=par8)
}
if (par3 > 0) x <- diff(x,lag=1,difference=par3)
if (par4 > 0) x <- diff(x,lag=par5,difference=par4)
bitmap(file='picts.png')
op <- par(mfrow=c(2,1))
plot(ox,type='l',main='Original Time Series',xlab='time',ylab='value')
if (par8=='') {
mytitle <- paste('Working Time Series (lambda=',par2,', d=',par3,', D=',par4,')',sep='')
mysub <- paste('(lambda=',par2,', d=',par3,', D=',par4,', CI=', par7, ', CI type=',par6,')',sep='')
} else {
mytitle <- paste('Working Time Series (base=',par8,', d=',par3,', D=',par4,')',sep='')
mysub <- paste('(base=',par8,', d=',par3,', D=',par4,', CI=', par7, ', CI type=',par6,')',sep='')
}
plot(x,type='l', main=mytitle,xlab='time',ylab='value')
par(op)
dev.off()
bitmap(file='pic1.png')
racf <- acf(x, par1, main='Autocorrelation', xlab='time lag', ylab='ACF', ci.type=par6, ci=par7, sub=mysub)
dev.off()
bitmap(file='pic2.png')
rpacf <- pacf(x,par1,main='Partial Autocorrelation',xlab='lags',ylab='PACF',sub=mysub)
dev.off()
(myacf <- c(racf$acf))
(mypacf <- c(rpacf$acf))
lengthx <- length(x)
sqrtn <- sqrt(lengthx)
load(file='createtable')
a<-table.start()
a<-table.row.start(a)
a<-table.element(a,'Autocorrelation Function',4,TRUE)
a<-table.row.end(a)
a<-table.row.start(a)
a<-table.element(a,'Time lag k',header=TRUE)
a<-table.element(a,hyperlink('basics.htm','ACF(k)','click here for more information about the Autocorrelation Function'),header=TRUE)
a<-table.element(a,'T-STAT',header=TRUE)
a<-table.element(a,'P-value',header=TRUE)
a<-table.row.end(a)
for (i in 2:(par1+1)) {
a<-table.row.start(a)
a<-table.element(a,i-1,header=TRUE)
a<-table.element(a,round(myacf[i],6))
mytstat <- myacf[i]*sqrtn
a<-table.element(a,round(mytstat,4))
a<-table.element(a,round(1-pt(abs(mytstat),lengthx),6))
a<-table.row.end(a)
}
a<-table.end(a)
table.save(a,file='mytable.tab')
a<-table.start()
a<-table.row.start(a)
a<-table.element(a,'Partial Autocorrelation Function',4,TRUE)
a<-table.row.end(a)
a<-table.row.start(a)
a<-table.element(a,'Time lag k',header=TRUE)
a<-table.element(a,hyperlink('basics.htm','PACF(k)','click here for more information about the Partial Autocorrelation Function'),header=TRUE)
a<-table.element(a,'T-STAT',header=TRUE)
a<-table.element(a,'P-value',header=TRUE)
a<-table.row.end(a)
for (i in 1:par1) {
a<-table.row.start(a)
a<-table.element(a,i,header=TRUE)
a<-table.element(a,round(mypacf[i],6))
mytstat <- mypacf[i]*sqrtn
a<-table.element(a,round(mytstat,4))
a<-table.element(a,round(1-pt(abs(mytstat),lengthx),6))
a<-table.row.end(a)
}
a<-table.end(a)
table.save(a,file='mytable1.tab')