Free Statistics

of Irreproducible Research!

Author's title

Author*Unverified author*
R Software Modulerwasp_autocorrelation.wasp
Title produced by software(Partial) Autocorrelation Function
Date of computationThu, 20 Oct 2016 22:10:17 +0100
Cite this page as followsStatistical Computations at FreeStatistics.org, Office for Research Development and Education, URL https://freestatistics.org/blog/index.php?v=date/2016/Oct/20/t14769978613g6enuzpo6xavca.htm/, Retrieved Fri, 17 May 2024 03:09:37 +0200
Statistical Computations at FreeStatistics.org, Office for Research Development and Education, URL https://freestatistics.org/blog/index.php?pk=, Retrieved Fri, 17 May 2024 03:09:37 +0200
QR Codes:

Original text written by user:
IsPrivate?No (this computation is public)
User-defined keywords
Estimated Impact0
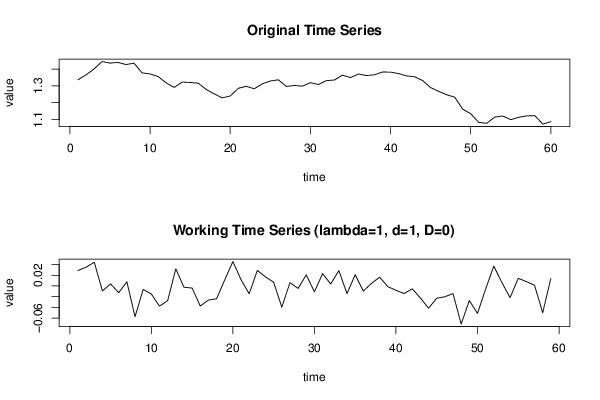
Dataseries X:
1.336
1.3649
1.3999
1.4442
1.4349
1.4388
1.4264
1.4343
1.377
1.3706
1.3556
1.3179
1.2905
1.3224
1.3201
1.3162
1.2789
1.2526
1.2288
1.24
1.2856
1.2974
1.2828
1.3119
1.3288
1.3359
1.2964
1.3026
1.2982
1.3189
1.308
1.331
1.3348
1.3635
1.3493
1.3704
1.361
1.3658
1.3823
1.3812
1.3732
1.3592
1.3539
1.3316
1.2901
1.2673
1.2472
1.2331
1.1621
1.135
1.0838
1.0779
1.115
1.1213
1.0996
1.1139
1.1221
1.1235
1.0736
1.0877


Summary of computational transaction
Raw Inputview raw input (R code)
Raw Outputview raw output of R engine
Computing time1 seconds
R Server'Sir Maurice George Kendall' @ kendall.wessa.net

\begin{tabular}{lllllllll}
\hline
Summary of computational transaction \tabularnewline
Raw Input & view raw input (R code)  \tabularnewline
Raw Output & view raw output of R engine  \tabularnewline
Computing time & 1 seconds \tabularnewline
R Server & 'Sir Maurice George Kendall' @ kendall.wessa.net \tabularnewline
\hline
\end{tabular}
%Source: https://freestatistics.org/blog/index.php?pk=&T=0

[TABLE]
[ROW][C]Summary of computational transaction[/C][/ROW]
[ROW][C]Raw Input[/C][C]view raw input (R code) [/C][/ROW]
[ROW][C]Raw Output[/C][C]view raw output of R engine [/C][/ROW]
[ROW][C]Computing time[/C][C]1 seconds[/C][/ROW]
[ROW][C]R Server[/C][C]'Sir Maurice George Kendall' @ kendall.wessa.net[/C][/ROW]
[/TABLE]
Source: https://freestatistics.org/blog/index.php?pk=&T=0

Globally Unique Identifier (entire table): ba.freestatistics.org/blog/index.php?pk=&T=0

As an alternative you can also use a QR Code:  

The GUIDs for individual cells are displayed in the table below:

Summary of computational transaction
Raw Inputview raw input (R code)
Raw Outputview raw output of R engine
Computing time1 seconds
R Server'Sir Maurice George Kendall' @ kendall.wessa.net


Autocorrelation Function
Time lag kACF(k)T-STATP-value
10.2266451.74090.043457
20.169391.30110.09914
3-0.022812-0.17520.430752
40.2172791.6690.050213
5-0.104181-0.80020.213393
6-0.008641-0.06640.473653
7-0.093842-0.72080.236936
80.0193520.14860.44117
9-0.145805-1.120.133636
100.1123450.86290.195834
11-0.126026-0.9680.168493
12-0.110734-0.85060.199225
13-0.196063-1.5060.068703
140.0168920.12970.448604
15-0.198512-1.52480.066326
16-0.101849-0.78230.218577
17-0.057787-0.44390.329379
180.1829571.40530.082585
19-0.064-0.49160.312416
200.0134950.10370.458896
21-0.137119-1.05320.148264
220.1166280.89580.18699
23-0.151219-1.16150.125051
24-0.022489-0.17270.431724
25-0.208925-1.60480.056941
260.0067670.0520.479361
27-0.1178-0.90480.184616
280.0906080.6960.244588
29-0.044919-0.3450.365649
300.0251920.19350.423616
310.0359010.27580.391847
320.3073962.36120.01077
330.1089090.83650.203112
340.04150.31880.375515
35-0.01752-0.13460.446705
360.1310021.00620.159203
370.0473450.36370.358704
380.0240680.18490.426982
390.0642530.49350.311733
400.0791520.6080.272766
41-0.098478-0.75640.226203
420.0320520.24620.403191
43-0.098257-0.75470.226707
44-0.105844-0.8130.209742
45-0.178909-1.37420.087285
46-0.046287-0.35550.361727
47-0.139962-1.07510.14336
48-0.085214-0.65450.257654

\begin{tabular}{lllllllll}
\hline
Autocorrelation Function \tabularnewline
Time lag k & ACF(k) & T-STAT & P-value \tabularnewline
1 & 0.226645 & 1.7409 & 0.043457 \tabularnewline
2 & 0.16939 & 1.3011 & 0.09914 \tabularnewline
3 & -0.022812 & -0.1752 & 0.430752 \tabularnewline
4 & 0.217279 & 1.669 & 0.050213 \tabularnewline
5 & -0.104181 & -0.8002 & 0.213393 \tabularnewline
6 & -0.008641 & -0.0664 & 0.473653 \tabularnewline
7 & -0.093842 & -0.7208 & 0.236936 \tabularnewline
8 & 0.019352 & 0.1486 & 0.44117 \tabularnewline
9 & -0.145805 & -1.12 & 0.133636 \tabularnewline
10 & 0.112345 & 0.8629 & 0.195834 \tabularnewline
11 & -0.126026 & -0.968 & 0.168493 \tabularnewline
12 & -0.110734 & -0.8506 & 0.199225 \tabularnewline
13 & -0.196063 & -1.506 & 0.068703 \tabularnewline
14 & 0.016892 & 0.1297 & 0.448604 \tabularnewline
15 & -0.198512 & -1.5248 & 0.066326 \tabularnewline
16 & -0.101849 & -0.7823 & 0.218577 \tabularnewline
17 & -0.057787 & -0.4439 & 0.329379 \tabularnewline
18 & 0.182957 & 1.4053 & 0.082585 \tabularnewline
19 & -0.064 & -0.4916 & 0.312416 \tabularnewline
20 & 0.013495 & 0.1037 & 0.458896 \tabularnewline
21 & -0.137119 & -1.0532 & 0.148264 \tabularnewline
22 & 0.116628 & 0.8958 & 0.18699 \tabularnewline
23 & -0.151219 & -1.1615 & 0.125051 \tabularnewline
24 & -0.022489 & -0.1727 & 0.431724 \tabularnewline
25 & -0.208925 & -1.6048 & 0.056941 \tabularnewline
26 & 0.006767 & 0.052 & 0.479361 \tabularnewline
27 & -0.1178 & -0.9048 & 0.184616 \tabularnewline
28 & 0.090608 & 0.696 & 0.244588 \tabularnewline
29 & -0.044919 & -0.345 & 0.365649 \tabularnewline
30 & 0.025192 & 0.1935 & 0.423616 \tabularnewline
31 & 0.035901 & 0.2758 & 0.391847 \tabularnewline
32 & 0.307396 & 2.3612 & 0.01077 \tabularnewline
33 & 0.108909 & 0.8365 & 0.203112 \tabularnewline
34 & 0.0415 & 0.3188 & 0.375515 \tabularnewline
35 & -0.01752 & -0.1346 & 0.446705 \tabularnewline
36 & 0.131002 & 1.0062 & 0.159203 \tabularnewline
37 & 0.047345 & 0.3637 & 0.358704 \tabularnewline
38 & 0.024068 & 0.1849 & 0.426982 \tabularnewline
39 & 0.064253 & 0.4935 & 0.311733 \tabularnewline
40 & 0.079152 & 0.608 & 0.272766 \tabularnewline
41 & -0.098478 & -0.7564 & 0.226203 \tabularnewline
42 & 0.032052 & 0.2462 & 0.403191 \tabularnewline
43 & -0.098257 & -0.7547 & 0.226707 \tabularnewline
44 & -0.105844 & -0.813 & 0.209742 \tabularnewline
45 & -0.178909 & -1.3742 & 0.087285 \tabularnewline
46 & -0.046287 & -0.3555 & 0.361727 \tabularnewline
47 & -0.139962 & -1.0751 & 0.14336 \tabularnewline
48 & -0.085214 & -0.6545 & 0.257654 \tabularnewline
\hline
\end{tabular}
%Source: https://freestatistics.org/blog/index.php?pk=&T=1

[TABLE]
[ROW][C]Autocorrelation Function[/C][/ROW]
[ROW][C]Time lag k[/C][C]ACF(k)[/C][C]T-STAT[/C][C]P-value[/C][/ROW]
[ROW][C]1[/C][C]0.226645[/C][C]1.7409[/C][C]0.043457[/C][/ROW]
[ROW][C]2[/C][C]0.16939[/C][C]1.3011[/C][C]0.09914[/C][/ROW]
[ROW][C]3[/C][C]-0.022812[/C][C]-0.1752[/C][C]0.430752[/C][/ROW]
[ROW][C]4[/C][C]0.217279[/C][C]1.669[/C][C]0.050213[/C][/ROW]
[ROW][C]5[/C][C]-0.104181[/C][C]-0.8002[/C][C]0.213393[/C][/ROW]
[ROW][C]6[/C][C]-0.008641[/C][C]-0.0664[/C][C]0.473653[/C][/ROW]
[ROW][C]7[/C][C]-0.093842[/C][C]-0.7208[/C][C]0.236936[/C][/ROW]
[ROW][C]8[/C][C]0.019352[/C][C]0.1486[/C][C]0.44117[/C][/ROW]
[ROW][C]9[/C][C]-0.145805[/C][C]-1.12[/C][C]0.133636[/C][/ROW]
[ROW][C]10[/C][C]0.112345[/C][C]0.8629[/C][C]0.195834[/C][/ROW]
[ROW][C]11[/C][C]-0.126026[/C][C]-0.968[/C][C]0.168493[/C][/ROW]
[ROW][C]12[/C][C]-0.110734[/C][C]-0.8506[/C][C]0.199225[/C][/ROW]
[ROW][C]13[/C][C]-0.196063[/C][C]-1.506[/C][C]0.068703[/C][/ROW]
[ROW][C]14[/C][C]0.016892[/C][C]0.1297[/C][C]0.448604[/C][/ROW]
[ROW][C]15[/C][C]-0.198512[/C][C]-1.5248[/C][C]0.066326[/C][/ROW]
[ROW][C]16[/C][C]-0.101849[/C][C]-0.7823[/C][C]0.218577[/C][/ROW]
[ROW][C]17[/C][C]-0.057787[/C][C]-0.4439[/C][C]0.329379[/C][/ROW]
[ROW][C]18[/C][C]0.182957[/C][C]1.4053[/C][C]0.082585[/C][/ROW]
[ROW][C]19[/C][C]-0.064[/C][C]-0.4916[/C][C]0.312416[/C][/ROW]
[ROW][C]20[/C][C]0.013495[/C][C]0.1037[/C][C]0.458896[/C][/ROW]
[ROW][C]21[/C][C]-0.137119[/C][C]-1.0532[/C][C]0.148264[/C][/ROW]
[ROW][C]22[/C][C]0.116628[/C][C]0.8958[/C][C]0.18699[/C][/ROW]
[ROW][C]23[/C][C]-0.151219[/C][C]-1.1615[/C][C]0.125051[/C][/ROW]
[ROW][C]24[/C][C]-0.022489[/C][C]-0.1727[/C][C]0.431724[/C][/ROW]
[ROW][C]25[/C][C]-0.208925[/C][C]-1.6048[/C][C]0.056941[/C][/ROW]
[ROW][C]26[/C][C]0.006767[/C][C]0.052[/C][C]0.479361[/C][/ROW]
[ROW][C]27[/C][C]-0.1178[/C][C]-0.9048[/C][C]0.184616[/C][/ROW]
[ROW][C]28[/C][C]0.090608[/C][C]0.696[/C][C]0.244588[/C][/ROW]
[ROW][C]29[/C][C]-0.044919[/C][C]-0.345[/C][C]0.365649[/C][/ROW]
[ROW][C]30[/C][C]0.025192[/C][C]0.1935[/C][C]0.423616[/C][/ROW]
[ROW][C]31[/C][C]0.035901[/C][C]0.2758[/C][C]0.391847[/C][/ROW]
[ROW][C]32[/C][C]0.307396[/C][C]2.3612[/C][C]0.01077[/C][/ROW]
[ROW][C]33[/C][C]0.108909[/C][C]0.8365[/C][C]0.203112[/C][/ROW]
[ROW][C]34[/C][C]0.0415[/C][C]0.3188[/C][C]0.375515[/C][/ROW]
[ROW][C]35[/C][C]-0.01752[/C][C]-0.1346[/C][C]0.446705[/C][/ROW]
[ROW][C]36[/C][C]0.131002[/C][C]1.0062[/C][C]0.159203[/C][/ROW]
[ROW][C]37[/C][C]0.047345[/C][C]0.3637[/C][C]0.358704[/C][/ROW]
[ROW][C]38[/C][C]0.024068[/C][C]0.1849[/C][C]0.426982[/C][/ROW]
[ROW][C]39[/C][C]0.064253[/C][C]0.4935[/C][C]0.311733[/C][/ROW]
[ROW][C]40[/C][C]0.079152[/C][C]0.608[/C][C]0.272766[/C][/ROW]
[ROW][C]41[/C][C]-0.098478[/C][C]-0.7564[/C][C]0.226203[/C][/ROW]
[ROW][C]42[/C][C]0.032052[/C][C]0.2462[/C][C]0.403191[/C][/ROW]
[ROW][C]43[/C][C]-0.098257[/C][C]-0.7547[/C][C]0.226707[/C][/ROW]
[ROW][C]44[/C][C]-0.105844[/C][C]-0.813[/C][C]0.209742[/C][/ROW]
[ROW][C]45[/C][C]-0.178909[/C][C]-1.3742[/C][C]0.087285[/C][/ROW]
[ROW][C]46[/C][C]-0.046287[/C][C]-0.3555[/C][C]0.361727[/C][/ROW]
[ROW][C]47[/C][C]-0.139962[/C][C]-1.0751[/C][C]0.14336[/C][/ROW]
[ROW][C]48[/C][C]-0.085214[/C][C]-0.6545[/C][C]0.257654[/C][/ROW]
[/TABLE]
Source: https://freestatistics.org/blog/index.php?pk=&T=1

Globally Unique Identifier (entire table): ba.freestatistics.org/blog/index.php?pk=&T=1

As an alternative you can also use a QR Code:  

The GUIDs for individual cells are displayed in the table below:

Autocorrelation Function
Time lag kACF(k)T-STATP-value
10.2266451.74090.043457
20.169391.30110.09914
3-0.022812-0.17520.430752
40.2172791.6690.050213
5-0.104181-0.80020.213393
6-0.008641-0.06640.473653
7-0.093842-0.72080.236936
80.0193520.14860.44117
9-0.145805-1.120.133636
100.1123450.86290.195834
11-0.126026-0.9680.168493
12-0.110734-0.85060.199225
13-0.196063-1.5060.068703
140.0168920.12970.448604
15-0.198512-1.52480.066326
16-0.101849-0.78230.218577
17-0.057787-0.44390.329379
180.1829571.40530.082585
19-0.064-0.49160.312416
200.0134950.10370.458896
21-0.137119-1.05320.148264
220.1166280.89580.18699
23-0.151219-1.16150.125051
24-0.022489-0.17270.431724
25-0.208925-1.60480.056941
260.0067670.0520.479361
27-0.1178-0.90480.184616
280.0906080.6960.244588
29-0.044919-0.3450.365649
300.0251920.19350.423616
310.0359010.27580.391847
320.3073962.36120.01077
330.1089090.83650.203112
340.04150.31880.375515
35-0.01752-0.13460.446705
360.1310021.00620.159203
370.0473450.36370.358704
380.0240680.18490.426982
390.0642530.49350.311733
400.0791520.6080.272766
41-0.098478-0.75640.226203
420.0320520.24620.403191
43-0.098257-0.75470.226707
44-0.105844-0.8130.209742
45-0.178909-1.37420.087285
46-0.046287-0.35550.361727
47-0.139962-1.07510.14336
48-0.085214-0.65450.257654


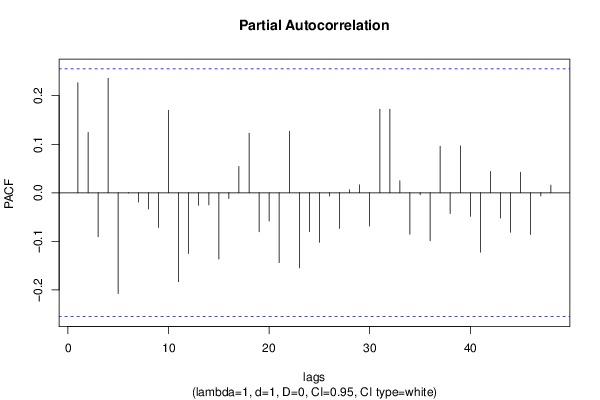
Partial Autocorrelation Function
Time lag kPACF(k)T-STATP-value
10.2266451.74090.043457
20.1244130.95560.171579
3-0.09061-0.6960.244585
40.2358671.81170.037559
5-0.20765-1.5950.058029
6-0.000578-0.00440.498238
7-0.018883-0.1450.442587
8-0.03326-0.25550.399623
9-0.071647-0.55030.292085
100.1701941.30730.098093
11-0.183169-1.40690.082345
12-0.124947-0.95970.170552
13-0.025573-0.19640.422474
14-0.02497-0.19180.42428
15-0.136484-1.04840.149376
16-0.011748-0.09020.464201
170.0542720.41690.339143
180.1228220.94340.174658
19-0.080178-0.61590.270177
20-0.058264-0.44750.328064
21-0.143952-1.10570.13667
220.1270010.97550.166645
23-0.154715-1.18840.119721
24-0.080014-0.61460.270591
25-0.102124-0.78440.217963
26-0.006486-0.04980.480216
27-0.073414-0.56390.287479
280.0063130.04850.480743
290.0163020.12520.450387
30-0.068401-0.52540.300638
310.172231.32290.095483
320.1721561.32240.095577
330.0248090.19060.424762
34-0.085418-0.65610.257153
35-0.004034-0.0310.487692
36-0.098819-0.7590.225424
370.0959820.73730.231946
38-0.042719-0.32810.371987
390.0966860.74270.230316
40-0.048664-0.37380.354947
41-0.12225-0.9390.175775
420.0439840.33790.368337
43-0.051839-0.39820.345965
44-0.081445-0.62560.266999
450.0422580.32460.37332
46-0.08605-0.6610.255605
47-0.006714-0.05160.479522
480.0158710.12190.451694

\begin{tabular}{lllllllll}
\hline
Partial Autocorrelation Function \tabularnewline
Time lag k & PACF(k) & T-STAT & P-value \tabularnewline
1 & 0.226645 & 1.7409 & 0.043457 \tabularnewline
2 & 0.124413 & 0.9556 & 0.171579 \tabularnewline
3 & -0.09061 & -0.696 & 0.244585 \tabularnewline
4 & 0.235867 & 1.8117 & 0.037559 \tabularnewline
5 & -0.20765 & -1.595 & 0.058029 \tabularnewline
6 & -0.000578 & -0.0044 & 0.498238 \tabularnewline
7 & -0.018883 & -0.145 & 0.442587 \tabularnewline
8 & -0.03326 & -0.2555 & 0.399623 \tabularnewline
9 & -0.071647 & -0.5503 & 0.292085 \tabularnewline
10 & 0.170194 & 1.3073 & 0.098093 \tabularnewline
11 & -0.183169 & -1.4069 & 0.082345 \tabularnewline
12 & -0.124947 & -0.9597 & 0.170552 \tabularnewline
13 & -0.025573 & -0.1964 & 0.422474 \tabularnewline
14 & -0.02497 & -0.1918 & 0.42428 \tabularnewline
15 & -0.136484 & -1.0484 & 0.149376 \tabularnewline
16 & -0.011748 & -0.0902 & 0.464201 \tabularnewline
17 & 0.054272 & 0.4169 & 0.339143 \tabularnewline
18 & 0.122822 & 0.9434 & 0.174658 \tabularnewline
19 & -0.080178 & -0.6159 & 0.270177 \tabularnewline
20 & -0.058264 & -0.4475 & 0.328064 \tabularnewline
21 & -0.143952 & -1.1057 & 0.13667 \tabularnewline
22 & 0.127001 & 0.9755 & 0.166645 \tabularnewline
23 & -0.154715 & -1.1884 & 0.119721 \tabularnewline
24 & -0.080014 & -0.6146 & 0.270591 \tabularnewline
25 & -0.102124 & -0.7844 & 0.217963 \tabularnewline
26 & -0.006486 & -0.0498 & 0.480216 \tabularnewline
27 & -0.073414 & -0.5639 & 0.287479 \tabularnewline
28 & 0.006313 & 0.0485 & 0.480743 \tabularnewline
29 & 0.016302 & 0.1252 & 0.450387 \tabularnewline
30 & -0.068401 & -0.5254 & 0.300638 \tabularnewline
31 & 0.17223 & 1.3229 & 0.095483 \tabularnewline
32 & 0.172156 & 1.3224 & 0.095577 \tabularnewline
33 & 0.024809 & 0.1906 & 0.424762 \tabularnewline
34 & -0.085418 & -0.6561 & 0.257153 \tabularnewline
35 & -0.004034 & -0.031 & 0.487692 \tabularnewline
36 & -0.098819 & -0.759 & 0.225424 \tabularnewline
37 & 0.095982 & 0.7373 & 0.231946 \tabularnewline
38 & -0.042719 & -0.3281 & 0.371987 \tabularnewline
39 & 0.096686 & 0.7427 & 0.230316 \tabularnewline
40 & -0.048664 & -0.3738 & 0.354947 \tabularnewline
41 & -0.12225 & -0.939 & 0.175775 \tabularnewline
42 & 0.043984 & 0.3379 & 0.368337 \tabularnewline
43 & -0.051839 & -0.3982 & 0.345965 \tabularnewline
44 & -0.081445 & -0.6256 & 0.266999 \tabularnewline
45 & 0.042258 & 0.3246 & 0.37332 \tabularnewline
46 & -0.08605 & -0.661 & 0.255605 \tabularnewline
47 & -0.006714 & -0.0516 & 0.479522 \tabularnewline
48 & 0.015871 & 0.1219 & 0.451694 \tabularnewline
\hline
\end{tabular}
%Source: https://freestatistics.org/blog/index.php?pk=&T=2

[TABLE]
[ROW][C]Partial Autocorrelation Function[/C][/ROW]
[ROW][C]Time lag k[/C][C]PACF(k)[/C][C]T-STAT[/C][C]P-value[/C][/ROW]
[ROW][C]1[/C][C]0.226645[/C][C]1.7409[/C][C]0.043457[/C][/ROW]
[ROW][C]2[/C][C]0.124413[/C][C]0.9556[/C][C]0.171579[/C][/ROW]
[ROW][C]3[/C][C]-0.09061[/C][C]-0.696[/C][C]0.244585[/C][/ROW]
[ROW][C]4[/C][C]0.235867[/C][C]1.8117[/C][C]0.037559[/C][/ROW]
[ROW][C]5[/C][C]-0.20765[/C][C]-1.595[/C][C]0.058029[/C][/ROW]
[ROW][C]6[/C][C]-0.000578[/C][C]-0.0044[/C][C]0.498238[/C][/ROW]
[ROW][C]7[/C][C]-0.018883[/C][C]-0.145[/C][C]0.442587[/C][/ROW]
[ROW][C]8[/C][C]-0.03326[/C][C]-0.2555[/C][C]0.399623[/C][/ROW]
[ROW][C]9[/C][C]-0.071647[/C][C]-0.5503[/C][C]0.292085[/C][/ROW]
[ROW][C]10[/C][C]0.170194[/C][C]1.3073[/C][C]0.098093[/C][/ROW]
[ROW][C]11[/C][C]-0.183169[/C][C]-1.4069[/C][C]0.082345[/C][/ROW]
[ROW][C]12[/C][C]-0.124947[/C][C]-0.9597[/C][C]0.170552[/C][/ROW]
[ROW][C]13[/C][C]-0.025573[/C][C]-0.1964[/C][C]0.422474[/C][/ROW]
[ROW][C]14[/C][C]-0.02497[/C][C]-0.1918[/C][C]0.42428[/C][/ROW]
[ROW][C]15[/C][C]-0.136484[/C][C]-1.0484[/C][C]0.149376[/C][/ROW]
[ROW][C]16[/C][C]-0.011748[/C][C]-0.0902[/C][C]0.464201[/C][/ROW]
[ROW][C]17[/C][C]0.054272[/C][C]0.4169[/C][C]0.339143[/C][/ROW]
[ROW][C]18[/C][C]0.122822[/C][C]0.9434[/C][C]0.174658[/C][/ROW]
[ROW][C]19[/C][C]-0.080178[/C][C]-0.6159[/C][C]0.270177[/C][/ROW]
[ROW][C]20[/C][C]-0.058264[/C][C]-0.4475[/C][C]0.328064[/C][/ROW]
[ROW][C]21[/C][C]-0.143952[/C][C]-1.1057[/C][C]0.13667[/C][/ROW]
[ROW][C]22[/C][C]0.127001[/C][C]0.9755[/C][C]0.166645[/C][/ROW]
[ROW][C]23[/C][C]-0.154715[/C][C]-1.1884[/C][C]0.119721[/C][/ROW]
[ROW][C]24[/C][C]-0.080014[/C][C]-0.6146[/C][C]0.270591[/C][/ROW]
[ROW][C]25[/C][C]-0.102124[/C][C]-0.7844[/C][C]0.217963[/C][/ROW]
[ROW][C]26[/C][C]-0.006486[/C][C]-0.0498[/C][C]0.480216[/C][/ROW]
[ROW][C]27[/C][C]-0.073414[/C][C]-0.5639[/C][C]0.287479[/C][/ROW]
[ROW][C]28[/C][C]0.006313[/C][C]0.0485[/C][C]0.480743[/C][/ROW]
[ROW][C]29[/C][C]0.016302[/C][C]0.1252[/C][C]0.450387[/C][/ROW]
[ROW][C]30[/C][C]-0.068401[/C][C]-0.5254[/C][C]0.300638[/C][/ROW]
[ROW][C]31[/C][C]0.17223[/C][C]1.3229[/C][C]0.095483[/C][/ROW]
[ROW][C]32[/C][C]0.172156[/C][C]1.3224[/C][C]0.095577[/C][/ROW]
[ROW][C]33[/C][C]0.024809[/C][C]0.1906[/C][C]0.424762[/C][/ROW]
[ROW][C]34[/C][C]-0.085418[/C][C]-0.6561[/C][C]0.257153[/C][/ROW]
[ROW][C]35[/C][C]-0.004034[/C][C]-0.031[/C][C]0.487692[/C][/ROW]
[ROW][C]36[/C][C]-0.098819[/C][C]-0.759[/C][C]0.225424[/C][/ROW]
[ROW][C]37[/C][C]0.095982[/C][C]0.7373[/C][C]0.231946[/C][/ROW]
[ROW][C]38[/C][C]-0.042719[/C][C]-0.3281[/C][C]0.371987[/C][/ROW]
[ROW][C]39[/C][C]0.096686[/C][C]0.7427[/C][C]0.230316[/C][/ROW]
[ROW][C]40[/C][C]-0.048664[/C][C]-0.3738[/C][C]0.354947[/C][/ROW]
[ROW][C]41[/C][C]-0.12225[/C][C]-0.939[/C][C]0.175775[/C][/ROW]
[ROW][C]42[/C][C]0.043984[/C][C]0.3379[/C][C]0.368337[/C][/ROW]
[ROW][C]43[/C][C]-0.051839[/C][C]-0.3982[/C][C]0.345965[/C][/ROW]
[ROW][C]44[/C][C]-0.081445[/C][C]-0.6256[/C][C]0.266999[/C][/ROW]
[ROW][C]45[/C][C]0.042258[/C][C]0.3246[/C][C]0.37332[/C][/ROW]
[ROW][C]46[/C][C]-0.08605[/C][C]-0.661[/C][C]0.255605[/C][/ROW]
[ROW][C]47[/C][C]-0.006714[/C][C]-0.0516[/C][C]0.479522[/C][/ROW]
[ROW][C]48[/C][C]0.015871[/C][C]0.1219[/C][C]0.451694[/C][/ROW]
[/TABLE]
Source: https://freestatistics.org/blog/index.php?pk=&T=2

Globally Unique Identifier (entire table): ba.freestatistics.org/blog/index.php?pk=&T=2

As an alternative you can also use a QR Code:  

The GUIDs for individual cells are displayed in the table below:

Partial Autocorrelation Function
Time lag kPACF(k)T-STATP-value
10.2266451.74090.043457
20.1244130.95560.171579
3-0.09061-0.6960.244585
40.2358671.81170.037559
5-0.20765-1.5950.058029
6-0.000578-0.00440.498238
7-0.018883-0.1450.442587
8-0.03326-0.25550.399623
9-0.071647-0.55030.292085
100.1701941.30730.098093
11-0.183169-1.40690.082345
12-0.124947-0.95970.170552
13-0.025573-0.19640.422474
14-0.02497-0.19180.42428
15-0.136484-1.04840.149376
16-0.011748-0.09020.464201
170.0542720.41690.339143
180.1228220.94340.174658
19-0.080178-0.61590.270177
20-0.058264-0.44750.328064
21-0.143952-1.10570.13667
220.1270010.97550.166645
23-0.154715-1.18840.119721
24-0.080014-0.61460.270591
25-0.102124-0.78440.217963
26-0.006486-0.04980.480216
27-0.073414-0.56390.287479
280.0063130.04850.480743
290.0163020.12520.450387
30-0.068401-0.52540.300638
310.172231.32290.095483
320.1721561.32240.095577
330.0248090.19060.424762
34-0.085418-0.65610.257153
35-0.004034-0.0310.487692
36-0.098819-0.7590.225424
370.0959820.73730.231946
38-0.042719-0.32810.371987
390.0966860.74270.230316
40-0.048664-0.37380.354947
41-0.12225-0.9390.175775
420.0439840.33790.368337
43-0.051839-0.39820.345965
44-0.081445-0.62560.266999
450.0422580.32460.37332
46-0.08605-0.6610.255605
47-0.006714-0.05160.479522
480.0158710.12190.451694


Parameters (Session):
par1 = 48 ; par2 = 1 ; par3 = 1 ; par4 = 0 ; par5 = 12 ; par6 = White Noise ; par7 = 0.95 ;
Parameters (R input):
par1 = 48 ; par2 = 1 ; par3 = 1 ; par4 = 0 ; par5 = 12 ; par6 = White Noise ; par7 = 0.95 ; par8 = ;
R code (references can be found in the software module):
par8 <- ''
par7 <- '0.95'
par6 <- 'White Noise'
par5 <- '12'
par4 <- '0'
par3 <- '0'
par2 <- '1'
par1 <- '48'
if (par1 == 'Default') {
par1 = 10*log10(length(x))
} else {
par1 <- as.numeric(par1)
}
par2 <- as.numeric(par2)
par3 <- as.numeric(par3)
par4 <- as.numeric(par4)
par5 <- as.numeric(par5)
if (par6 == 'White Noise') par6 <- 'white' else par6 <- 'ma'
par7 <- as.numeric(par7)
if (par8 != '') par8 <- as.numeric(par8)
x <- na.omit(x)
ox <- x
if (par8 == '') {
if (par2 == 0) {
x <- log(x)
} else {
x <- (x ^ par2 - 1) / par2
}
} else {
x <- log(x,base=par8)
}
if (par3 > 0) x <- diff(x,lag=1,difference=par3)
if (par4 > 0) x <- diff(x,lag=par5,difference=par4)
bitmap(file='picts.png')
op <- par(mfrow=c(2,1))
plot(ox,type='l',main='Original Time Series',xlab='time',ylab='value')
if (par8=='') {
mytitle <- paste('Working Time Series (lambda=',par2,', d=',par3,', D=',par4,')',sep='')
mysub <- paste('(lambda=',par2,', d=',par3,', D=',par4,', CI=', par7, ', CI type=',par6,')',sep='')
} else {
mytitle <- paste('Working Time Series (base=',par8,', d=',par3,', D=',par4,')',sep='')
mysub <- paste('(base=',par8,', d=',par3,', D=',par4,', CI=', par7, ', CI type=',par6,')',sep='')
}
plot(x,type='l', main=mytitle,xlab='time',ylab='value')
par(op)
dev.off()
bitmap(file='pic1.png')
racf <- acf(x, par1, main='Autocorrelation', xlab='time lag', ylab='ACF', ci.type=par6, ci=par7, sub=mysub)
dev.off()
bitmap(file='pic2.png')
rpacf <- pacf(x,par1,main='Partial Autocorrelation',xlab='lags',ylab='PACF',sub=mysub)
dev.off()
(myacf <- c(racf$acf))
(mypacf <- c(rpacf$acf))
lengthx <- length(x)
sqrtn <- sqrt(lengthx)
load(file='createtable')
a<-table.start()
a<-table.row.start(a)
a<-table.element(a,'Autocorrelation Function',4,TRUE)
a<-table.row.end(a)
a<-table.row.start(a)
a<-table.element(a,'Time lag k',header=TRUE)
a<-table.element(a,hyperlink('basics.htm','ACF(k)','click here for more information about the Autocorrelation Function'),header=TRUE)
a<-table.element(a,'T-STAT',header=TRUE)
a<-table.element(a,'P-value',header=TRUE)
a<-table.row.end(a)
for (i in 2:(par1+1)) {
a<-table.row.start(a)
a<-table.element(a,i-1,header=TRUE)
a<-table.element(a,round(myacf[i],6))
mytstat <- myacf[i]*sqrtn
a<-table.element(a,round(mytstat,4))
a<-table.element(a,round(1-pt(abs(mytstat),lengthx),6))
a<-table.row.end(a)
}
a<-table.end(a)
table.save(a,file='mytable.tab')
a<-table.start()
a<-table.row.start(a)
a<-table.element(a,'Partial Autocorrelation Function',4,TRUE)
a<-table.row.end(a)
a<-table.row.start(a)
a<-table.element(a,'Time lag k',header=TRUE)
a<-table.element(a,hyperlink('basics.htm','PACF(k)','click here for more information about the Partial Autocorrelation Function'),header=TRUE)
a<-table.element(a,'T-STAT',header=TRUE)
a<-table.element(a,'P-value',header=TRUE)
a<-table.row.end(a)
for (i in 1:par1) {
a<-table.row.start(a)
a<-table.element(a,i,header=TRUE)
a<-table.element(a,round(mypacf[i],6))
mytstat <- mypacf[i]*sqrtn
a<-table.element(a,round(mytstat,4))
a<-table.element(a,round(1-pt(abs(mytstat),lengthx),6))
a<-table.row.end(a)
}
a<-table.end(a)
table.save(a,file='mytable1.tab')