Free Statistics

of Irreproducible Research!

Author's title

Author*Unverified author*
R Software Modulerwasp_autocorrelation.wasp
Title produced by software(Partial) Autocorrelation Function
Date of computationThu, 20 Oct 2016 10:30:26 +0100
Cite this page as followsStatistical Computations at FreeStatistics.org, Office for Research Development and Education, URL https://freestatistics.org/blog/index.php?v=date/2016/Oct/20/t1476955884b7p382sqw0tqeja.htm/, Retrieved Tue, 21 May 2024 04:02:26 +0200
Statistical Computations at FreeStatistics.org, Office for Research Development and Education, URL https://freestatistics.org/blog/index.php?pk=, Retrieved Tue, 21 May 2024 04:02:26 +0200
QR Codes:

Original text written by user:
IsPrivate?No (this computation is public)
User-defined keywords
Estimated Impact0
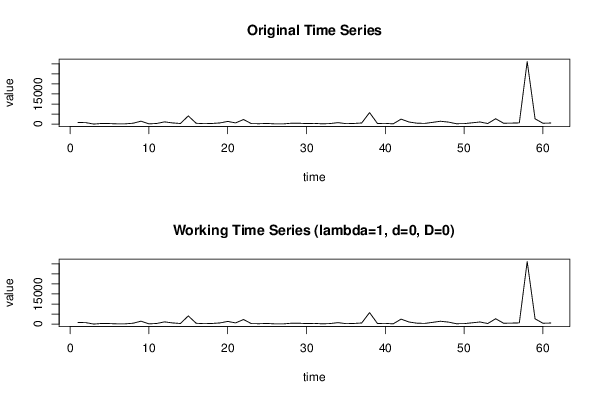
Dataseries X:
829
721
19
311
264
120
135
435
1456
127
313
1104
585
295
4073
408
224
312
571
1336
586
2279
239
198
320
112
89
407
434
268
354
150
273
728
226
310
554
5725
303
360
129
2466
1042
456
335
866
1417
994
201
224
640
1043
293
2659
436
485
610
31127
2613
432
532


Summary of computational transaction
Raw Inputview raw input (R code)
Raw Outputview raw output of R engine
Computing time1 seconds
R Server'Gwilym Jenkins' @ jenkins.wessa.net

\begin{tabular}{lllllllll}
\hline
Summary of computational transaction \tabularnewline
Raw Input & view raw input (R code)  \tabularnewline
Raw Output & view raw output of R engine  \tabularnewline
Computing time & 1 seconds \tabularnewline
R Server & 'Gwilym Jenkins' @ jenkins.wessa.net \tabularnewline
\hline
\end{tabular}
%Source: https://freestatistics.org/blog/index.php?pk=&T=0

[TABLE]
[ROW][C]Summary of computational transaction[/C][/ROW]
[ROW][C]Raw Input[/C][C]view raw input (R code) [/C][/ROW]
[ROW][C]Raw Output[/C][C]view raw output of R engine [/C][/ROW]
[ROW][C]Computing time[/C][C]1 seconds[/C][/ROW]
[ROW][C]R Server[/C][C]'Gwilym Jenkins' @ jenkins.wessa.net[/C][/ROW]
[/TABLE]
Source: https://freestatistics.org/blog/index.php?pk=&T=0

Globally Unique Identifier (entire table): ba.freestatistics.org/blog/index.php?pk=&T=0

As an alternative you can also use a QR Code:  

The GUIDs for individual cells are displayed in the table below:

Summary of computational transaction
Raw Inputview raw input (R code)
Raw Outputview raw output of R engine
Computing time1 seconds
R Server'Gwilym Jenkins' @ jenkins.wessa.net


Autocorrelation Function
Time lag kACF(k)T-STATP-value
10.0329150.25710.398992
2-0.04125-0.32220.374212
3-0.039209-0.30620.380237
40.0669340.52280.301514
5-0.011736-0.09170.463633
60.0040730.03180.487364
7-0.004735-0.0370.485309
8-0.023799-0.18590.426579
9-0.022457-0.17540.430676
100.0016880.01320.494761
110.0091020.07110.471779
12-0.005787-0.04520.482048
13-0.020787-0.16230.435784
14-0.017402-0.13590.446167
15-0.002852-0.02230.491149
160.0674860.52710.300025
17-0.025731-0.2010.420698
18-0.019247-0.15030.440502
19-0.023536-0.18380.427382
200.1526291.19210.118925
21-0.003812-0.02980.488173
22-0.020368-0.15910.437067
23-0.005554-0.04340.482772
24-0.008157-0.06370.474705
25-0.018763-0.14650.441989
26-0.02312-0.18060.42865
27-0.015032-0.11740.453463
28-0.024772-0.19350.423614
29-0.014702-0.11480.454479
30-0.020647-0.16130.436211
31-0.033476-0.26150.397311
32-0.027917-0.2180.414065
33-0.024535-0.19160.424336
34-0.030435-0.23770.406452
35-0.034252-0.26750.394987
360.0333450.26040.397704
37-0.014586-0.11390.454838
380.005390.04210.48328
39-0.0097-0.07580.46993
40-0.027518-0.21490.415274
41-0.030761-0.24020.405471
42-0.02171-0.16960.432958
430.0929940.72630.235215
44-0.020855-0.16290.435575
45-0.01745-0.13630.446022
46-0.002312-0.01810.492825
47-0.024432-0.19080.424651
48-0.032747-0.25580.399496

\begin{tabular}{lllllllll}
\hline
Autocorrelation Function \tabularnewline
Time lag k & ACF(k) & T-STAT & P-value \tabularnewline
1 & 0.032915 & 0.2571 & 0.398992 \tabularnewline
2 & -0.04125 & -0.3222 & 0.374212 \tabularnewline
3 & -0.039209 & -0.3062 & 0.380237 \tabularnewline
4 & 0.066934 & 0.5228 & 0.301514 \tabularnewline
5 & -0.011736 & -0.0917 & 0.463633 \tabularnewline
6 & 0.004073 & 0.0318 & 0.487364 \tabularnewline
7 & -0.004735 & -0.037 & 0.485309 \tabularnewline
8 & -0.023799 & -0.1859 & 0.426579 \tabularnewline
9 & -0.022457 & -0.1754 & 0.430676 \tabularnewline
10 & 0.001688 & 0.0132 & 0.494761 \tabularnewline
11 & 0.009102 & 0.0711 & 0.471779 \tabularnewline
12 & -0.005787 & -0.0452 & 0.482048 \tabularnewline
13 & -0.020787 & -0.1623 & 0.435784 \tabularnewline
14 & -0.017402 & -0.1359 & 0.446167 \tabularnewline
15 & -0.002852 & -0.0223 & 0.491149 \tabularnewline
16 & 0.067486 & 0.5271 & 0.300025 \tabularnewline
17 & -0.025731 & -0.201 & 0.420698 \tabularnewline
18 & -0.019247 & -0.1503 & 0.440502 \tabularnewline
19 & -0.023536 & -0.1838 & 0.427382 \tabularnewline
20 & 0.152629 & 1.1921 & 0.118925 \tabularnewline
21 & -0.003812 & -0.0298 & 0.488173 \tabularnewline
22 & -0.020368 & -0.1591 & 0.437067 \tabularnewline
23 & -0.005554 & -0.0434 & 0.482772 \tabularnewline
24 & -0.008157 & -0.0637 & 0.474705 \tabularnewline
25 & -0.018763 & -0.1465 & 0.441989 \tabularnewline
26 & -0.02312 & -0.1806 & 0.42865 \tabularnewline
27 & -0.015032 & -0.1174 & 0.453463 \tabularnewline
28 & -0.024772 & -0.1935 & 0.423614 \tabularnewline
29 & -0.014702 & -0.1148 & 0.454479 \tabularnewline
30 & -0.020647 & -0.1613 & 0.436211 \tabularnewline
31 & -0.033476 & -0.2615 & 0.397311 \tabularnewline
32 & -0.027917 & -0.218 & 0.414065 \tabularnewline
33 & -0.024535 & -0.1916 & 0.424336 \tabularnewline
34 & -0.030435 & -0.2377 & 0.406452 \tabularnewline
35 & -0.034252 & -0.2675 & 0.394987 \tabularnewline
36 & 0.033345 & 0.2604 & 0.397704 \tabularnewline
37 & -0.014586 & -0.1139 & 0.454838 \tabularnewline
38 & 0.00539 & 0.0421 & 0.48328 \tabularnewline
39 & -0.0097 & -0.0758 & 0.46993 \tabularnewline
40 & -0.027518 & -0.2149 & 0.415274 \tabularnewline
41 & -0.030761 & -0.2402 & 0.405471 \tabularnewline
42 & -0.02171 & -0.1696 & 0.432958 \tabularnewline
43 & 0.092994 & 0.7263 & 0.235215 \tabularnewline
44 & -0.020855 & -0.1629 & 0.435575 \tabularnewline
45 & -0.01745 & -0.1363 & 0.446022 \tabularnewline
46 & -0.002312 & -0.0181 & 0.492825 \tabularnewline
47 & -0.024432 & -0.1908 & 0.424651 \tabularnewline
48 & -0.032747 & -0.2558 & 0.399496 \tabularnewline
\hline
\end{tabular}
%Source: https://freestatistics.org/blog/index.php?pk=&T=1

[TABLE]
[ROW][C]Autocorrelation Function[/C][/ROW]
[ROW][C]Time lag k[/C][C]ACF(k)[/C][C]T-STAT[/C][C]P-value[/C][/ROW]
[ROW][C]1[/C][C]0.032915[/C][C]0.2571[/C][C]0.398992[/C][/ROW]
[ROW][C]2[/C][C]-0.04125[/C][C]-0.3222[/C][C]0.374212[/C][/ROW]
[ROW][C]3[/C][C]-0.039209[/C][C]-0.3062[/C][C]0.380237[/C][/ROW]
[ROW][C]4[/C][C]0.066934[/C][C]0.5228[/C][C]0.301514[/C][/ROW]
[ROW][C]5[/C][C]-0.011736[/C][C]-0.0917[/C][C]0.463633[/C][/ROW]
[ROW][C]6[/C][C]0.004073[/C][C]0.0318[/C][C]0.487364[/C][/ROW]
[ROW][C]7[/C][C]-0.004735[/C][C]-0.037[/C][C]0.485309[/C][/ROW]
[ROW][C]8[/C][C]-0.023799[/C][C]-0.1859[/C][C]0.426579[/C][/ROW]
[ROW][C]9[/C][C]-0.022457[/C][C]-0.1754[/C][C]0.430676[/C][/ROW]
[ROW][C]10[/C][C]0.001688[/C][C]0.0132[/C][C]0.494761[/C][/ROW]
[ROW][C]11[/C][C]0.009102[/C][C]0.0711[/C][C]0.471779[/C][/ROW]
[ROW][C]12[/C][C]-0.005787[/C][C]-0.0452[/C][C]0.482048[/C][/ROW]
[ROW][C]13[/C][C]-0.020787[/C][C]-0.1623[/C][C]0.435784[/C][/ROW]
[ROW][C]14[/C][C]-0.017402[/C][C]-0.1359[/C][C]0.446167[/C][/ROW]
[ROW][C]15[/C][C]-0.002852[/C][C]-0.0223[/C][C]0.491149[/C][/ROW]
[ROW][C]16[/C][C]0.067486[/C][C]0.5271[/C][C]0.300025[/C][/ROW]
[ROW][C]17[/C][C]-0.025731[/C][C]-0.201[/C][C]0.420698[/C][/ROW]
[ROW][C]18[/C][C]-0.019247[/C][C]-0.1503[/C][C]0.440502[/C][/ROW]
[ROW][C]19[/C][C]-0.023536[/C][C]-0.1838[/C][C]0.427382[/C][/ROW]
[ROW][C]20[/C][C]0.152629[/C][C]1.1921[/C][C]0.118925[/C][/ROW]
[ROW][C]21[/C][C]-0.003812[/C][C]-0.0298[/C][C]0.488173[/C][/ROW]
[ROW][C]22[/C][C]-0.020368[/C][C]-0.1591[/C][C]0.437067[/C][/ROW]
[ROW][C]23[/C][C]-0.005554[/C][C]-0.0434[/C][C]0.482772[/C][/ROW]
[ROW][C]24[/C][C]-0.008157[/C][C]-0.0637[/C][C]0.474705[/C][/ROW]
[ROW][C]25[/C][C]-0.018763[/C][C]-0.1465[/C][C]0.441989[/C][/ROW]
[ROW][C]26[/C][C]-0.02312[/C][C]-0.1806[/C][C]0.42865[/C][/ROW]
[ROW][C]27[/C][C]-0.015032[/C][C]-0.1174[/C][C]0.453463[/C][/ROW]
[ROW][C]28[/C][C]-0.024772[/C][C]-0.1935[/C][C]0.423614[/C][/ROW]
[ROW][C]29[/C][C]-0.014702[/C][C]-0.1148[/C][C]0.454479[/C][/ROW]
[ROW][C]30[/C][C]-0.020647[/C][C]-0.1613[/C][C]0.436211[/C][/ROW]
[ROW][C]31[/C][C]-0.033476[/C][C]-0.2615[/C][C]0.397311[/C][/ROW]
[ROW][C]32[/C][C]-0.027917[/C][C]-0.218[/C][C]0.414065[/C][/ROW]
[ROW][C]33[/C][C]-0.024535[/C][C]-0.1916[/C][C]0.424336[/C][/ROW]
[ROW][C]34[/C][C]-0.030435[/C][C]-0.2377[/C][C]0.406452[/C][/ROW]
[ROW][C]35[/C][C]-0.034252[/C][C]-0.2675[/C][C]0.394987[/C][/ROW]
[ROW][C]36[/C][C]0.033345[/C][C]0.2604[/C][C]0.397704[/C][/ROW]
[ROW][C]37[/C][C]-0.014586[/C][C]-0.1139[/C][C]0.454838[/C][/ROW]
[ROW][C]38[/C][C]0.00539[/C][C]0.0421[/C][C]0.48328[/C][/ROW]
[ROW][C]39[/C][C]-0.0097[/C][C]-0.0758[/C][C]0.46993[/C][/ROW]
[ROW][C]40[/C][C]-0.027518[/C][C]-0.2149[/C][C]0.415274[/C][/ROW]
[ROW][C]41[/C][C]-0.030761[/C][C]-0.2402[/C][C]0.405471[/C][/ROW]
[ROW][C]42[/C][C]-0.02171[/C][C]-0.1696[/C][C]0.432958[/C][/ROW]
[ROW][C]43[/C][C]0.092994[/C][C]0.7263[/C][C]0.235215[/C][/ROW]
[ROW][C]44[/C][C]-0.020855[/C][C]-0.1629[/C][C]0.435575[/C][/ROW]
[ROW][C]45[/C][C]-0.01745[/C][C]-0.1363[/C][C]0.446022[/C][/ROW]
[ROW][C]46[/C][C]-0.002312[/C][C]-0.0181[/C][C]0.492825[/C][/ROW]
[ROW][C]47[/C][C]-0.024432[/C][C]-0.1908[/C][C]0.424651[/C][/ROW]
[ROW][C]48[/C][C]-0.032747[/C][C]-0.2558[/C][C]0.399496[/C][/ROW]
[/TABLE]
Source: https://freestatistics.org/blog/index.php?pk=&T=1

Globally Unique Identifier (entire table): ba.freestatistics.org/blog/index.php?pk=&T=1

As an alternative you can also use a QR Code:  

The GUIDs for individual cells are displayed in the table below:

Autocorrelation Function
Time lag kACF(k)T-STATP-value
10.0329150.25710.398992
2-0.04125-0.32220.374212
3-0.039209-0.30620.380237
40.0669340.52280.301514
5-0.011736-0.09170.463633
60.0040730.03180.487364
7-0.004735-0.0370.485309
8-0.023799-0.18590.426579
9-0.022457-0.17540.430676
100.0016880.01320.494761
110.0091020.07110.471779
12-0.005787-0.04520.482048
13-0.020787-0.16230.435784
14-0.017402-0.13590.446167
15-0.002852-0.02230.491149
160.0674860.52710.300025
17-0.025731-0.2010.420698
18-0.019247-0.15030.440502
19-0.023536-0.18380.427382
200.1526291.19210.118925
21-0.003812-0.02980.488173
22-0.020368-0.15910.437067
23-0.005554-0.04340.482772
24-0.008157-0.06370.474705
25-0.018763-0.14650.441989
26-0.02312-0.18060.42865
27-0.015032-0.11740.453463
28-0.024772-0.19350.423614
29-0.014702-0.11480.454479
30-0.020647-0.16130.436211
31-0.033476-0.26150.397311
32-0.027917-0.2180.414065
33-0.024535-0.19160.424336
34-0.030435-0.23770.406452
35-0.034252-0.26750.394987
360.0333450.26040.397704
37-0.014586-0.11390.454838
380.005390.04210.48328
39-0.0097-0.07580.46993
40-0.027518-0.21490.415274
41-0.030761-0.24020.405471
42-0.02171-0.16960.432958
430.0929940.72630.235215
44-0.020855-0.16290.435575
45-0.01745-0.13630.446022
46-0.002312-0.01810.492825
47-0.024432-0.19080.424651
48-0.032747-0.25580.399496


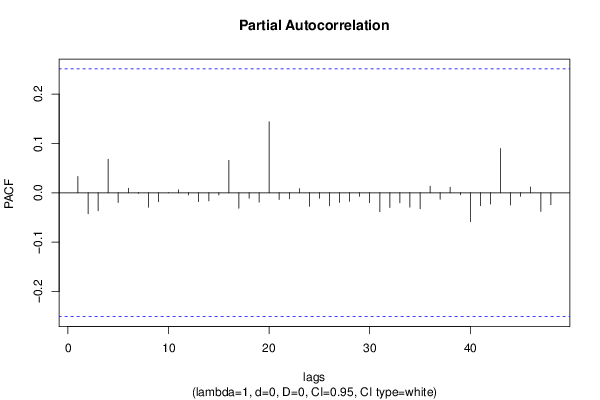
Partial Autocorrelation Function
Time lag kPACF(k)T-STATP-value
10.0329150.25710.398992
2-0.042379-0.3310.370892
3-0.036503-0.28510.388266
40.0680090.53120.298615
5-0.019607-0.15310.439397
60.0091340.07130.471682
7-0.001159-0.00910.496404
8-0.029178-0.22790.410247
9-0.018274-0.14270.443489
10-0.000242-0.00190.499249
110.0059690.04660.481483
12-0.004467-0.03490.486143
13-0.017924-0.140.444564
14-0.016451-0.12850.449093
15-0.004533-0.03540.485935
160.0657770.51370.304645
17-0.031265-0.24420.403953
18-0.011122-0.08690.465533
19-0.01899-0.14830.441292
200.1439681.12440.132618
21-0.013645-0.10660.457741
22-0.012031-0.0940.462721
230.0085020.06640.473639
24-0.027404-0.2140.415617
25-0.011213-0.08760.465249
26-0.026384-0.20610.418713
27-0.019584-0.1530.43947
28-0.017372-0.13570.44626
29-0.007312-0.05710.477324
30-0.020322-0.15870.437208
31-0.038463-0.30040.382445
32-0.029951-0.23390.407914
33-0.020335-0.15880.437166
34-0.029056-0.22690.410616
35-0.032171-0.25130.401227
360.0134770.10530.458258
37-0.013013-0.10160.459689
380.0113960.0890.464683
39-0.004099-0.0320.487283
40-0.05845-0.45650.324823
41-0.026346-0.20580.418829
42-0.022799-0.17810.429629
430.0898540.70180.242743
44-0.024884-0.19430.423275
45-0.007264-0.05670.477472
460.0117680.09190.463535
47-0.037655-0.29410.384841
48-0.024027-0.18770.425885

\begin{tabular}{lllllllll}
\hline
Partial Autocorrelation Function \tabularnewline
Time lag k & PACF(k) & T-STAT & P-value \tabularnewline
1 & 0.032915 & 0.2571 & 0.398992 \tabularnewline
2 & -0.042379 & -0.331 & 0.370892 \tabularnewline
3 & -0.036503 & -0.2851 & 0.388266 \tabularnewline
4 & 0.068009 & 0.5312 & 0.298615 \tabularnewline
5 & -0.019607 & -0.1531 & 0.439397 \tabularnewline
6 & 0.009134 & 0.0713 & 0.471682 \tabularnewline
7 & -0.001159 & -0.0091 & 0.496404 \tabularnewline
8 & -0.029178 & -0.2279 & 0.410247 \tabularnewline
9 & -0.018274 & -0.1427 & 0.443489 \tabularnewline
10 & -0.000242 & -0.0019 & 0.499249 \tabularnewline
11 & 0.005969 & 0.0466 & 0.481483 \tabularnewline
12 & -0.004467 & -0.0349 & 0.486143 \tabularnewline
13 & -0.017924 & -0.14 & 0.444564 \tabularnewline
14 & -0.016451 & -0.1285 & 0.449093 \tabularnewline
15 & -0.004533 & -0.0354 & 0.485935 \tabularnewline
16 & 0.065777 & 0.5137 & 0.304645 \tabularnewline
17 & -0.031265 & -0.2442 & 0.403953 \tabularnewline
18 & -0.011122 & -0.0869 & 0.465533 \tabularnewline
19 & -0.01899 & -0.1483 & 0.441292 \tabularnewline
20 & 0.143968 & 1.1244 & 0.132618 \tabularnewline
21 & -0.013645 & -0.1066 & 0.457741 \tabularnewline
22 & -0.012031 & -0.094 & 0.462721 \tabularnewline
23 & 0.008502 & 0.0664 & 0.473639 \tabularnewline
24 & -0.027404 & -0.214 & 0.415617 \tabularnewline
25 & -0.011213 & -0.0876 & 0.465249 \tabularnewline
26 & -0.026384 & -0.2061 & 0.418713 \tabularnewline
27 & -0.019584 & -0.153 & 0.43947 \tabularnewline
28 & -0.017372 & -0.1357 & 0.44626 \tabularnewline
29 & -0.007312 & -0.0571 & 0.477324 \tabularnewline
30 & -0.020322 & -0.1587 & 0.437208 \tabularnewline
31 & -0.038463 & -0.3004 & 0.382445 \tabularnewline
32 & -0.029951 & -0.2339 & 0.407914 \tabularnewline
33 & -0.020335 & -0.1588 & 0.437166 \tabularnewline
34 & -0.029056 & -0.2269 & 0.410616 \tabularnewline
35 & -0.032171 & -0.2513 & 0.401227 \tabularnewline
36 & 0.013477 & 0.1053 & 0.458258 \tabularnewline
37 & -0.013013 & -0.1016 & 0.459689 \tabularnewline
38 & 0.011396 & 0.089 & 0.464683 \tabularnewline
39 & -0.004099 & -0.032 & 0.487283 \tabularnewline
40 & -0.05845 & -0.4565 & 0.324823 \tabularnewline
41 & -0.026346 & -0.2058 & 0.418829 \tabularnewline
42 & -0.022799 & -0.1781 & 0.429629 \tabularnewline
43 & 0.089854 & 0.7018 & 0.242743 \tabularnewline
44 & -0.024884 & -0.1943 & 0.423275 \tabularnewline
45 & -0.007264 & -0.0567 & 0.477472 \tabularnewline
46 & 0.011768 & 0.0919 & 0.463535 \tabularnewline
47 & -0.037655 & -0.2941 & 0.384841 \tabularnewline
48 & -0.024027 & -0.1877 & 0.425885 \tabularnewline
\hline
\end{tabular}
%Source: https://freestatistics.org/blog/index.php?pk=&T=2

[TABLE]
[ROW][C]Partial Autocorrelation Function[/C][/ROW]
[ROW][C]Time lag k[/C][C]PACF(k)[/C][C]T-STAT[/C][C]P-value[/C][/ROW]
[ROW][C]1[/C][C]0.032915[/C][C]0.2571[/C][C]0.398992[/C][/ROW]
[ROW][C]2[/C][C]-0.042379[/C][C]-0.331[/C][C]0.370892[/C][/ROW]
[ROW][C]3[/C][C]-0.036503[/C][C]-0.2851[/C][C]0.388266[/C][/ROW]
[ROW][C]4[/C][C]0.068009[/C][C]0.5312[/C][C]0.298615[/C][/ROW]
[ROW][C]5[/C][C]-0.019607[/C][C]-0.1531[/C][C]0.439397[/C][/ROW]
[ROW][C]6[/C][C]0.009134[/C][C]0.0713[/C][C]0.471682[/C][/ROW]
[ROW][C]7[/C][C]-0.001159[/C][C]-0.0091[/C][C]0.496404[/C][/ROW]
[ROW][C]8[/C][C]-0.029178[/C][C]-0.2279[/C][C]0.410247[/C][/ROW]
[ROW][C]9[/C][C]-0.018274[/C][C]-0.1427[/C][C]0.443489[/C][/ROW]
[ROW][C]10[/C][C]-0.000242[/C][C]-0.0019[/C][C]0.499249[/C][/ROW]
[ROW][C]11[/C][C]0.005969[/C][C]0.0466[/C][C]0.481483[/C][/ROW]
[ROW][C]12[/C][C]-0.004467[/C][C]-0.0349[/C][C]0.486143[/C][/ROW]
[ROW][C]13[/C][C]-0.017924[/C][C]-0.14[/C][C]0.444564[/C][/ROW]
[ROW][C]14[/C][C]-0.016451[/C][C]-0.1285[/C][C]0.449093[/C][/ROW]
[ROW][C]15[/C][C]-0.004533[/C][C]-0.0354[/C][C]0.485935[/C][/ROW]
[ROW][C]16[/C][C]0.065777[/C][C]0.5137[/C][C]0.304645[/C][/ROW]
[ROW][C]17[/C][C]-0.031265[/C][C]-0.2442[/C][C]0.403953[/C][/ROW]
[ROW][C]18[/C][C]-0.011122[/C][C]-0.0869[/C][C]0.465533[/C][/ROW]
[ROW][C]19[/C][C]-0.01899[/C][C]-0.1483[/C][C]0.441292[/C][/ROW]
[ROW][C]20[/C][C]0.143968[/C][C]1.1244[/C][C]0.132618[/C][/ROW]
[ROW][C]21[/C][C]-0.013645[/C][C]-0.1066[/C][C]0.457741[/C][/ROW]
[ROW][C]22[/C][C]-0.012031[/C][C]-0.094[/C][C]0.462721[/C][/ROW]
[ROW][C]23[/C][C]0.008502[/C][C]0.0664[/C][C]0.473639[/C][/ROW]
[ROW][C]24[/C][C]-0.027404[/C][C]-0.214[/C][C]0.415617[/C][/ROW]
[ROW][C]25[/C][C]-0.011213[/C][C]-0.0876[/C][C]0.465249[/C][/ROW]
[ROW][C]26[/C][C]-0.026384[/C][C]-0.2061[/C][C]0.418713[/C][/ROW]
[ROW][C]27[/C][C]-0.019584[/C][C]-0.153[/C][C]0.43947[/C][/ROW]
[ROW][C]28[/C][C]-0.017372[/C][C]-0.1357[/C][C]0.44626[/C][/ROW]
[ROW][C]29[/C][C]-0.007312[/C][C]-0.0571[/C][C]0.477324[/C][/ROW]
[ROW][C]30[/C][C]-0.020322[/C][C]-0.1587[/C][C]0.437208[/C][/ROW]
[ROW][C]31[/C][C]-0.038463[/C][C]-0.3004[/C][C]0.382445[/C][/ROW]
[ROW][C]32[/C][C]-0.029951[/C][C]-0.2339[/C][C]0.407914[/C][/ROW]
[ROW][C]33[/C][C]-0.020335[/C][C]-0.1588[/C][C]0.437166[/C][/ROW]
[ROW][C]34[/C][C]-0.029056[/C][C]-0.2269[/C][C]0.410616[/C][/ROW]
[ROW][C]35[/C][C]-0.032171[/C][C]-0.2513[/C][C]0.401227[/C][/ROW]
[ROW][C]36[/C][C]0.013477[/C][C]0.1053[/C][C]0.458258[/C][/ROW]
[ROW][C]37[/C][C]-0.013013[/C][C]-0.1016[/C][C]0.459689[/C][/ROW]
[ROW][C]38[/C][C]0.011396[/C][C]0.089[/C][C]0.464683[/C][/ROW]
[ROW][C]39[/C][C]-0.004099[/C][C]-0.032[/C][C]0.487283[/C][/ROW]
[ROW][C]40[/C][C]-0.05845[/C][C]-0.4565[/C][C]0.324823[/C][/ROW]
[ROW][C]41[/C][C]-0.026346[/C][C]-0.2058[/C][C]0.418829[/C][/ROW]
[ROW][C]42[/C][C]-0.022799[/C][C]-0.1781[/C][C]0.429629[/C][/ROW]
[ROW][C]43[/C][C]0.089854[/C][C]0.7018[/C][C]0.242743[/C][/ROW]
[ROW][C]44[/C][C]-0.024884[/C][C]-0.1943[/C][C]0.423275[/C][/ROW]
[ROW][C]45[/C][C]-0.007264[/C][C]-0.0567[/C][C]0.477472[/C][/ROW]
[ROW][C]46[/C][C]0.011768[/C][C]0.0919[/C][C]0.463535[/C][/ROW]
[ROW][C]47[/C][C]-0.037655[/C][C]-0.2941[/C][C]0.384841[/C][/ROW]
[ROW][C]48[/C][C]-0.024027[/C][C]-0.1877[/C][C]0.425885[/C][/ROW]
[/TABLE]
Source: https://freestatistics.org/blog/index.php?pk=&T=2

Globally Unique Identifier (entire table): ba.freestatistics.org/blog/index.php?pk=&T=2

As an alternative you can also use a QR Code:  

The GUIDs for individual cells are displayed in the table below:

Partial Autocorrelation Function
Time lag kPACF(k)T-STATP-value
10.0329150.25710.398992
2-0.042379-0.3310.370892
3-0.036503-0.28510.388266
40.0680090.53120.298615
5-0.019607-0.15310.439397
60.0091340.07130.471682
7-0.001159-0.00910.496404
8-0.029178-0.22790.410247
9-0.018274-0.14270.443489
10-0.000242-0.00190.499249
110.0059690.04660.481483
12-0.004467-0.03490.486143
13-0.017924-0.140.444564
14-0.016451-0.12850.449093
15-0.004533-0.03540.485935
160.0657770.51370.304645
17-0.031265-0.24420.403953
18-0.011122-0.08690.465533
19-0.01899-0.14830.441292
200.1439681.12440.132618
21-0.013645-0.10660.457741
22-0.012031-0.0940.462721
230.0085020.06640.473639
24-0.027404-0.2140.415617
25-0.011213-0.08760.465249
26-0.026384-0.20610.418713
27-0.019584-0.1530.43947
28-0.017372-0.13570.44626
29-0.007312-0.05710.477324
30-0.020322-0.15870.437208
31-0.038463-0.30040.382445
32-0.029951-0.23390.407914
33-0.020335-0.15880.437166
34-0.029056-0.22690.410616
35-0.032171-0.25130.401227
360.0134770.10530.458258
37-0.013013-0.10160.459689
380.0113960.0890.464683
39-0.004099-0.0320.487283
40-0.05845-0.45650.324823
41-0.026346-0.20580.418829
42-0.022799-0.17810.429629
430.0898540.70180.242743
44-0.024884-0.19430.423275
45-0.007264-0.05670.477472
460.0117680.09190.463535
47-0.037655-0.29410.384841
48-0.024027-0.18770.425885


Parameters (Session):
par1 = 48 ; par2 = 1 ; par3 = 0 ; par4 = 0 ; par5 = 12 ; par6 = White Noise ; par7 = 0.95 ;
Parameters (R input):
par1 = 48 ; par2 = 1 ; par3 = 0 ; par4 = 0 ; par5 = 12 ; par6 = White Noise ; par7 = 0.95 ; par8 = ;
R code (references can be found in the software module):
if (par1 == 'Default') {
par1 = 10*log10(length(x))
} else {
par1 <- as.numeric(par1)
}
par2 <- as.numeric(par2)
par3 <- as.numeric(par3)
par4 <- as.numeric(par4)
par5 <- as.numeric(par5)
if (par6 == 'White Noise') par6 <- 'white' else par6 <- 'ma'
par7 <- as.numeric(par7)
if (par8 != '') par8 <- as.numeric(par8)
x <- na.omit(x)
ox <- x
if (par8 == '') {
if (par2 == 0) {
x <- log(x)
} else {
x <- (x ^ par2 - 1) / par2
}
} else {
x <- log(x,base=par8)
}
if (par3 > 0) x <- diff(x,lag=1,difference=par3)
if (par4 > 0) x <- diff(x,lag=par5,difference=par4)
bitmap(file='picts.png')
op <- par(mfrow=c(2,1))
plot(ox,type='l',main='Original Time Series',xlab='time',ylab='value')
if (par8=='') {
mytitle <- paste('Working Time Series (lambda=',par2,', d=',par3,', D=',par4,')',sep='')
mysub <- paste('(lambda=',par2,', d=',par3,', D=',par4,', CI=', par7, ', CI type=',par6,')',sep='')
} else {
mytitle <- paste('Working Time Series (base=',par8,', d=',par3,', D=',par4,')',sep='')
mysub <- paste('(base=',par8,', d=',par3,', D=',par4,', CI=', par7, ', CI type=',par6,')',sep='')
}
plot(x,type='l', main=mytitle,xlab='time',ylab='value')
par(op)
dev.off()
bitmap(file='pic1.png')
racf <- acf(x, par1, main='Autocorrelation', xlab='time lag', ylab='ACF', ci.type=par6, ci=par7, sub=mysub)
dev.off()
bitmap(file='pic2.png')
rpacf <- pacf(x,par1,main='Partial Autocorrelation',xlab='lags',ylab='PACF',sub=mysub)
dev.off()
(myacf <- c(racf$acf))
(mypacf <- c(rpacf$acf))
lengthx <- length(x)
sqrtn <- sqrt(lengthx)
load(file='createtable')
a<-table.start()
a<-table.row.start(a)
a<-table.element(a,'Autocorrelation Function',4,TRUE)
a<-table.row.end(a)
a<-table.row.start(a)
a<-table.element(a,'Time lag k',header=TRUE)
a<-table.element(a,hyperlink('basics.htm','ACF(k)','click here for more information about the Autocorrelation Function'),header=TRUE)
a<-table.element(a,'T-STAT',header=TRUE)
a<-table.element(a,'P-value',header=TRUE)
a<-table.row.end(a)
for (i in 2:(par1+1)) {
a<-table.row.start(a)
a<-table.element(a,i-1,header=TRUE)
a<-table.element(a,round(myacf[i],6))
mytstat <- myacf[i]*sqrtn
a<-table.element(a,round(mytstat,4))
a<-table.element(a,round(1-pt(abs(mytstat),lengthx),6))
a<-table.row.end(a)
}
a<-table.end(a)
table.save(a,file='mytable.tab')
a<-table.start()
a<-table.row.start(a)
a<-table.element(a,'Partial Autocorrelation Function',4,TRUE)
a<-table.row.end(a)
a<-table.row.start(a)
a<-table.element(a,'Time lag k',header=TRUE)
a<-table.element(a,hyperlink('basics.htm','PACF(k)','click here for more information about the Partial Autocorrelation Function'),header=TRUE)
a<-table.element(a,'T-STAT',header=TRUE)
a<-table.element(a,'P-value',header=TRUE)
a<-table.row.end(a)
for (i in 1:par1) {
a<-table.row.start(a)
a<-table.element(a,i,header=TRUE)
a<-table.element(a,round(mypacf[i],6))
mytstat <- mypacf[i]*sqrtn
a<-table.element(a,round(mytstat,4))
a<-table.element(a,round(1-pt(abs(mytstat),lengthx),6))
a<-table.row.end(a)
}
a<-table.end(a)
table.save(a,file='mytable1.tab')