Free Statistics

of Irreproducible Research!

Author's title

Author*Unverified author*
R Software Modulerwasp_percentiles.wasp
Title produced by softwarePercentiles
Date of computationTue, 04 Oct 2016 23:57:38 +0100
Cite this page as followsStatistical Computations at FreeStatistics.org, Office for Research Development and Education, URL https://freestatistics.org/blog/index.php?v=date/2016/Oct/04/t1475621909t3kdqy92xha02eq.htm/, Retrieved Fri, 17 May 2024 17:44:23 +0200
Statistical Computations at FreeStatistics.org, Office for Research Development and Education, URL https://freestatistics.org/blog/index.php?pk=, Retrieved Fri, 17 May 2024 17:44:23 +0200
QR Codes:

Original text written by user:
IsPrivate?No (this computation is public)
User-defined keywords
Estimated Impact0
Dataseries X:
125
253
354
405
426
445
506
523
563
713
735
806
838
930
931


Summary of computational transaction
Raw Inputview raw input (R code)
Raw Outputview raw output of R engine
Computing time0 seconds
R Server'Gwilym Jenkins' @ jenkins.wessa.net

\begin{tabular}{lllllllll}
\hline
Summary of computational transaction \tabularnewline
Raw Input & view raw input (R code)  \tabularnewline
Raw Output & view raw output of R engine  \tabularnewline
Computing time & 0 seconds \tabularnewline
R Server & 'Gwilym Jenkins' @ jenkins.wessa.net \tabularnewline
\hline
\end{tabular}
%Source: https://freestatistics.org/blog/index.php?pk=&T=0

[TABLE]
[ROW][C]Summary of computational transaction[/C][/ROW]
[ROW][C]Raw Input[/C][C]view raw input (R code) [/C][/ROW]
[ROW][C]Raw Output[/C][C]view raw output of R engine [/C][/ROW]
[ROW][C]Computing time[/C][C]0 seconds[/C][/ROW]
[ROW][C]R Server[/C][C]'Gwilym Jenkins' @ jenkins.wessa.net[/C][/ROW]
[/TABLE]
Source: https://freestatistics.org/blog/index.php?pk=&T=0

Globally Unique Identifier (entire table): ba.freestatistics.org/blog/index.php?pk=&T=0

As an alternative you can also use a QR Code:  

The GUIDs for individual cells are displayed in the table below:

Summary of computational transaction
Raw Inputview raw input (R code)
Raw Outputview raw output of R engine
Computing time0 seconds
R Server'Gwilym Jenkins' @ jenkins.wessa.net


Percentiles - Ungrouped Data
pWeighted Average at XnpWeighted Average at X(n+1)pEmpirical Distribution FunctionEmpirical Distribution Function - AveragingEmpirical Distribution Function - InterpolationClosest ObservationTrue Basic - Statistics Graphics ToolkitMS Excel (old versions)
0.1189201.8253253293.4253176.2253
0.2354364.2354379.5394.8354394.8354
0.3415.5421.8426426429.8426409.2426
0.4445469.4445475.5481.6445481.6445
0.5514.5523523523523523523523
0.6563653563638623563623713
0.7724749.2735735730.6735791.8735
0.8806831.6806822812.4806812.4838
0.9884930.4930930893.2930930.6930

\begin{tabular}{lllllllll}
\hline
Percentiles - Ungrouped Data \tabularnewline
p & Weighted Average at Xnp & Weighted Average at X(n+1)p & Empirical Distribution Function & Empirical Distribution Function - Averaging & Empirical Distribution Function - Interpolation & Closest Observation & True Basic - Statistics Graphics Toolkit & MS Excel (old versions) \tabularnewline
0.1 & 189 & 201.8 & 253 & 253 & 293.4 & 253 & 176.2 & 253 \tabularnewline
0.2 & 354 & 364.2 & 354 & 379.5 & 394.8 & 354 & 394.8 & 354 \tabularnewline
0.3 & 415.5 & 421.8 & 426 & 426 & 429.8 & 426 & 409.2 & 426 \tabularnewline
0.4 & 445 & 469.4 & 445 & 475.5 & 481.6 & 445 & 481.6 & 445 \tabularnewline
0.5 & 514.5 & 523 & 523 & 523 & 523 & 523 & 523 & 523 \tabularnewline
0.6 & 563 & 653 & 563 & 638 & 623 & 563 & 623 & 713 \tabularnewline
0.7 & 724 & 749.2 & 735 & 735 & 730.6 & 735 & 791.8 & 735 \tabularnewline
0.8 & 806 & 831.6 & 806 & 822 & 812.4 & 806 & 812.4 & 838 \tabularnewline
0.9 & 884 & 930.4 & 930 & 930 & 893.2 & 930 & 930.6 & 930 \tabularnewline
\hline
\end{tabular}
%Source: https://freestatistics.org/blog/index.php?pk=&T=1

[TABLE]
[ROW][C]Percentiles - Ungrouped Data[/C][/ROW]
[ROW][C]p[/C][C]Weighted Average at Xnp[/C][C]Weighted Average at X(n+1)p[/C][C]Empirical Distribution Function[/C][C]Empirical Distribution Function - Averaging[/C][C]Empirical Distribution Function - Interpolation[/C][C]Closest Observation[/C][C]True Basic - Statistics Graphics Toolkit[/C][C]MS Excel (old versions)[/C][/ROW]
[ROW][C]0.1[/C][C]189[/C][C]201.8[/C][C]253[/C][C]253[/C][C]293.4[/C][C]253[/C][C]176.2[/C][C]253[/C][/ROW]
[ROW][C]0.2[/C][C]354[/C][C]364.2[/C][C]354[/C][C]379.5[/C][C]394.8[/C][C]354[/C][C]394.8[/C][C]354[/C][/ROW]
[ROW][C]0.3[/C][C]415.5[/C][C]421.8[/C][C]426[/C][C]426[/C][C]429.8[/C][C]426[/C][C]409.2[/C][C]426[/C][/ROW]
[ROW][C]0.4[/C][C]445[/C][C]469.4[/C][C]445[/C][C]475.5[/C][C]481.6[/C][C]445[/C][C]481.6[/C][C]445[/C][/ROW]
[ROW][C]0.5[/C][C]514.5[/C][C]523[/C][C]523[/C][C]523[/C][C]523[/C][C]523[/C][C]523[/C][C]523[/C][/ROW]
[ROW][C]0.6[/C][C]563[/C][C]653[/C][C]563[/C][C]638[/C][C]623[/C][C]563[/C][C]623[/C][C]713[/C][/ROW]
[ROW][C]0.7[/C][C]724[/C][C]749.2[/C][C]735[/C][C]735[/C][C]730.6[/C][C]735[/C][C]791.8[/C][C]735[/C][/ROW]
[ROW][C]0.8[/C][C]806[/C][C]831.6[/C][C]806[/C][C]822[/C][C]812.4[/C][C]806[/C][C]812.4[/C][C]838[/C][/ROW]
[ROW][C]0.9[/C][C]884[/C][C]930.4[/C][C]930[/C][C]930[/C][C]893.2[/C][C]930[/C][C]930.6[/C][C]930[/C][/ROW]
[/TABLE]
Source: https://freestatistics.org/blog/index.php?pk=&T=1

Globally Unique Identifier (entire table): ba.freestatistics.org/blog/index.php?pk=&T=1

As an alternative you can also use a QR Code:  

The GUIDs for individual cells are displayed in the table below:

Percentiles - Ungrouped Data
pWeighted Average at XnpWeighted Average at X(n+1)pEmpirical Distribution FunctionEmpirical Distribution Function - AveragingEmpirical Distribution Function - InterpolationClosest ObservationTrue Basic - Statistics Graphics ToolkitMS Excel (old versions)
0.1189201.8253253293.4253176.2253
0.2354364.2354379.5394.8354394.8354
0.3415.5421.8426426429.8426409.2426
0.4445469.4445475.5481.6445481.6445
0.5514.5523523523523523523523
0.6563653563638623563623713
0.7724749.2735735730.6735791.8735
0.8806831.6806822812.4806812.4838
0.9884930.4930930893.2930930.6930


Parameters (Session):
Parameters (R input):
R code (references can be found in the software module):
x <-sort(x[!is.na(x)])
q1 <- function(data,n,p,i,f) {
np <- n*p;
i <<- floor(np)
f <<- np - i
qvalue <- (1-f)*data[i] + f*data[i+1]
}
q2 <- function(data,n,p,i,f) {
np <- (n+1)*p
i <<- floor(np)
f <<- np - i
qvalue <- (1-f)*data[i] + f*data[i+1]
}
q3 <- function(data,n,p,i,f) {
np <- n*p
i <<- floor(np)
f <<- np - i
if (f==0) {
qvalue <- data[i]
} else {
qvalue <- data[i+1]
}
}
q4 <- function(data,n,p,i,f) {
np <- n*p
i <<- floor(np)
f <<- np - i
if (f==0) {
qvalue <- (data[i]+data[i+1])/2
} else {
qvalue <- data[i+1]
}
}
q5 <- function(data,n,p,i,f) {
np <- (n-1)*p
i <<- floor(np)
f <<- np - i
if (f==0) {
qvalue <- data[i+1]
} else {
qvalue <- data[i+1] + f*(data[i+2]-data[i+1])
}
}
q6 <- function(data,n,p,i,f) {
np <- n*p+0.5
i <<- floor(np)
f <<- np - i
qvalue <- data[i]
}
q7 <- function(data,n,p,i,f) {
np <- (n+1)*p
i <<- floor(np)
f <<- np - i
if (f==0) {
qvalue <- data[i]
} else {
qvalue <- f*data[i] + (1-f)*data[i+1]
}
}
q8 <- function(data,n,p,i,f) {
np <- (n+1)*p
i <<- floor(np)
f <<- np - i
if (f==0) {
qvalue <- data[i]
} else {
if (f == 0.5) {
qvalue <- (data[i]+data[i+1])/2
} else {
if (f < 0.5) {
qvalue <- data[i]
} else {
qvalue <- data[i+1]
}
}
}
}
lx <- length(x)
qval <- array(NA,dim=c(99,8))
mystep <- 25
mystart <- 25
if (lx>10){
mystep=10
mystart=10
}
if (lx>20){
mystep=5
mystart=5
}
if (lx>50){
mystep=2
mystart=2
}
if (lx>=100){
mystep=1
mystart=1
}
for (perc in seq(mystart,99,mystep)) {
qval[perc,1] <- q1(x,lx,perc/100,i,f)
qval[perc,2] <- q2(x,lx,perc/100,i,f)
qval[perc,3] <- q3(x,lx,perc/100,i,f)
qval[perc,4] <- q4(x,lx,perc/100,i,f)
qval[perc,5] <- q5(x,lx,perc/100,i,f)
qval[perc,6] <- q6(x,lx,perc/100,i,f)
qval[perc,7] <- q7(x,lx,perc/100,i,f)
qval[perc,8] <- q8(x,lx,perc/100,i,f)
}
bitmap(file='test1.png')
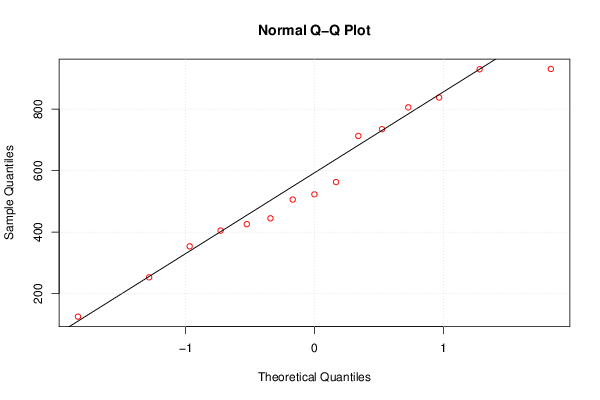
myqqnorm <- qqnorm(x,col=2)
qqline(x)
grid()
dev.off()
load(file='createtable')
a<-table.start()
a<-table.row.start(a)
a<-table.element(a,'Percentiles - Ungrouped Data',9,TRUE)
a<-table.row.end(a)
a<-table.row.start(a)
a<-table.element(a,'p',1,TRUE)
a<-table.element(a,hyperlink('method_1.htm', 'Weighted Average at Xnp',''),1,TRUE)
a<-table.element(a,hyperlink('method_2.htm','Weighted Average at X(n+1)p',''),1,TRUE)
a<-table.element(a,hyperlink('method_3.htm','Empirical Distribution Function',''),1,TRUE)
a<-table.element(a,hyperlink('method_4.htm','Empirical Distribution Function - Averaging',''),1,TRUE)
a<-table.element(a,hyperlink('method_5.htm','Empirical Distribution Function - Interpolation',''),1,TRUE)
a<-table.element(a,hyperlink('method_6.htm','Closest Observation',''),1,TRUE)
a<-table.element(a,hyperlink('method_7.htm','True Basic - Statistics Graphics Toolkit',''),1,TRUE)
a<-table.element(a,hyperlink('method_8.htm','MS Excel (old versions)',''),1,TRUE)
a<-table.row.end(a)
for (perc in seq(mystart,99,mystep)) {
a<-table.row.start(a)
a<-table.element(a,round(perc/100,2),1,TRUE)
for (j in 1:8) {
a<-table.element(a,round(qval[perc,j],6))
}
a<-table.row.end(a)
}
a<-table.end(a)
table.save(a,file='mytable.tab')