Free Statistics

of Irreproducible Research!

Author's title

Author*Unverified author*
R Software Modulerwasp_arimaforecasting.wasp
Title produced by softwareARIMA Forecasting
Date of computationWed, 30 Nov 2016 11:35:49 +0000
Cite this page as followsStatistical Computations at FreeStatistics.org, Office for Research Development and Education, URL https://freestatistics.org/blog/index.php?v=date/2016/Nov/30/t1480505838adqyr0mx3vm5o4a.htm/, Retrieved Sun, 19 May 2024 02:05:35 +0200
Statistical Computations at FreeStatistics.org, Office for Research Development and Education, URL https://freestatistics.org/blog/index.php?pk=, Retrieved Sun, 19 May 2024 02:05:35 +0200
QR Codes:

Original text written by user:
IsPrivate?No (this computation is public)
User-defined keywordsEURUSD
Estimated Impact0
Dataseries X:
1.09191
1.09169
1.07962
1.08327
1.11525
1.12541
1.11293
1.09397
1.10013
1.11501
1.12694
1.11625
1.13897
1.13998
1.12825
1.12216
1.14499
1.14038
1.13107
1.12158
1.11120
1.13547
1.12525
1.12784
1.10852
1.11342
1.10511
1.10686
1.09731
1.11776
1.10870
1.11609
1.13272
1.11931
1.11577
1.12258
1.11532
1.12266
1.12326
1.11957
1.09711
1.08803
1.09820
1.11379
1.08467
1.05923
1.05808
1.06288


Summary of computational transaction
Raw Inputview raw input (R code)
Raw Outputview raw output of R engine
Computing time1 seconds
R Server'Sir Maurice George Kendall' @ kendall.wessa.net

\begin{tabular}{lllllllll}
\hline
Summary of computational transaction \tabularnewline
Raw Input & view raw input (R code)  \tabularnewline
Raw Output & view raw output of R engine  \tabularnewline
Computing time & 1 seconds \tabularnewline
R Server & 'Sir Maurice George Kendall' @ kendall.wessa.net \tabularnewline
\hline
\end{tabular}
%Source: https://freestatistics.org/blog/index.php?pk=&T=0

[TABLE]
[ROW][C]Summary of computational transaction[/C][/ROW]
[ROW][C]Raw Input[/C][C]view raw input (R code) [/C][/ROW]
[ROW][C]Raw Output[/C][C]view raw output of R engine [/C][/ROW]
[ROW][C]Computing time[/C][C]1 seconds[/C][/ROW]
[ROW][C]R Server[/C][C]'Sir Maurice George Kendall' @ kendall.wessa.net[/C][/ROW]
[/TABLE]
Source: https://freestatistics.org/blog/index.php?pk=&T=0

Globally Unique Identifier (entire table): ba.freestatistics.org/blog/index.php?pk=&T=0

As an alternative you can also use a QR Code:  

The GUIDs for individual cells are displayed in the table below:

Summary of computational transaction
Raw Inputview raw input (R code)
Raw Outputview raw output of R engine
Computing time1 seconds
R Server'Sir Maurice George Kendall' @ kendall.wessa.net


Univariate ARIMA Extrapolation Forecast
timeY[t]F[t]95% LB95% UBp-value(H0: Y[t] = F[t])P(F[t]>Y[t-1])P(F[t]>Y[t-s])P(F[t]>Y[36])
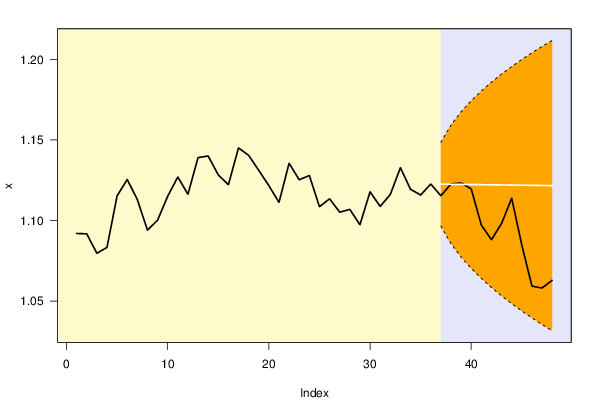
351.11577-------
361.12258-------
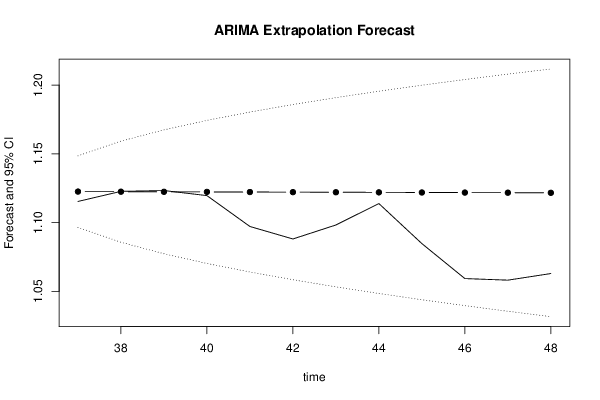
371.11531.12251.09651.14850.29430.49760.49760.4976
381.12271.12241.08561.15920.49490.64740.64740.4966
391.12331.12231.07731.16740.4840.49440.49440.4958
401.11961.12231.07021.17430.45970.48490.48490.4952
411.09711.12221.0641.18030.19910.5350.5350.4946
421.0881.12211.05841.18580.14730.7790.7790.4941
431.09821.1221.05321.19080.24880.83350.83350.4936
441.11381.12191.04841.19550.41410.73640.73640.4931
451.08471.12191.04381.19990.17510.58030.58030.4927
461.05921.12181.03951.2040.0680.81170.81170.4923
471.05811.12171.03541.20790.07410.92210.92210.492
481.06291.12161.03151.21170.10060.91660.91660.4916

\begin{tabular}{lllllllll}
\hline
Univariate ARIMA Extrapolation Forecast \tabularnewline
time & Y[t] & F[t] & 95% LB & 95% UB & p-value(H0: Y[t] = F[t]) & P(F[t]>Y[t-1]) & P(F[t]>Y[t-s]) & P(F[t]>Y[36]) \tabularnewline
35 & 1.11577 & - & - & - & - & - & - & - \tabularnewline
36 & 1.12258 & - & - & - & - & - & - & - \tabularnewline
37 & 1.1153 & 1.1225 & 1.0965 & 1.1485 & 0.2943 & 0.4976 & 0.4976 & 0.4976 \tabularnewline
38 & 1.1227 & 1.1224 & 1.0856 & 1.1592 & 0.4949 & 0.6474 & 0.6474 & 0.4966 \tabularnewline
39 & 1.1233 & 1.1223 & 1.0773 & 1.1674 & 0.484 & 0.4944 & 0.4944 & 0.4958 \tabularnewline
40 & 1.1196 & 1.1223 & 1.0702 & 1.1743 & 0.4597 & 0.4849 & 0.4849 & 0.4952 \tabularnewline
41 & 1.0971 & 1.1222 & 1.064 & 1.1803 & 0.1991 & 0.535 & 0.535 & 0.4946 \tabularnewline
42 & 1.088 & 1.1221 & 1.0584 & 1.1858 & 0.1473 & 0.779 & 0.779 & 0.4941 \tabularnewline
43 & 1.0982 & 1.122 & 1.0532 & 1.1908 & 0.2488 & 0.8335 & 0.8335 & 0.4936 \tabularnewline
44 & 1.1138 & 1.1219 & 1.0484 & 1.1955 & 0.4141 & 0.7364 & 0.7364 & 0.4931 \tabularnewline
45 & 1.0847 & 1.1219 & 1.0438 & 1.1999 & 0.1751 & 0.5803 & 0.5803 & 0.4927 \tabularnewline
46 & 1.0592 & 1.1218 & 1.0395 & 1.204 & 0.068 & 0.8117 & 0.8117 & 0.4923 \tabularnewline
47 & 1.0581 & 1.1217 & 1.0354 & 1.2079 & 0.0741 & 0.9221 & 0.9221 & 0.492 \tabularnewline
48 & 1.0629 & 1.1216 & 1.0315 & 1.2117 & 0.1006 & 0.9166 & 0.9166 & 0.4916 \tabularnewline
\hline
\end{tabular}
%Source: https://freestatistics.org/blog/index.php?pk=&T=1

[TABLE]
[ROW][C]Univariate ARIMA Extrapolation Forecast[/C][/ROW]
[ROW][C]time[/C][C]Y[t][/C][C]F[t][/C][C]95% LB[/C][C]95% UB[/C][C]p-value(H0: Y[t] = F[t])[/C][C]P(F[t]>Y[t-1])[/C][C]P(F[t]>Y[t-s])[/C][C]P(F[t]>Y[36])[/C][/ROW]
[ROW][C]35[/C][C]1.11577[/C][C]-[/C][C]-[/C][C]-[/C][C]-[/C][C]-[/C][C]-[/C][C]-[/C][/ROW]
[ROW][C]36[/C][C]1.12258[/C][C]-[/C][C]-[/C][C]-[/C][C]-[/C][C]-[/C][C]-[/C][C]-[/C][/ROW]
[ROW][C]37[/C][C]1.1153[/C][C]1.1225[/C][C]1.0965[/C][C]1.1485[/C][C]0.2943[/C][C]0.4976[/C][C]0.4976[/C][C]0.4976[/C][/ROW]
[ROW][C]38[/C][C]1.1227[/C][C]1.1224[/C][C]1.0856[/C][C]1.1592[/C][C]0.4949[/C][C]0.6474[/C][C]0.6474[/C][C]0.4966[/C][/ROW]
[ROW][C]39[/C][C]1.1233[/C][C]1.1223[/C][C]1.0773[/C][C]1.1674[/C][C]0.484[/C][C]0.4944[/C][C]0.4944[/C][C]0.4958[/C][/ROW]
[ROW][C]40[/C][C]1.1196[/C][C]1.1223[/C][C]1.0702[/C][C]1.1743[/C][C]0.4597[/C][C]0.4849[/C][C]0.4849[/C][C]0.4952[/C][/ROW]
[ROW][C]41[/C][C]1.0971[/C][C]1.1222[/C][C]1.064[/C][C]1.1803[/C][C]0.1991[/C][C]0.535[/C][C]0.535[/C][C]0.4946[/C][/ROW]
[ROW][C]42[/C][C]1.088[/C][C]1.1221[/C][C]1.0584[/C][C]1.1858[/C][C]0.1473[/C][C]0.779[/C][C]0.779[/C][C]0.4941[/C][/ROW]
[ROW][C]43[/C][C]1.0982[/C][C]1.122[/C][C]1.0532[/C][C]1.1908[/C][C]0.2488[/C][C]0.8335[/C][C]0.8335[/C][C]0.4936[/C][/ROW]
[ROW][C]44[/C][C]1.1138[/C][C]1.1219[/C][C]1.0484[/C][C]1.1955[/C][C]0.4141[/C][C]0.7364[/C][C]0.7364[/C][C]0.4931[/C][/ROW]
[ROW][C]45[/C][C]1.0847[/C][C]1.1219[/C][C]1.0438[/C][C]1.1999[/C][C]0.1751[/C][C]0.5803[/C][C]0.5803[/C][C]0.4927[/C][/ROW]
[ROW][C]46[/C][C]1.0592[/C][C]1.1218[/C][C]1.0395[/C][C]1.204[/C][C]0.068[/C][C]0.8117[/C][C]0.8117[/C][C]0.4923[/C][/ROW]
[ROW][C]47[/C][C]1.0581[/C][C]1.1217[/C][C]1.0354[/C][C]1.2079[/C][C]0.0741[/C][C]0.9221[/C][C]0.9221[/C][C]0.492[/C][/ROW]
[ROW][C]48[/C][C]1.0629[/C][C]1.1216[/C][C]1.0315[/C][C]1.2117[/C][C]0.1006[/C][C]0.9166[/C][C]0.9166[/C][C]0.4916[/C][/ROW]
[/TABLE]
Source: https://freestatistics.org/blog/index.php?pk=&T=1

Globally Unique Identifier (entire table): ba.freestatistics.org/blog/index.php?pk=&T=1

As an alternative you can also use a QR Code:  

The GUIDs for individual cells are displayed in the table below:

Univariate ARIMA Extrapolation Forecast
timeY[t]F[t]95% LB95% UBp-value(H0: Y[t] = F[t])P(F[t]>Y[t-1])P(F[t]>Y[t-s])P(F[t]>Y[36])
351.11577-------
361.12258-------
371.11531.12251.09651.14850.29430.49760.49760.4976
381.12271.12241.08561.15920.49490.64740.64740.4966
391.12331.12231.07731.16740.4840.49440.49440.4958
401.11961.12231.07021.17430.45970.48490.48490.4952
411.09711.12221.0641.18030.19910.5350.5350.4946
421.0881.12211.05841.18580.14730.7790.7790.4941
431.09821.1221.05321.19080.24880.83350.83350.4936
441.11381.12191.04841.19550.41410.73640.73640.4931
451.08471.12191.04381.19990.17510.58030.58030.4927
461.05921.12181.03951.2040.0680.81170.81170.4923
471.05811.12171.03541.20790.07410.92210.92210.492
481.06291.12161.03151.21170.10060.91660.91660.4916


Univariate ARIMA Extrapolation Forecast Performance
time% S.E.PEMAPEsMAPESq.EMSERMSEScaledEMASE
370.0118-0.00640.00640.00641e-0400-0.61010.6101
380.01672e-040.00330.0033000.00510.02050.3153
390.02058e-040.00250.0025000.00420.07830.2363
400.0237-0.00240.00250.0025000.0039-0.22840.2343
410.0264-0.02280.00650.00656e-041e-040.0117-2.13020.6135
420.029-0.03130.01070.01050.00123e-040.0176-2.8950.9938
430.0313-0.02170.01220.01216e-043e-040.0186-2.02391.1409
440.0335-0.00730.01160.01151e-043e-040.0176-0.69221.0848
450.0355-0.03430.01410.0140.00144e-040.0207-3.161.3154
460.0374-0.0590.01860.01830.00398e-040.0279-5.31511.7154
470.0392-0.06010.02240.02190.0040.00110.0328-5.4062.0509
480.041-0.05530.02510.02460.00340.00130.0357-4.99122.2959

\begin{tabular}{lllllllll}
\hline
Univariate ARIMA Extrapolation Forecast Performance \tabularnewline
time & % S.E. & PE & MAPE & sMAPE & Sq.E & MSE & RMSE & ScaledE & MASE \tabularnewline
37 & 0.0118 & -0.0064 & 0.0064 & 0.0064 & 1e-04 & 0 & 0 & -0.6101 & 0.6101 \tabularnewline
38 & 0.0167 & 2e-04 & 0.0033 & 0.0033 & 0 & 0 & 0.0051 & 0.0205 & 0.3153 \tabularnewline
39 & 0.0205 & 8e-04 & 0.0025 & 0.0025 & 0 & 0 & 0.0042 & 0.0783 & 0.2363 \tabularnewline
40 & 0.0237 & -0.0024 & 0.0025 & 0.0025 & 0 & 0 & 0.0039 & -0.2284 & 0.2343 \tabularnewline
41 & 0.0264 & -0.0228 & 0.0065 & 0.0065 & 6e-04 & 1e-04 & 0.0117 & -2.1302 & 0.6135 \tabularnewline
42 & 0.029 & -0.0313 & 0.0107 & 0.0105 & 0.0012 & 3e-04 & 0.0176 & -2.895 & 0.9938 \tabularnewline
43 & 0.0313 & -0.0217 & 0.0122 & 0.0121 & 6e-04 & 3e-04 & 0.0186 & -2.0239 & 1.1409 \tabularnewline
44 & 0.0335 & -0.0073 & 0.0116 & 0.0115 & 1e-04 & 3e-04 & 0.0176 & -0.6922 & 1.0848 \tabularnewline
45 & 0.0355 & -0.0343 & 0.0141 & 0.014 & 0.0014 & 4e-04 & 0.0207 & -3.16 & 1.3154 \tabularnewline
46 & 0.0374 & -0.059 & 0.0186 & 0.0183 & 0.0039 & 8e-04 & 0.0279 & -5.3151 & 1.7154 \tabularnewline
47 & 0.0392 & -0.0601 & 0.0224 & 0.0219 & 0.004 & 0.0011 & 0.0328 & -5.406 & 2.0509 \tabularnewline
48 & 0.041 & -0.0553 & 0.0251 & 0.0246 & 0.0034 & 0.0013 & 0.0357 & -4.9912 & 2.2959 \tabularnewline
\hline
\end{tabular}
%Source: https://freestatistics.org/blog/index.php?pk=&T=2

[TABLE]
[ROW][C]Univariate ARIMA Extrapolation Forecast Performance[/C][/ROW]
[ROW][C]time[/C][C]% S.E.[/C][C]PE[/C][C]MAPE[/C][C]sMAPE[/C][C]Sq.E[/C][C]MSE[/C][C]RMSE[/C][C]ScaledE[/C][C]MASE[/C][/ROW]
[ROW][C]37[/C][C]0.0118[/C][C]-0.0064[/C][C]0.0064[/C][C]0.0064[/C][C]1e-04[/C][C]0[/C][C]0[/C][C]-0.6101[/C][C]0.6101[/C][/ROW]
[ROW][C]38[/C][C]0.0167[/C][C]2e-04[/C][C]0.0033[/C][C]0.0033[/C][C]0[/C][C]0[/C][C]0.0051[/C][C]0.0205[/C][C]0.3153[/C][/ROW]
[ROW][C]39[/C][C]0.0205[/C][C]8e-04[/C][C]0.0025[/C][C]0.0025[/C][C]0[/C][C]0[/C][C]0.0042[/C][C]0.0783[/C][C]0.2363[/C][/ROW]
[ROW][C]40[/C][C]0.0237[/C][C]-0.0024[/C][C]0.0025[/C][C]0.0025[/C][C]0[/C][C]0[/C][C]0.0039[/C][C]-0.2284[/C][C]0.2343[/C][/ROW]
[ROW][C]41[/C][C]0.0264[/C][C]-0.0228[/C][C]0.0065[/C][C]0.0065[/C][C]6e-04[/C][C]1e-04[/C][C]0.0117[/C][C]-2.1302[/C][C]0.6135[/C][/ROW]
[ROW][C]42[/C][C]0.029[/C][C]-0.0313[/C][C]0.0107[/C][C]0.0105[/C][C]0.0012[/C][C]3e-04[/C][C]0.0176[/C][C]-2.895[/C][C]0.9938[/C][/ROW]
[ROW][C]43[/C][C]0.0313[/C][C]-0.0217[/C][C]0.0122[/C][C]0.0121[/C][C]6e-04[/C][C]3e-04[/C][C]0.0186[/C][C]-2.0239[/C][C]1.1409[/C][/ROW]
[ROW][C]44[/C][C]0.0335[/C][C]-0.0073[/C][C]0.0116[/C][C]0.0115[/C][C]1e-04[/C][C]3e-04[/C][C]0.0176[/C][C]-0.6922[/C][C]1.0848[/C][/ROW]
[ROW][C]45[/C][C]0.0355[/C][C]-0.0343[/C][C]0.0141[/C][C]0.014[/C][C]0.0014[/C][C]4e-04[/C][C]0.0207[/C][C]-3.16[/C][C]1.3154[/C][/ROW]
[ROW][C]46[/C][C]0.0374[/C][C]-0.059[/C][C]0.0186[/C][C]0.0183[/C][C]0.0039[/C][C]8e-04[/C][C]0.0279[/C][C]-5.3151[/C][C]1.7154[/C][/ROW]
[ROW][C]47[/C][C]0.0392[/C][C]-0.0601[/C][C]0.0224[/C][C]0.0219[/C][C]0.004[/C][C]0.0011[/C][C]0.0328[/C][C]-5.406[/C][C]2.0509[/C][/ROW]
[ROW][C]48[/C][C]0.041[/C][C]-0.0553[/C][C]0.0251[/C][C]0.0246[/C][C]0.0034[/C][C]0.0013[/C][C]0.0357[/C][C]-4.9912[/C][C]2.2959[/C][/ROW]
[/TABLE]
Source: https://freestatistics.org/blog/index.php?pk=&T=2

Globally Unique Identifier (entire table): ba.freestatistics.org/blog/index.php?pk=&T=2

As an alternative you can also use a QR Code:  

The GUIDs for individual cells are displayed in the table below:

Univariate ARIMA Extrapolation Forecast Performance
time% S.E.PEMAPEsMAPESq.EMSERMSEScaledEMASE
370.0118-0.00640.00640.00641e-0400-0.61010.6101
380.01672e-040.00330.0033000.00510.02050.3153
390.02058e-040.00250.0025000.00420.07830.2363
400.0237-0.00240.00250.0025000.0039-0.22840.2343
410.0264-0.02280.00650.00656e-041e-040.0117-2.13020.6135
420.029-0.03130.01070.01050.00123e-040.0176-2.8950.9938
430.0313-0.02170.01220.01216e-043e-040.0186-2.02391.1409
440.0335-0.00730.01160.01151e-043e-040.0176-0.69221.0848
450.0355-0.03430.01410.0140.00144e-040.0207-3.161.3154
460.0374-0.0590.01860.01830.00398e-040.0279-5.31511.7154
470.0392-0.06010.02240.02190.0040.00110.0328-5.4062.0509
480.041-0.05530.02510.02460.00340.00130.0357-4.99122.2959


Parameters (Session):
par1 = 12 ; par2 = 1 ; par3 = 0 ; par4 = 0 ; par5 = 1 ; par6 = 1 ; par7 = 0 ; par8 = 0 ; par9 = 0 ; par10 = FALSE ;
Parameters (R input):
par1 = 12 ; par2 = 1 ; par3 = 0 ; par4 = 0 ; par5 = 1 ; par6 = 1 ; par7 = 0 ; par8 = 0 ; par9 = 0 ; par10 = FALSE ;
R code (references can be found in the software module):
par10 <- 'FALSE'
par9 <- '0'
par8 <- '0'
par7 <- '0'
par6 <- '0'
par5 <- '1'
par4 <- '0'
par3 <- '0'
par2 <- '1'
par1 <- '12'
par1 <- as.numeric(par1) #cut off periods
par2 <- as.numeric(par2) #lambda
par3 <- as.numeric(par3) #degree of non-seasonal differencing
par4 <- as.numeric(par4) #degree of seasonal differencing
par5 <- as.numeric(par5) #seasonal period
par6 <- as.numeric(par6) #p
par7 <- as.numeric(par7) #q
par8 <- as.numeric(par8) #P
par9 <- as.numeric(par9) #Q
if (par10 == 'TRUE') par10 <- TRUE
if (par10 == 'FALSE') par10 <- FALSE
if (par2 == 0) x <- log(x)
if (par2 != 0) x <- x^par2
lx <- length(x)
first <- lx - 2*par1
nx <- lx - par1
nx1 <- nx + 1
fx <- lx - nx
if (fx < 1) {
fx <- par5
nx1 <- lx + fx - 1
first <- lx - 2*fx
}
first <- 1
if (fx < 3) fx <- round(lx/10,0)
(arima.out <- arima(x[1:nx], order=c(par6,par3,par7), seasonal=list(order=c(par8,par4,par9), period=par5), include.mean=par10, method='ML'))
(forecast <- predict(arima.out,par1))
(lb <- forecast$pred - 1.96 * forecast$se)
(ub <- forecast$pred + 1.96 * forecast$se)
if (par2 == 0) {
x <- exp(x)
forecast$pred <- exp(forecast$pred)
lb <- exp(lb)
ub <- exp(ub)
}
if (par2 != 0) {
x <- x^(1/par2)
forecast$pred <- forecast$pred^(1/par2)
lb <- lb^(1/par2)
ub <- ub^(1/par2)
}
if (par2 < 0) {
olb <- lb
lb <- ub
ub <- olb
}
(actandfor <- c(x[1:nx], forecast$pred))
(perc.se <- (ub-forecast$pred)/1.96/forecast$pred)
bitmap(file='test1.png')
opar <- par(mar=c(4,4,2,2),las=1)
ylim <- c( min(x[first:nx],lb), max(x[first:nx],ub))
plot(x,ylim=ylim,type='n',xlim=c(first,lx))
usr <- par('usr')
rect(usr[1],usr[3],nx+1,usr[4],border=NA,col='lemonchiffon')
rect(nx1,usr[3],usr[2],usr[4],border=NA,col='lavender')
abline(h= (-3:3)*2 , col ='gray', lty =3)
polygon( c(nx1:lx,lx:nx1), c(lb,rev(ub)), col = 'orange', lty=2,border=NA)
lines(nx1:lx, lb , lty=2)
lines(nx1:lx, ub , lty=2)
lines(x, lwd=2)
lines(nx1:lx, forecast$pred , lwd=2 , col ='white')
box()
par(opar)
dev.off()
prob.dec <- array(NA, dim=fx)
prob.sdec <- array(NA, dim=fx)
prob.ldec <- array(NA, dim=fx)
prob.pval <- array(NA, dim=fx)
perf.pe <- array(0, dim=fx)
perf.spe <- array(0, dim=fx)
perf.scalederr <- array(0, dim=fx)
perf.mase <- array(0, dim=fx)
perf.mase1 <- array(0, dim=fx)
perf.mape <- array(0, dim=fx)
perf.smape <- array(0, dim=fx)
perf.mape1 <- array(0, dim=fx)
perf.smape1 <- array(0,dim=fx)
perf.se <- array(0, dim=fx)
perf.mse <- array(0, dim=fx)
perf.mse1 <- array(0, dim=fx)
perf.rmse <- array(0, dim=fx)
perf.scaleddenom <- 0
for (i in 2:fx) {
perf.scaleddenom = perf.scaleddenom + abs(x[nx+i] - x[nx+i-1])
}
perf.scaleddenom = perf.scaleddenom / (fx-1)
for (i in 1:fx) {
locSD <- (ub[i] - forecast$pred[i]) / 1.96
perf.scalederr[i] = (x[nx+i] - forecast$pred[i]) / perf.scaleddenom
perf.pe[i] = (x[nx+i] - forecast$pred[i]) / x[nx+i]
perf.spe[i] = 2*(x[nx+i] - forecast$pred[i]) / (x[nx+i] + forecast$pred[i])
perf.se[i] = (x[nx+i] - forecast$pred[i])^2
prob.dec[i] = pnorm((x[nx+i-1] - forecast$pred[i]) / locSD)
prob.sdec[i] = pnorm((x[nx+i-par5] - forecast$pred[i]) / locSD)
prob.ldec[i] = pnorm((x[nx] - forecast$pred[i]) / locSD)
prob.pval[i] = pnorm(abs(x[nx+i] - forecast$pred[i]) / locSD)
}
perf.mape[1] = abs(perf.pe[1])
perf.smape[1] = abs(perf.spe[1])
perf.mape1[1] = perf.mape[1]
perf.smape1[1] = perf.smape[1]
perf.mse[1] = perf.se[1]
perf.mase[1] = abs(perf.scalederr[1])
perf.mase1[1] = perf.mase[1]
for (i in 2:fx) {
perf.mape[i] = perf.mape[i-1] + abs(perf.pe[i])
perf.mape1[i] = perf.mape[i] / i
perf.smape[i] = perf.smape[i-1] + abs(perf.spe[i])
perf.smape1[i] = perf.smape[i] / i
perf.mse[i] = perf.mse[i-1] + perf.se[i]
perf.mse1[i] = perf.mse[i] / i
perf.mase[i] = perf.mase[i-1] + abs(perf.scalederr[i])
perf.mase1[i] = perf.mase[i] / i
}
perf.rmse = sqrt(perf.mse1)
bitmap(file='test2.png')
plot(forecast$pred, pch=19, type='b',main='ARIMA Extrapolation Forecast', ylab='Forecast and 95% CI', xlab='time',ylim=c(min(lb),max(ub)))
dum <- forecast$pred
dum[1:par1] <- x[(nx+1):lx]
lines(dum, lty=1)
lines(ub,lty=3)
lines(lb,lty=3)
dev.off()
load(file='createtable')
a<-table.start()
a<-table.row.start(a)
a<-table.element(a,'Univariate ARIMA Extrapolation Forecast',9,TRUE)
a<-table.row.end(a)
a<-table.row.start(a)
a<-table.element(a,'time',1,header=TRUE)
a<-table.element(a,'Y[t]',1,header=TRUE)
a<-table.element(a,'F[t]',1,header=TRUE)
a<-table.element(a,'95% LB',1,header=TRUE)
a<-table.element(a,'95% UB',1,header=TRUE)
a<-table.element(a,'p-value
(H0: Y[t] = F[t])',1,header=TRUE)
a<-table.element(a,'P(F[t]>Y[t-1])',1,header=TRUE)
a<-table.element(a,'P(F[t]>Y[t-s])',1,header=TRUE)
mylab <- paste('P(F[t]>Y[',nx,sep='')
mylab <- paste(mylab,'])',sep='')
a<-table.element(a,mylab,1,header=TRUE)
a<-table.row.end(a)
for (i in (nx-par5):nx) {
a<-table.row.start(a)
a<-table.element(a,i,header=TRUE)
a<-table.element(a,x[i])
a<-table.element(a,'-')
a<-table.row.end(a)
}
for (i in 1:fx) {
a<-table.row.start(a)
a<-table.element(a,nx+i,header=TRUE)
a<-table.element(a,round(x[nx+i],4))
a<-table.element(a,round(forecast$pred[i],4))
a<-table.element(a,round(lb[i],4))
a<-table.element(a,round(ub[i],4))
a<-table.element(a,round((1-prob.pval[i]),4))
a<-table.element(a,round((1-prob.dec[i]),4))
a<-table.element(a,round((1-prob.sdec[i]),4))
a<-table.element(a,round((1-prob.ldec[i]),4))
a<-table.row.end(a)
}
a<-table.end(a)
table.save(a,file='mytable.tab')
a<-table.start()
a<-table.row.start(a)
a<-table.element(a,'Univariate ARIMA Extrapolation Forecast Performance',10,TRUE)
a<-table.row.end(a)
a<-table.row.start(a)
a<-table.element(a,'time',1,header=TRUE)
a<-table.element(a,'% S.E.',1,header=TRUE)
a<-table.element(a,'PE',1,header=TRUE)
a<-table.element(a,'MAPE',1,header=TRUE)
a<-table.element(a,'sMAPE',1,header=TRUE)
a<-table.element(a,'Sq.E',1,header=TRUE)
a<-table.element(a,'MSE',1,header=TRUE)
a<-table.element(a,'RMSE',1,header=TRUE)
a<-table.element(a,'ScaledE',1,header=TRUE)
a<-table.element(a,'MASE',1,header=TRUE)
a<-table.row.end(a)
for (i in 1:fx) {
a<-table.row.start(a)
a<-table.element(a,nx+i,header=TRUE)
a<-table.element(a,round(perc.se[i],4))
a<-table.element(a,round(perf.pe[i],4))
a<-table.element(a,round(perf.mape1[i],4))
a<-table.element(a,round(perf.smape1[i],4))
a<-table.element(a,round(perf.se[i],4))
a<-table.element(a,round(perf.mse1[i],4))
a<-table.element(a,round(perf.rmse[i],4))
a<-table.element(a,round(perf.scalederr[i],4))
a<-table.element(a,round(perf.mase1[i],4))
a<-table.row.end(a)
}
a<-table.end(a)
table.save(a,file='mytable1.tab')