Free Statistics

of Irreproducible Research!

Author's title

Author*The author of this computation has been verified*
R Software Modulerwasp_autocorrelation.wasp
Title produced by software(Partial) Autocorrelation Function
Date of computationFri, 25 Nov 2016 19:40:05 +0100
Cite this page as followsStatistical Computations at FreeStatistics.org, Office for Research Development and Education, URL https://freestatistics.org/blog/index.php?v=date/2016/Nov/25/t148009924959mpsovb1vrcuv9.htm/, Retrieved Sun, 19 May 2024 03:45:24 +0000
Statistical Computations at FreeStatistics.org, Office for Research Development and Education, URL https://freestatistics.org/blog/index.php?pk=297105, Retrieved Sun, 19 May 2024 03:45:24 +0000
QR Codes:

Original text written by user:
IsPrivate?No (this computation is public)
User-defined keywords
Estimated Impact51
Family? (F = Feedback message, R = changed R code, M = changed R Module, P = changed Parameters, D = changed Data)
-       [(Partial) Autocorrelation Function] [(Partial) Autocor...] [2016-11-25 18:40:05] [4c05fa0998bf98e29c2e453b139976f4] [Current]
Feedback Forum

Post a new message
Dataseries X:
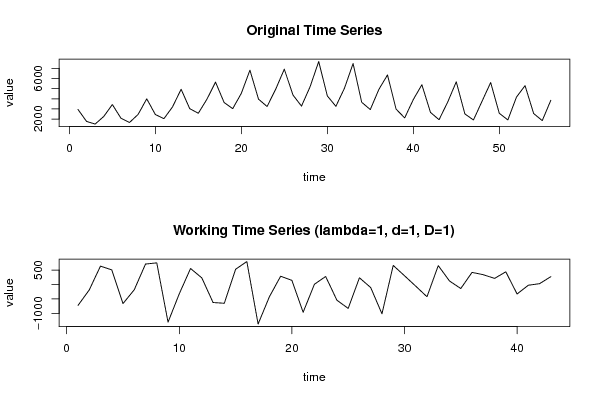
2954.4
1769.7
1509.9
2257.2
3433.2
2083.8
1664.7
2463.3
3995.4
2447.4
2042.7
3198.6
4935.3
3024
2573.7
3957.9
5640.6
3630
3028.2
4534.2
6815.1
3962.4
3236.4
4946.1
6911.7
4376.1
3276
5187
7664.1
4283.7
3254.7
5046.6
7470.6
3655.8
2937.3
4923.9
6344.7
2981.7
2114.7
3919.5
5380.8
2661
1935.9
3669.9
5669.7
2508.9
1911.6
3758.1
5597.7
2573.4
1916.7
4160.1
5292.6
2547
1850.4
3855.6


Summary of computational transaction
Raw Input view raw input (R code)
Raw Outputview raw output of R engine
Computing time1 seconds
R ServerBig Analytics Cloud Computing Center

\begin{tabular}{lllllllll}
\hline
Summary of computational transaction \tabularnewline
Raw Input view raw input (R code)  \tabularnewline
Raw Outputview raw output of R engine  \tabularnewline
Computing time1 seconds \tabularnewline
R ServerBig Analytics Cloud Computing Center \tabularnewline
\hline
\end{tabular}
%Source: https://freestatistics.org/blog/index.php?pk=297105&T=0

[TABLE]
[ROW]
Summary of computational transaction[/C][/ROW] [ROW]Raw Input[/C] view raw input (R code) [/C][/ROW] [ROW]Raw Output[/C]view raw output of R engine [/C][/ROW] [ROW]Computing time[/C]1 seconds[/C][/ROW] [ROW]R Server[/C]Big Analytics Cloud Computing Center[/C][/ROW] [/TABLE] Source: https://freestatistics.org/blog/index.php?pk=297105&T=0

Globally Unique Identifier (entire table): ba.freestatistics.org/blog/index.php?pk=297105&T=0

As an alternative you can also use a QR Code:  

The GUIDs for individual cells are displayed in the table below:

Summary of computational transaction
Raw Input view raw input (R code)
Raw Outputview raw output of R engine
Computing time1 seconds
R ServerBig Analytics Cloud Computing Center


Autocorrelation Function
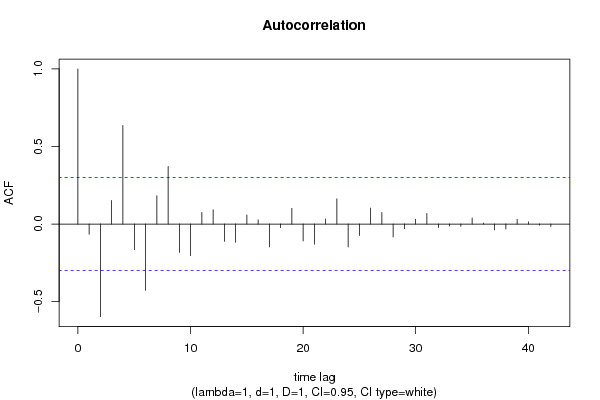
Time lag kACF(k)T-STATP-value
1-0.065649-0.43050.334495
2-0.597049-3.91510.000159
30.1514640.99320.163081
40.6350574.16437.4e-05
5-0.164739-1.08030.143023
6-0.42669-2.7980.003832
70.1821991.19480.119365
80.371512.43620.009531
9-0.182787-1.19860.118621
10-0.203735-1.3360.094291
110.0741150.4860.314715
120.0917320.60150.275324
13-0.111797-0.73310.233738
14-0.117893-0.77310.221853
150.0584660.38340.351661
160.0271880.17830.429668
17-0.14736-0.96630.169648
18-0.023071-0.15130.440229
190.1010830.66280.255484
20-0.108702-0.71280.239908
21-0.12968-0.85040.199915
220.0324050.21250.416363
230.1623481.06460.146502
24-0.147847-0.96950.168859
25-0.0735-0.4820.316136
260.1026940.67340.252145
270.0746810.48970.313413
28-0.082756-0.54270.295079
29-0.029503-0.19350.423754
300.0313670.20570.419004
310.0678610.4450.329279
32-0.022385-0.14680.441992
33-0.013015-0.08530.466191
34-0.013843-0.09080.464047
350.0392920.25770.398951
360.006220.04080.483828
37-0.037807-0.24790.40269
38-0.031455-0.20630.418778
390.0301960.1980.421986
400.0139480.09150.463775
41-0.006912-0.04530.482028
42-0.01565-0.10260.459369
43NANANA
44NANANA
45NANANA
46NANANA
47NANANA
48NANANA

\begin{tabular}{lllllllll}
\hline
Autocorrelation Function \tabularnewline
Time lag k & ACF(k) & T-STAT & P-value \tabularnewline
1 & -0.065649 & -0.4305 & 0.334495 \tabularnewline
2 & -0.597049 & -3.9151 & 0.000159 \tabularnewline
3 & 0.151464 & 0.9932 & 0.163081 \tabularnewline
4 & 0.635057 & 4.1643 & 7.4e-05 \tabularnewline
5 & -0.164739 & -1.0803 & 0.143023 \tabularnewline
6 & -0.42669 & -2.798 & 0.003832 \tabularnewline
7 & 0.182199 & 1.1948 & 0.119365 \tabularnewline
8 & 0.37151 & 2.4362 & 0.009531 \tabularnewline
9 & -0.182787 & -1.1986 & 0.118621 \tabularnewline
10 & -0.203735 & -1.336 & 0.094291 \tabularnewline
11 & 0.074115 & 0.486 & 0.314715 \tabularnewline
12 & 0.091732 & 0.6015 & 0.275324 \tabularnewline
13 & -0.111797 & -0.7331 & 0.233738 \tabularnewline
14 & -0.117893 & -0.7731 & 0.221853 \tabularnewline
15 & 0.058466 & 0.3834 & 0.351661 \tabularnewline
16 & 0.027188 & 0.1783 & 0.429668 \tabularnewline
17 & -0.14736 & -0.9663 & 0.169648 \tabularnewline
18 & -0.023071 & -0.1513 & 0.440229 \tabularnewline
19 & 0.101083 & 0.6628 & 0.255484 \tabularnewline
20 & -0.108702 & -0.7128 & 0.239908 \tabularnewline
21 & -0.12968 & -0.8504 & 0.199915 \tabularnewline
22 & 0.032405 & 0.2125 & 0.416363 \tabularnewline
23 & 0.162348 & 1.0646 & 0.146502 \tabularnewline
24 & -0.147847 & -0.9695 & 0.168859 \tabularnewline
25 & -0.0735 & -0.482 & 0.316136 \tabularnewline
26 & 0.102694 & 0.6734 & 0.252145 \tabularnewline
27 & 0.074681 & 0.4897 & 0.313413 \tabularnewline
28 & -0.082756 & -0.5427 & 0.295079 \tabularnewline
29 & -0.029503 & -0.1935 & 0.423754 \tabularnewline
30 & 0.031367 & 0.2057 & 0.419004 \tabularnewline
31 & 0.067861 & 0.445 & 0.329279 \tabularnewline
32 & -0.022385 & -0.1468 & 0.441992 \tabularnewline
33 & -0.013015 & -0.0853 & 0.466191 \tabularnewline
34 & -0.013843 & -0.0908 & 0.464047 \tabularnewline
35 & 0.039292 & 0.2577 & 0.398951 \tabularnewline
36 & 0.00622 & 0.0408 & 0.483828 \tabularnewline
37 & -0.037807 & -0.2479 & 0.40269 \tabularnewline
38 & -0.031455 & -0.2063 & 0.418778 \tabularnewline
39 & 0.030196 & 0.198 & 0.421986 \tabularnewline
40 & 0.013948 & 0.0915 & 0.463775 \tabularnewline
41 & -0.006912 & -0.0453 & 0.482028 \tabularnewline
42 & -0.01565 & -0.1026 & 0.459369 \tabularnewline
43 & NA & NA & NA \tabularnewline
44 & NA & NA & NA \tabularnewline
45 & NA & NA & NA \tabularnewline
46 & NA & NA & NA \tabularnewline
47 & NA & NA & NA \tabularnewline
48 & NA & NA & NA \tabularnewline
\hline
\end{tabular}
%Source: https://freestatistics.org/blog/index.php?pk=297105&T=1

[TABLE]
[ROW][C]Autocorrelation Function[/C][/ROW]
[ROW][C]Time lag k[/C][C]ACF(k)[/C][C]T-STAT[/C][C]P-value[/C][/ROW]
[ROW][C]1[/C][C]-0.065649[/C][C]-0.4305[/C][C]0.334495[/C][/ROW]
[ROW][C]2[/C][C]-0.597049[/C][C]-3.9151[/C][C]0.000159[/C][/ROW]
[ROW][C]3[/C][C]0.151464[/C][C]0.9932[/C][C]0.163081[/C][/ROW]
[ROW][C]4[/C][C]0.635057[/C][C]4.1643[/C][C]7.4e-05[/C][/ROW]
[ROW][C]5[/C][C]-0.164739[/C][C]-1.0803[/C][C]0.143023[/C][/ROW]
[ROW][C]6[/C][C]-0.42669[/C][C]-2.798[/C][C]0.003832[/C][/ROW]
[ROW][C]7[/C][C]0.182199[/C][C]1.1948[/C][C]0.119365[/C][/ROW]
[ROW][C]8[/C][C]0.37151[/C][C]2.4362[/C][C]0.009531[/C][/ROW]
[ROW][C]9[/C][C]-0.182787[/C][C]-1.1986[/C][C]0.118621[/C][/ROW]
[ROW][C]10[/C][C]-0.203735[/C][C]-1.336[/C][C]0.094291[/C][/ROW]
[ROW][C]11[/C][C]0.074115[/C][C]0.486[/C][C]0.314715[/C][/ROW]
[ROW][C]12[/C][C]0.091732[/C][C]0.6015[/C][C]0.275324[/C][/ROW]
[ROW][C]13[/C][C]-0.111797[/C][C]-0.7331[/C][C]0.233738[/C][/ROW]
[ROW][C]14[/C][C]-0.117893[/C][C]-0.7731[/C][C]0.221853[/C][/ROW]
[ROW][C]15[/C][C]0.058466[/C][C]0.3834[/C][C]0.351661[/C][/ROW]
[ROW][C]16[/C][C]0.027188[/C][C]0.1783[/C][C]0.429668[/C][/ROW]
[ROW][C]17[/C][C]-0.14736[/C][C]-0.9663[/C][C]0.169648[/C][/ROW]
[ROW][C]18[/C][C]-0.023071[/C][C]-0.1513[/C][C]0.440229[/C][/ROW]
[ROW][C]19[/C][C]0.101083[/C][C]0.6628[/C][C]0.255484[/C][/ROW]
[ROW][C]20[/C][C]-0.108702[/C][C]-0.7128[/C][C]0.239908[/C][/ROW]
[ROW][C]21[/C][C]-0.12968[/C][C]-0.8504[/C][C]0.199915[/C][/ROW]
[ROW][C]22[/C][C]0.032405[/C][C]0.2125[/C][C]0.416363[/C][/ROW]
[ROW][C]23[/C][C]0.162348[/C][C]1.0646[/C][C]0.146502[/C][/ROW]
[ROW][C]24[/C][C]-0.147847[/C][C]-0.9695[/C][C]0.168859[/C][/ROW]
[ROW][C]25[/C][C]-0.0735[/C][C]-0.482[/C][C]0.316136[/C][/ROW]
[ROW][C]26[/C][C]0.102694[/C][C]0.6734[/C][C]0.252145[/C][/ROW]
[ROW][C]27[/C][C]0.074681[/C][C]0.4897[/C][C]0.313413[/C][/ROW]
[ROW][C]28[/C][C]-0.082756[/C][C]-0.5427[/C][C]0.295079[/C][/ROW]
[ROW][C]29[/C][C]-0.029503[/C][C]-0.1935[/C][C]0.423754[/C][/ROW]
[ROW][C]30[/C][C]0.031367[/C][C]0.2057[/C][C]0.419004[/C][/ROW]
[ROW][C]31[/C][C]0.067861[/C][C]0.445[/C][C]0.329279[/C][/ROW]
[ROW][C]32[/C][C]-0.022385[/C][C]-0.1468[/C][C]0.441992[/C][/ROW]
[ROW][C]33[/C][C]-0.013015[/C][C]-0.0853[/C][C]0.466191[/C][/ROW]
[ROW][C]34[/C][C]-0.013843[/C][C]-0.0908[/C][C]0.464047[/C][/ROW]
[ROW][C]35[/C][C]0.039292[/C][C]0.2577[/C][C]0.398951[/C][/ROW]
[ROW][C]36[/C][C]0.00622[/C][C]0.0408[/C][C]0.483828[/C][/ROW]
[ROW][C]37[/C][C]-0.037807[/C][C]-0.2479[/C][C]0.40269[/C][/ROW]
[ROW][C]38[/C][C]-0.031455[/C][C]-0.2063[/C][C]0.418778[/C][/ROW]
[ROW][C]39[/C][C]0.030196[/C][C]0.198[/C][C]0.421986[/C][/ROW]
[ROW][C]40[/C][C]0.013948[/C][C]0.0915[/C][C]0.463775[/C][/ROW]
[ROW][C]41[/C][C]-0.006912[/C][C]-0.0453[/C][C]0.482028[/C][/ROW]
[ROW][C]42[/C][C]-0.01565[/C][C]-0.1026[/C][C]0.459369[/C][/ROW]
[ROW][C]43[/C][C]NA[/C][C]NA[/C][C]NA[/C][/ROW]
[ROW][C]44[/C][C]NA[/C][C]NA[/C][C]NA[/C][/ROW]
[ROW][C]45[/C][C]NA[/C][C]NA[/C][C]NA[/C][/ROW]
[ROW][C]46[/C][C]NA[/C][C]NA[/C][C]NA[/C][/ROW]
[ROW][C]47[/C][C]NA[/C][C]NA[/C][C]NA[/C][/ROW]
[ROW][C]48[/C][C]NA[/C][C]NA[/C][C]NA[/C][/ROW]
[/TABLE]
Source: https://freestatistics.org/blog/index.php?pk=297105&T=1

Globally Unique Identifier (entire table): ba.freestatistics.org/blog/index.php?pk=297105&T=1

As an alternative you can also use a QR Code:  

The GUIDs for individual cells are displayed in the table below:

Autocorrelation Function
Time lag kACF(k)T-STATP-value
1-0.065649-0.43050.334495
2-0.597049-3.91510.000159
30.1514640.99320.163081
40.6350574.16437.4e-05
5-0.164739-1.08030.143023
6-0.42669-2.7980.003832
70.1821991.19480.119365
80.371512.43620.009531
9-0.182787-1.19860.118621
10-0.203735-1.3360.094291
110.0741150.4860.314715
120.0917320.60150.275324
13-0.111797-0.73310.233738
14-0.117893-0.77310.221853
150.0584660.38340.351661
160.0271880.17830.429668
17-0.14736-0.96630.169648
18-0.023071-0.15130.440229
190.1010830.66280.255484
20-0.108702-0.71280.239908
21-0.12968-0.85040.199915
220.0324050.21250.416363
230.1623481.06460.146502
24-0.147847-0.96950.168859
25-0.0735-0.4820.316136
260.1026940.67340.252145
270.0746810.48970.313413
28-0.082756-0.54270.295079
29-0.029503-0.19350.423754
300.0313670.20570.419004
310.0678610.4450.329279
32-0.022385-0.14680.441992
33-0.013015-0.08530.466191
34-0.013843-0.09080.464047
350.0392920.25770.398951
360.006220.04080.483828
37-0.037807-0.24790.40269
38-0.031455-0.20630.418778
390.0301960.1980.421986
400.0139480.09150.463775
41-0.006912-0.04530.482028
42-0.01565-0.10260.459369
43NANANA
44NANANA
45NANANA
46NANANA
47NANANA
48NANANA


Partial Autocorrelation Function
Time lag kPACF(k)T-STATP-value
1-0.065649-0.43050.334495
2-0.603962-3.96040.000138
30.0773860.50750.307214
40.4664793.05890.001908
50.0745270.48870.313767
60.0551630.36170.359663
7-0.065286-0.42810.335354
8-0.061755-0.4050.343758
9-0.022674-0.14870.441249
100.1347440.88360.190919
11-0.161536-1.05930.147697
12-0.207613-1.36140.090238
13-0.141838-0.93010.178757
14-0.174284-1.14290.129711
150.1153760.75660.226716
160.0936980.61440.271089
17-0.14755-0.96760.16934
18-0.033213-0.21780.41431
190.0358880.23530.407533
20-0.131268-0.86080.197067
210.0627730.41160.341329
22-0.133565-0.87580.192991
230.0272860.17890.429418
24-0.040883-0.26810.394958
250.1526521.0010.161211
26-0.038019-0.24930.402156
27-0.035607-0.23350.408245
280.0600160.39350.347929
29-0.068611-0.44990.327516
30-0.021948-0.14390.443116
31-0.027677-0.18150.428418
32-0.102413-0.67160.252725
33-0.031195-0.20460.41944
34-0.008081-0.0530.478992
35-0.029286-0.1920.424308
36-0.041083-0.26940.394456
37-0.032284-0.21170.416671
38-0.065257-0.42790.335422
39-0.019327-0.12670.449871
400.0675440.44290.330023
41-0.011961-0.07840.468925
420.0111750.07330.470961
43NANANA
44NANANA
45NANANA
46NANANA
47NANANA
48NANANA

\begin{tabular}{lllllllll}
\hline
Partial Autocorrelation Function \tabularnewline
Time lag k & PACF(k) & T-STAT & P-value \tabularnewline
1 & -0.065649 & -0.4305 & 0.334495 \tabularnewline
2 & -0.603962 & -3.9604 & 0.000138 \tabularnewline
3 & 0.077386 & 0.5075 & 0.307214 \tabularnewline
4 & 0.466479 & 3.0589 & 0.001908 \tabularnewline
5 & 0.074527 & 0.4887 & 0.313767 \tabularnewline
6 & 0.055163 & 0.3617 & 0.359663 \tabularnewline
7 & -0.065286 & -0.4281 & 0.335354 \tabularnewline
8 & -0.061755 & -0.405 & 0.343758 \tabularnewline
9 & -0.022674 & -0.1487 & 0.441249 \tabularnewline
10 & 0.134744 & 0.8836 & 0.190919 \tabularnewline
11 & -0.161536 & -1.0593 & 0.147697 \tabularnewline
12 & -0.207613 & -1.3614 & 0.090238 \tabularnewline
13 & -0.141838 & -0.9301 & 0.178757 \tabularnewline
14 & -0.174284 & -1.1429 & 0.129711 \tabularnewline
15 & 0.115376 & 0.7566 & 0.226716 \tabularnewline
16 & 0.093698 & 0.6144 & 0.271089 \tabularnewline
17 & -0.14755 & -0.9676 & 0.16934 \tabularnewline
18 & -0.033213 & -0.2178 & 0.41431 \tabularnewline
19 & 0.035888 & 0.2353 & 0.407533 \tabularnewline
20 & -0.131268 & -0.8608 & 0.197067 \tabularnewline
21 & 0.062773 & 0.4116 & 0.341329 \tabularnewline
22 & -0.133565 & -0.8758 & 0.192991 \tabularnewline
23 & 0.027286 & 0.1789 & 0.429418 \tabularnewline
24 & -0.040883 & -0.2681 & 0.394958 \tabularnewline
25 & 0.152652 & 1.001 & 0.161211 \tabularnewline
26 & -0.038019 & -0.2493 & 0.402156 \tabularnewline
27 & -0.035607 & -0.2335 & 0.408245 \tabularnewline
28 & 0.060016 & 0.3935 & 0.347929 \tabularnewline
29 & -0.068611 & -0.4499 & 0.327516 \tabularnewline
30 & -0.021948 & -0.1439 & 0.443116 \tabularnewline
31 & -0.027677 & -0.1815 & 0.428418 \tabularnewline
32 & -0.102413 & -0.6716 & 0.252725 \tabularnewline
33 & -0.031195 & -0.2046 & 0.41944 \tabularnewline
34 & -0.008081 & -0.053 & 0.478992 \tabularnewline
35 & -0.029286 & -0.192 & 0.424308 \tabularnewline
36 & -0.041083 & -0.2694 & 0.394456 \tabularnewline
37 & -0.032284 & -0.2117 & 0.416671 \tabularnewline
38 & -0.065257 & -0.4279 & 0.335422 \tabularnewline
39 & -0.019327 & -0.1267 & 0.449871 \tabularnewline
40 & 0.067544 & 0.4429 & 0.330023 \tabularnewline
41 & -0.011961 & -0.0784 & 0.468925 \tabularnewline
42 & 0.011175 & 0.0733 & 0.470961 \tabularnewline
43 & NA & NA & NA \tabularnewline
44 & NA & NA & NA \tabularnewline
45 & NA & NA & NA \tabularnewline
46 & NA & NA & NA \tabularnewline
47 & NA & NA & NA \tabularnewline
48 & NA & NA & NA \tabularnewline
\hline
\end{tabular}
%Source: https://freestatistics.org/blog/index.php?pk=297105&T=2

[TABLE]
[ROW][C]Partial Autocorrelation Function[/C][/ROW]
[ROW][C]Time lag k[/C][C]PACF(k)[/C][C]T-STAT[/C][C]P-value[/C][/ROW]
[ROW][C]1[/C][C]-0.065649[/C][C]-0.4305[/C][C]0.334495[/C][/ROW]
[ROW][C]2[/C][C]-0.603962[/C][C]-3.9604[/C][C]0.000138[/C][/ROW]
[ROW][C]3[/C][C]0.077386[/C][C]0.5075[/C][C]0.307214[/C][/ROW]
[ROW][C]4[/C][C]0.466479[/C][C]3.0589[/C][C]0.001908[/C][/ROW]
[ROW][C]5[/C][C]0.074527[/C][C]0.4887[/C][C]0.313767[/C][/ROW]
[ROW][C]6[/C][C]0.055163[/C][C]0.3617[/C][C]0.359663[/C][/ROW]
[ROW][C]7[/C][C]-0.065286[/C][C]-0.4281[/C][C]0.335354[/C][/ROW]
[ROW][C]8[/C][C]-0.061755[/C][C]-0.405[/C][C]0.343758[/C][/ROW]
[ROW][C]9[/C][C]-0.022674[/C][C]-0.1487[/C][C]0.441249[/C][/ROW]
[ROW][C]10[/C][C]0.134744[/C][C]0.8836[/C][C]0.190919[/C][/ROW]
[ROW][C]11[/C][C]-0.161536[/C][C]-1.0593[/C][C]0.147697[/C][/ROW]
[ROW][C]12[/C][C]-0.207613[/C][C]-1.3614[/C][C]0.090238[/C][/ROW]
[ROW][C]13[/C][C]-0.141838[/C][C]-0.9301[/C][C]0.178757[/C][/ROW]
[ROW][C]14[/C][C]-0.174284[/C][C]-1.1429[/C][C]0.129711[/C][/ROW]
[ROW][C]15[/C][C]0.115376[/C][C]0.7566[/C][C]0.226716[/C][/ROW]
[ROW][C]16[/C][C]0.093698[/C][C]0.6144[/C][C]0.271089[/C][/ROW]
[ROW][C]17[/C][C]-0.14755[/C][C]-0.9676[/C][C]0.16934[/C][/ROW]
[ROW][C]18[/C][C]-0.033213[/C][C]-0.2178[/C][C]0.41431[/C][/ROW]
[ROW][C]19[/C][C]0.035888[/C][C]0.2353[/C][C]0.407533[/C][/ROW]
[ROW][C]20[/C][C]-0.131268[/C][C]-0.8608[/C][C]0.197067[/C][/ROW]
[ROW][C]21[/C][C]0.062773[/C][C]0.4116[/C][C]0.341329[/C][/ROW]
[ROW][C]22[/C][C]-0.133565[/C][C]-0.8758[/C][C]0.192991[/C][/ROW]
[ROW][C]23[/C][C]0.027286[/C][C]0.1789[/C][C]0.429418[/C][/ROW]
[ROW][C]24[/C][C]-0.040883[/C][C]-0.2681[/C][C]0.394958[/C][/ROW]
[ROW][C]25[/C][C]0.152652[/C][C]1.001[/C][C]0.161211[/C][/ROW]
[ROW][C]26[/C][C]-0.038019[/C][C]-0.2493[/C][C]0.402156[/C][/ROW]
[ROW][C]27[/C][C]-0.035607[/C][C]-0.2335[/C][C]0.408245[/C][/ROW]
[ROW][C]28[/C][C]0.060016[/C][C]0.3935[/C][C]0.347929[/C][/ROW]
[ROW][C]29[/C][C]-0.068611[/C][C]-0.4499[/C][C]0.327516[/C][/ROW]
[ROW][C]30[/C][C]-0.021948[/C][C]-0.1439[/C][C]0.443116[/C][/ROW]
[ROW][C]31[/C][C]-0.027677[/C][C]-0.1815[/C][C]0.428418[/C][/ROW]
[ROW][C]32[/C][C]-0.102413[/C][C]-0.6716[/C][C]0.252725[/C][/ROW]
[ROW][C]33[/C][C]-0.031195[/C][C]-0.2046[/C][C]0.41944[/C][/ROW]
[ROW][C]34[/C][C]-0.008081[/C][C]-0.053[/C][C]0.478992[/C][/ROW]
[ROW][C]35[/C][C]-0.029286[/C][C]-0.192[/C][C]0.424308[/C][/ROW]
[ROW][C]36[/C][C]-0.041083[/C][C]-0.2694[/C][C]0.394456[/C][/ROW]
[ROW][C]37[/C][C]-0.032284[/C][C]-0.2117[/C][C]0.416671[/C][/ROW]
[ROW][C]38[/C][C]-0.065257[/C][C]-0.4279[/C][C]0.335422[/C][/ROW]
[ROW][C]39[/C][C]-0.019327[/C][C]-0.1267[/C][C]0.449871[/C][/ROW]
[ROW][C]40[/C][C]0.067544[/C][C]0.4429[/C][C]0.330023[/C][/ROW]
[ROW][C]41[/C][C]-0.011961[/C][C]-0.0784[/C][C]0.468925[/C][/ROW]
[ROW][C]42[/C][C]0.011175[/C][C]0.0733[/C][C]0.470961[/C][/ROW]
[ROW][C]43[/C][C]NA[/C][C]NA[/C][C]NA[/C][/ROW]
[ROW][C]44[/C][C]NA[/C][C]NA[/C][C]NA[/C][/ROW]
[ROW][C]45[/C][C]NA[/C][C]NA[/C][C]NA[/C][/ROW]
[ROW][C]46[/C][C]NA[/C][C]NA[/C][C]NA[/C][/ROW]
[ROW][C]47[/C][C]NA[/C][C]NA[/C][C]NA[/C][/ROW]
[ROW][C]48[/C][C]NA[/C][C]NA[/C][C]NA[/C][/ROW]
[/TABLE]
Source: https://freestatistics.org/blog/index.php?pk=297105&T=2

Globally Unique Identifier (entire table): ba.freestatistics.org/blog/index.php?pk=297105&T=2

As an alternative you can also use a QR Code:  

The GUIDs for individual cells are displayed in the table below:

Partial Autocorrelation Function
Time lag kPACF(k)T-STATP-value
1-0.065649-0.43050.334495
2-0.603962-3.96040.000138
30.0773860.50750.307214
40.4664793.05890.001908
50.0745270.48870.313767
60.0551630.36170.359663
7-0.065286-0.42810.335354
8-0.061755-0.4050.343758
9-0.022674-0.14870.441249
100.1347440.88360.190919
11-0.161536-1.05930.147697
12-0.207613-1.36140.090238
13-0.141838-0.93010.178757
14-0.174284-1.14290.129711
150.1153760.75660.226716
160.0936980.61440.271089
17-0.14755-0.96760.16934
18-0.033213-0.21780.41431
190.0358880.23530.407533
20-0.131268-0.86080.197067
210.0627730.41160.341329
22-0.133565-0.87580.192991
230.0272860.17890.429418
24-0.040883-0.26810.394958
250.1526521.0010.161211
26-0.038019-0.24930.402156
27-0.035607-0.23350.408245
280.0600160.39350.347929
29-0.068611-0.44990.327516
30-0.021948-0.14390.443116
31-0.027677-0.18150.428418
32-0.102413-0.67160.252725
33-0.031195-0.20460.41944
34-0.008081-0.0530.478992
35-0.029286-0.1920.424308
36-0.041083-0.26940.394456
37-0.032284-0.21170.416671
38-0.065257-0.42790.335422
39-0.019327-0.12670.449871
400.0675440.44290.330023
41-0.011961-0.07840.468925
420.0111750.07330.470961
43NANANA
44NANANA
45NANANA
46NANANA
47NANANA
48NANANA


Parameters (Session):
par4 = 12 ;
Parameters (R input):
par1 = 48 ; par2 = 1 ; par3 = 1 ; par4 = 1 ; par5 = 12 ; par6 = White Noise ; par7 = 0.95 ; par8 = ;
R code (references can be found in the software module):
if (par1 == 'Default') {
par1 = 10*log10(length(x))
} else {
par1 <- as.numeric(par1)
}
par2 <- as.numeric(par2)
par3 <- as.numeric(par3)
par4 <- as.numeric(par4)
par5 <- as.numeric(par5)
if (par6 == 'White Noise') par6 <- 'white' else par6 <- 'ma'
par7 <- as.numeric(par7)
if (par8 != '') par8 <- as.numeric(par8)
x <- na.omit(x)
ox <- x
if (par8 == '') {
if (par2 == 0) {
x <- log(x)
} else {
x <- (x ^ par2 - 1) / par2
}
} else {
x <- log(x,base=par8)
}
if (par3 > 0) x <- diff(x,lag=1,difference=par3)
if (par4 > 0) x <- diff(x,lag=par5,difference=par4)
bitmap(file='picts.png')
op <- par(mfrow=c(2,1))
plot(ox,type='l',main='Original Time Series',xlab='time',ylab='value')
if (par8=='') {
mytitle <- paste('Working Time Series (lambda=',par2,', d=',par3,', D=',par4,')',sep='')
mysub <- paste('(lambda=',par2,', d=',par3,', D=',par4,', CI=', par7, ', CI type=',par6,')',sep='')
} else {
mytitle <- paste('Working Time Series (base=',par8,', d=',par3,', D=',par4,')',sep='')
mysub <- paste('(base=',par8,', d=',par3,', D=',par4,', CI=', par7, ', CI type=',par6,')',sep='')
}
plot(x,type='l', main=mytitle,xlab='time',ylab='value')
par(op)
dev.off()
bitmap(file='pic1.png')
racf <- acf(x, par1, main='Autocorrelation', xlab='time lag', ylab='ACF', ci.type=par6, ci=par7, sub=mysub)
dev.off()
bitmap(file='pic2.png')
rpacf <- pacf(x,par1,main='Partial Autocorrelation',xlab='lags',ylab='PACF',sub=mysub)
dev.off()
(myacf <- c(racf$acf))
(mypacf <- c(rpacf$acf))
lengthx <- length(x)
sqrtn <- sqrt(lengthx)
load(file='createtable')
a<-table.start()
a<-table.row.start(a)
a<-table.element(a,'Autocorrelation Function',4,TRUE)
a<-table.row.end(a)
a<-table.row.start(a)
a<-table.element(a,'Time lag k',header=TRUE)
a<-table.element(a,'ACF(k)',header=TRUE)
a<-table.element(a,'T-STAT',header=TRUE)
a<-table.element(a,'P-value',header=TRUE)
a<-table.row.end(a)
for (i in 2:(par1+1)) {
a<-table.row.start(a)
a<-table.element(a,i-1,header=TRUE)
a<-table.element(a,round(myacf[i],6))
mytstat <- myacf[i]*sqrtn
a<-table.element(a,round(mytstat,4))
a<-table.element(a,round(1-pt(abs(mytstat),lengthx),6))
a<-table.row.end(a)
}
a<-table.end(a)
table.save(a,file='mytable.tab')
a<-table.start()
a<-table.row.start(a)
a<-table.element(a,'Partial Autocorrelation Function',4,TRUE)
a<-table.row.end(a)
a<-table.row.start(a)
a<-table.element(a,'Time lag k',header=TRUE)
a<-table.element(a,'PACF(k)',header=TRUE)
a<-table.element(a,'T-STAT',header=TRUE)
a<-table.element(a,'P-value',header=TRUE)
a<-table.row.end(a)
for (i in 1:par1) {
a<-table.row.start(a)
a<-table.element(a,i,header=TRUE)
a<-table.element(a,round(mypacf[i],6))
mytstat <- mypacf[i]*sqrtn
a<-table.element(a,round(mytstat,4))
a<-table.element(a,round(1-pt(abs(mytstat),lengthx),6))
a<-table.row.end(a)
}
a<-table.end(a)
table.save(a,file='mytable1.tab')