Free Statistics

of Irreproducible Research!

Author's title

Author*Unverified author*
R Software Modulerwasp_exponentialsmoothing.wasp
Title produced by softwareExponential Smoothing
Date of computationFri, 25 Nov 2016 16:51:47 +0000
Cite this page as followsStatistical Computations at FreeStatistics.org, Office for Research Development and Education, URL https://freestatistics.org/blog/index.php?v=date/2016/Nov/25/t1480092778ejnxvekyj8cvny9.htm/, Retrieved Sun, 19 May 2024 05:02:49 +0200
Statistical Computations at FreeStatistics.org, Office for Research Development and Education, URL https://freestatistics.org/blog/index.php?pk=, Retrieved Sun, 19 May 2024 05:02:49 +0200
QR Codes:

Original text written by user:
IsPrivate?No (this computation is public)
User-defined keywords
Estimated Impact0
Dataseries X:
106
106,8
106,5
107,6
107,6
107,6
108,9
108,5
108,9
108,7
108,4
108,4
109,2
109,3
109,4
109,3
109
108,8
108,7
106,1
106,2
109,7
108,4
108,3
108,1
110,6
111,8
111,7
112,2
111,1
111
111
113,6
114
116,1
115,5
115,8
115,6
114,1
114,2
113,4
112
110,9
111
112,8
113,8
114,7
113,9
114,5
113,8
113,8
113,7
113
113,1
112,4
112,8
113,2
112,9
113,9
113,2


Summary of computational transaction
Raw Inputview raw input (R code)
Raw Outputview raw output of R engine
Computing time2 seconds
R Server'Sir Ronald Aylmer Fisher' @ fisher.wessa.net

\begin{tabular}{lllllllll}
\hline
Summary of computational transaction \tabularnewline
Raw Input & view raw input (R code)  \tabularnewline
Raw Output & view raw output of R engine  \tabularnewline
Computing time & 2 seconds \tabularnewline
R Server & 'Sir Ronald Aylmer Fisher' @ fisher.wessa.net \tabularnewline
\hline
\end{tabular}
%Source: https://freestatistics.org/blog/index.php?pk=&T=0

[TABLE]
[ROW][C]Summary of computational transaction[/C][/ROW]
[ROW][C]Raw Input[/C][C]view raw input (R code) [/C][/ROW]
[ROW][C]Raw Output[/C][C]view raw output of R engine [/C][/ROW]
[ROW][C]Computing time[/C][C]2 seconds[/C][/ROW]
[ROW][C]R Server[/C][C]'Sir Ronald Aylmer Fisher' @ fisher.wessa.net[/C][/ROW]
[/TABLE]
Source: https://freestatistics.org/blog/index.php?pk=&T=0

Globally Unique Identifier (entire table): ba.freestatistics.org/blog/index.php?pk=&T=0

As an alternative you can also use a QR Code:  

The GUIDs for individual cells are displayed in the table below:

Summary of computational transaction
Raw Inputview raw input (R code)
Raw Outputview raw output of R engine
Computing time2 seconds
R Server'Sir Ronald Aylmer Fisher' @ fisher.wessa.net


Estimated Parameters of Exponential Smoothing
ParameterValue
alpha0.995307053232911
betaFALSE
gammaFALSE

\begin{tabular}{lllllllll}
\hline
Estimated Parameters of Exponential Smoothing \tabularnewline
Parameter & Value \tabularnewline
alpha & 0.995307053232911 \tabularnewline
beta & FALSE \tabularnewline
gamma & FALSE \tabularnewline
\hline
\end{tabular}
%Source: https://freestatistics.org/blog/index.php?pk=&T=1

[TABLE]
[ROW][C]Estimated Parameters of Exponential Smoothing[/C][/ROW]
[ROW][C]Parameter[/C][C]Value[/C][/ROW]
[ROW][C]alpha[/C][C]0.995307053232911[/C][/ROW]
[ROW][C]beta[/C][C]FALSE[/C][/ROW]
[ROW][C]gamma[/C][C]FALSE[/C][/ROW]
[/TABLE]
Source: https://freestatistics.org/blog/index.php?pk=&T=1

Globally Unique Identifier (entire table): ba.freestatistics.org/blog/index.php?pk=&T=1

As an alternative you can also use a QR Code:  

The GUIDs for individual cells are displayed in the table below:

Estimated Parameters of Exponential Smoothing
ParameterValue
alpha0.995307053232911
betaFALSE
gammaFALSE


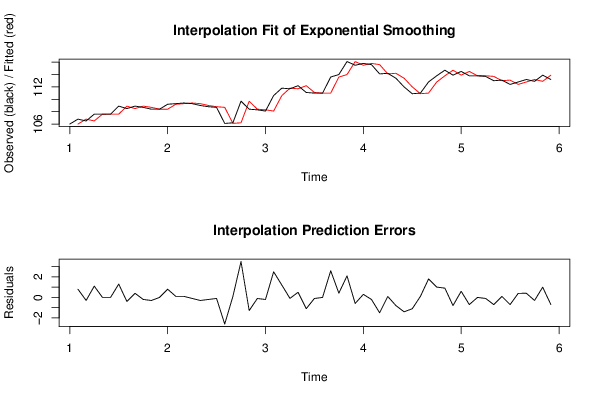
Interpolation Forecasts of Exponential Smoothing
tObservedFittedResiduals
2106.81060.799999999999997
3106.5106.796245642586-0.296245642586328
4107.6106.5013902650311.09860973496936
5107.6107.5948442829960.00515571700401551
6107.6107.5999758044952.41955054320897e-05
7108.9107.5999998864521.30000011354822
8108.5108.89389916867-0.393899168669918
9108.9108.501848547830.398151452169841
10108.7108.89813149643-0.198131496429724
11108.4108.700929820566-0.300929820565628
12108.4108.401412247629-0.00141224762853653
13109.2108.4000066276030.799993372397054
14109.3109.1962456736890.103754326310678
15109.4109.299513086470.100486913530233
16109.3109.399528420264-0.0995284202640221
17109109.300467081578-0.300467081578105
18108.8109.001410076019-0.201410076019116
19108.7108.800945206765-0.100945206765104
20106.1108.700473730482-2.60047373048175
21106.2106.1122038847860.0877961152136351
22109.7106.1995879775053.50041202249506
23108.4109.683572752716-1.28357275271556
24108.3108.4060237386-0.106023738600186
25108.1108.300497563761-0.200497563761303
26110.6108.1009409243942.49905907560634
27111.8110.588272048791.21172795120964
28111.7111.794313425229-0.0943134252287763
29112.2111.7004426078840.499557392115975
30111.1112.197655603752-1.0976556037517
31111111.105151239317-0.105151239316996
32111111.000493469169-0.000493469168603156
33113.6111.0000023158252.59999768417546
34114113.5877983492740.412201650726402
35116.1113.9980655595962.10193444040416
36115.5116.090135733563-0.590135733563272
37115.8115.5027694755830.297230524417031
38115.6115.798605112971-0.198605112971364
39114.1115.600932043223-1.50093204322285
40114.2114.107043794180.0929562058201441
41113.4114.199563761474-0.799563761474417
42112113.403752310169-1.40375231016949
43110.9112.006587734866-1.1065877348658
44111110.9051931573330.094806842667154
45112.8110.9995550765341.80044492346579
46113.8112.7915506078171.0084493921829
47114.7113.7952674006850.904732599314826
48113.9114.695754138073-0.795754138072965
49114.5113.903734431810.596265568190319
50113.8114.497201757429-0.69720175742944
51113.8113.803271930734-0.00327193073353271
52113.7113.800015354997-0.100015354996756
53113113.700469366737-0.700469366736897
54113.1113.003287265450.096712734549925
55112.4113.099546132285-0.69954613228505
56112.8112.403282932760.396717067240047
57113.2112.7981382279220.401861772078149
58112.9113.198114084096-0.298114084095914
59113.9112.9013990335270.998600966472821
60113.2113.895313618823-0.69531361882278

\begin{tabular}{lllllllll}
\hline
Interpolation Forecasts of Exponential Smoothing \tabularnewline
t & Observed & Fitted & Residuals \tabularnewline
2 & 106.8 & 106 & 0.799999999999997 \tabularnewline
3 & 106.5 & 106.796245642586 & -0.296245642586328 \tabularnewline
4 & 107.6 & 106.501390265031 & 1.09860973496936 \tabularnewline
5 & 107.6 & 107.594844282996 & 0.00515571700401551 \tabularnewline
6 & 107.6 & 107.599975804495 & 2.41955054320897e-05 \tabularnewline
7 & 108.9 & 107.599999886452 & 1.30000011354822 \tabularnewline
8 & 108.5 & 108.89389916867 & -0.393899168669918 \tabularnewline
9 & 108.9 & 108.50184854783 & 0.398151452169841 \tabularnewline
10 & 108.7 & 108.89813149643 & -0.198131496429724 \tabularnewline
11 & 108.4 & 108.700929820566 & -0.300929820565628 \tabularnewline
12 & 108.4 & 108.401412247629 & -0.00141224762853653 \tabularnewline
13 & 109.2 & 108.400006627603 & 0.799993372397054 \tabularnewline
14 & 109.3 & 109.196245673689 & 0.103754326310678 \tabularnewline
15 & 109.4 & 109.29951308647 & 0.100486913530233 \tabularnewline
16 & 109.3 & 109.399528420264 & -0.0995284202640221 \tabularnewline
17 & 109 & 109.300467081578 & -0.300467081578105 \tabularnewline
18 & 108.8 & 109.001410076019 & -0.201410076019116 \tabularnewline
19 & 108.7 & 108.800945206765 & -0.100945206765104 \tabularnewline
20 & 106.1 & 108.700473730482 & -2.60047373048175 \tabularnewline
21 & 106.2 & 106.112203884786 & 0.0877961152136351 \tabularnewline
22 & 109.7 & 106.199587977505 & 3.50041202249506 \tabularnewline
23 & 108.4 & 109.683572752716 & -1.28357275271556 \tabularnewline
24 & 108.3 & 108.4060237386 & -0.106023738600186 \tabularnewline
25 & 108.1 & 108.300497563761 & -0.200497563761303 \tabularnewline
26 & 110.6 & 108.100940924394 & 2.49905907560634 \tabularnewline
27 & 111.8 & 110.58827204879 & 1.21172795120964 \tabularnewline
28 & 111.7 & 111.794313425229 & -0.0943134252287763 \tabularnewline
29 & 112.2 & 111.700442607884 & 0.499557392115975 \tabularnewline
30 & 111.1 & 112.197655603752 & -1.0976556037517 \tabularnewline
31 & 111 & 111.105151239317 & -0.105151239316996 \tabularnewline
32 & 111 & 111.000493469169 & -0.000493469168603156 \tabularnewline
33 & 113.6 & 111.000002315825 & 2.59999768417546 \tabularnewline
34 & 114 & 113.587798349274 & 0.412201650726402 \tabularnewline
35 & 116.1 & 113.998065559596 & 2.10193444040416 \tabularnewline
36 & 115.5 & 116.090135733563 & -0.590135733563272 \tabularnewline
37 & 115.8 & 115.502769475583 & 0.297230524417031 \tabularnewline
38 & 115.6 & 115.798605112971 & -0.198605112971364 \tabularnewline
39 & 114.1 & 115.600932043223 & -1.50093204322285 \tabularnewline
40 & 114.2 & 114.10704379418 & 0.0929562058201441 \tabularnewline
41 & 113.4 & 114.199563761474 & -0.799563761474417 \tabularnewline
42 & 112 & 113.403752310169 & -1.40375231016949 \tabularnewline
43 & 110.9 & 112.006587734866 & -1.1065877348658 \tabularnewline
44 & 111 & 110.905193157333 & 0.094806842667154 \tabularnewline
45 & 112.8 & 110.999555076534 & 1.80044492346579 \tabularnewline
46 & 113.8 & 112.791550607817 & 1.0084493921829 \tabularnewline
47 & 114.7 & 113.795267400685 & 0.904732599314826 \tabularnewline
48 & 113.9 & 114.695754138073 & -0.795754138072965 \tabularnewline
49 & 114.5 & 113.90373443181 & 0.596265568190319 \tabularnewline
50 & 113.8 & 114.497201757429 & -0.69720175742944 \tabularnewline
51 & 113.8 & 113.803271930734 & -0.00327193073353271 \tabularnewline
52 & 113.7 & 113.800015354997 & -0.100015354996756 \tabularnewline
53 & 113 & 113.700469366737 & -0.700469366736897 \tabularnewline
54 & 113.1 & 113.00328726545 & 0.096712734549925 \tabularnewline
55 & 112.4 & 113.099546132285 & -0.69954613228505 \tabularnewline
56 & 112.8 & 112.40328293276 & 0.396717067240047 \tabularnewline
57 & 113.2 & 112.798138227922 & 0.401861772078149 \tabularnewline
58 & 112.9 & 113.198114084096 & -0.298114084095914 \tabularnewline
59 & 113.9 & 112.901399033527 & 0.998600966472821 \tabularnewline
60 & 113.2 & 113.895313618823 & -0.69531361882278 \tabularnewline
\hline
\end{tabular}
%Source: https://freestatistics.org/blog/index.php?pk=&T=2

[TABLE]
[ROW][C]Interpolation Forecasts of Exponential Smoothing[/C][/ROW]
[ROW][C]t[/C][C]Observed[/C][C]Fitted[/C][C]Residuals[/C][/ROW]
[ROW][C]2[/C][C]106.8[/C][C]106[/C][C]0.799999999999997[/C][/ROW]
[ROW][C]3[/C][C]106.5[/C][C]106.796245642586[/C][C]-0.296245642586328[/C][/ROW]
[ROW][C]4[/C][C]107.6[/C][C]106.501390265031[/C][C]1.09860973496936[/C][/ROW]
[ROW][C]5[/C][C]107.6[/C][C]107.594844282996[/C][C]0.00515571700401551[/C][/ROW]
[ROW][C]6[/C][C]107.6[/C][C]107.599975804495[/C][C]2.41955054320897e-05[/C][/ROW]
[ROW][C]7[/C][C]108.9[/C][C]107.599999886452[/C][C]1.30000011354822[/C][/ROW]
[ROW][C]8[/C][C]108.5[/C][C]108.89389916867[/C][C]-0.393899168669918[/C][/ROW]
[ROW][C]9[/C][C]108.9[/C][C]108.50184854783[/C][C]0.398151452169841[/C][/ROW]
[ROW][C]10[/C][C]108.7[/C][C]108.89813149643[/C][C]-0.198131496429724[/C][/ROW]
[ROW][C]11[/C][C]108.4[/C][C]108.700929820566[/C][C]-0.300929820565628[/C][/ROW]
[ROW][C]12[/C][C]108.4[/C][C]108.401412247629[/C][C]-0.00141224762853653[/C][/ROW]
[ROW][C]13[/C][C]109.2[/C][C]108.400006627603[/C][C]0.799993372397054[/C][/ROW]
[ROW][C]14[/C][C]109.3[/C][C]109.196245673689[/C][C]0.103754326310678[/C][/ROW]
[ROW][C]15[/C][C]109.4[/C][C]109.29951308647[/C][C]0.100486913530233[/C][/ROW]
[ROW][C]16[/C][C]109.3[/C][C]109.399528420264[/C][C]-0.0995284202640221[/C][/ROW]
[ROW][C]17[/C][C]109[/C][C]109.300467081578[/C][C]-0.300467081578105[/C][/ROW]
[ROW][C]18[/C][C]108.8[/C][C]109.001410076019[/C][C]-0.201410076019116[/C][/ROW]
[ROW][C]19[/C][C]108.7[/C][C]108.800945206765[/C][C]-0.100945206765104[/C][/ROW]
[ROW][C]20[/C][C]106.1[/C][C]108.700473730482[/C][C]-2.60047373048175[/C][/ROW]
[ROW][C]21[/C][C]106.2[/C][C]106.112203884786[/C][C]0.0877961152136351[/C][/ROW]
[ROW][C]22[/C][C]109.7[/C][C]106.199587977505[/C][C]3.50041202249506[/C][/ROW]
[ROW][C]23[/C][C]108.4[/C][C]109.683572752716[/C][C]-1.28357275271556[/C][/ROW]
[ROW][C]24[/C][C]108.3[/C][C]108.4060237386[/C][C]-0.106023738600186[/C][/ROW]
[ROW][C]25[/C][C]108.1[/C][C]108.300497563761[/C][C]-0.200497563761303[/C][/ROW]
[ROW][C]26[/C][C]110.6[/C][C]108.100940924394[/C][C]2.49905907560634[/C][/ROW]
[ROW][C]27[/C][C]111.8[/C][C]110.58827204879[/C][C]1.21172795120964[/C][/ROW]
[ROW][C]28[/C][C]111.7[/C][C]111.794313425229[/C][C]-0.0943134252287763[/C][/ROW]
[ROW][C]29[/C][C]112.2[/C][C]111.700442607884[/C][C]0.499557392115975[/C][/ROW]
[ROW][C]30[/C][C]111.1[/C][C]112.197655603752[/C][C]-1.0976556037517[/C][/ROW]
[ROW][C]31[/C][C]111[/C][C]111.105151239317[/C][C]-0.105151239316996[/C][/ROW]
[ROW][C]32[/C][C]111[/C][C]111.000493469169[/C][C]-0.000493469168603156[/C][/ROW]
[ROW][C]33[/C][C]113.6[/C][C]111.000002315825[/C][C]2.59999768417546[/C][/ROW]
[ROW][C]34[/C][C]114[/C][C]113.587798349274[/C][C]0.412201650726402[/C][/ROW]
[ROW][C]35[/C][C]116.1[/C][C]113.998065559596[/C][C]2.10193444040416[/C][/ROW]
[ROW][C]36[/C][C]115.5[/C][C]116.090135733563[/C][C]-0.590135733563272[/C][/ROW]
[ROW][C]37[/C][C]115.8[/C][C]115.502769475583[/C][C]0.297230524417031[/C][/ROW]
[ROW][C]38[/C][C]115.6[/C][C]115.798605112971[/C][C]-0.198605112971364[/C][/ROW]
[ROW][C]39[/C][C]114.1[/C][C]115.600932043223[/C][C]-1.50093204322285[/C][/ROW]
[ROW][C]40[/C][C]114.2[/C][C]114.10704379418[/C][C]0.0929562058201441[/C][/ROW]
[ROW][C]41[/C][C]113.4[/C][C]114.199563761474[/C][C]-0.799563761474417[/C][/ROW]
[ROW][C]42[/C][C]112[/C][C]113.403752310169[/C][C]-1.40375231016949[/C][/ROW]
[ROW][C]43[/C][C]110.9[/C][C]112.006587734866[/C][C]-1.1065877348658[/C][/ROW]
[ROW][C]44[/C][C]111[/C][C]110.905193157333[/C][C]0.094806842667154[/C][/ROW]
[ROW][C]45[/C][C]112.8[/C][C]110.999555076534[/C][C]1.80044492346579[/C][/ROW]
[ROW][C]46[/C][C]113.8[/C][C]112.791550607817[/C][C]1.0084493921829[/C][/ROW]
[ROW][C]47[/C][C]114.7[/C][C]113.795267400685[/C][C]0.904732599314826[/C][/ROW]
[ROW][C]48[/C][C]113.9[/C][C]114.695754138073[/C][C]-0.795754138072965[/C][/ROW]
[ROW][C]49[/C][C]114.5[/C][C]113.90373443181[/C][C]0.596265568190319[/C][/ROW]
[ROW][C]50[/C][C]113.8[/C][C]114.497201757429[/C][C]-0.69720175742944[/C][/ROW]
[ROW][C]51[/C][C]113.8[/C][C]113.803271930734[/C][C]-0.00327193073353271[/C][/ROW]
[ROW][C]52[/C][C]113.7[/C][C]113.800015354997[/C][C]-0.100015354996756[/C][/ROW]
[ROW][C]53[/C][C]113[/C][C]113.700469366737[/C][C]-0.700469366736897[/C][/ROW]
[ROW][C]54[/C][C]113.1[/C][C]113.00328726545[/C][C]0.096712734549925[/C][/ROW]
[ROW][C]55[/C][C]112.4[/C][C]113.099546132285[/C][C]-0.69954613228505[/C][/ROW]
[ROW][C]56[/C][C]112.8[/C][C]112.40328293276[/C][C]0.396717067240047[/C][/ROW]
[ROW][C]57[/C][C]113.2[/C][C]112.798138227922[/C][C]0.401861772078149[/C][/ROW]
[ROW][C]58[/C][C]112.9[/C][C]113.198114084096[/C][C]-0.298114084095914[/C][/ROW]
[ROW][C]59[/C][C]113.9[/C][C]112.901399033527[/C][C]0.998600966472821[/C][/ROW]
[ROW][C]60[/C][C]113.2[/C][C]113.895313618823[/C][C]-0.69531361882278[/C][/ROW]
[/TABLE]
Source: https://freestatistics.org/blog/index.php?pk=&T=2

Globally Unique Identifier (entire table): ba.freestatistics.org/blog/index.php?pk=&T=2

As an alternative you can also use a QR Code:  

The GUIDs for individual cells are displayed in the table below:

Interpolation Forecasts of Exponential Smoothing
tObservedFittedResiduals
2106.81060.799999999999997
3106.5106.796245642586-0.296245642586328
4107.6106.5013902650311.09860973496936
5107.6107.5948442829960.00515571700401551
6107.6107.5999758044952.41955054320897e-05
7108.9107.5999998864521.30000011354822
8108.5108.89389916867-0.393899168669918
9108.9108.501848547830.398151452169841
10108.7108.89813149643-0.198131496429724
11108.4108.700929820566-0.300929820565628
12108.4108.401412247629-0.00141224762853653
13109.2108.4000066276030.799993372397054
14109.3109.1962456736890.103754326310678
15109.4109.299513086470.100486913530233
16109.3109.399528420264-0.0995284202640221
17109109.300467081578-0.300467081578105
18108.8109.001410076019-0.201410076019116
19108.7108.800945206765-0.100945206765104
20106.1108.700473730482-2.60047373048175
21106.2106.1122038847860.0877961152136351
22109.7106.1995879775053.50041202249506
23108.4109.683572752716-1.28357275271556
24108.3108.4060237386-0.106023738600186
25108.1108.300497563761-0.200497563761303
26110.6108.1009409243942.49905907560634
27111.8110.588272048791.21172795120964
28111.7111.794313425229-0.0943134252287763
29112.2111.7004426078840.499557392115975
30111.1112.197655603752-1.0976556037517
31111111.105151239317-0.105151239316996
32111111.000493469169-0.000493469168603156
33113.6111.0000023158252.59999768417546
34114113.5877983492740.412201650726402
35116.1113.9980655595962.10193444040416
36115.5116.090135733563-0.590135733563272
37115.8115.5027694755830.297230524417031
38115.6115.798605112971-0.198605112971364
39114.1115.600932043223-1.50093204322285
40114.2114.107043794180.0929562058201441
41113.4114.199563761474-0.799563761474417
42112113.403752310169-1.40375231016949
43110.9112.006587734866-1.1065877348658
44111110.9051931573330.094806842667154
45112.8110.9995550765341.80044492346579
46113.8112.7915506078171.0084493921829
47114.7113.7952674006850.904732599314826
48113.9114.695754138073-0.795754138072965
49114.5113.903734431810.596265568190319
50113.8114.497201757429-0.69720175742944
51113.8113.803271930734-0.00327193073353271
52113.7113.800015354997-0.100015354996756
53113113.700469366737-0.700469366736897
54113.1113.003287265450.096712734549925
55112.4113.099546132285-0.69954613228505
56112.8112.403282932760.396717067240047
57113.2112.7981382279220.401861772078149
58112.9113.198114084096-0.298114084095914
59113.9112.9013990335270.998600966472821
60113.2113.895313618823-0.69531361882278


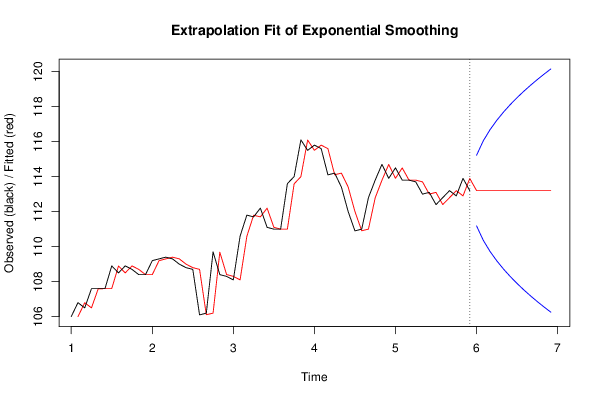
Extrapolation Forecasts of Exponential Smoothing
tForecast95% Lower Bound95% Upper Bound
61113.2032630698111.188791276351115.217734863248
62113.2032630698110.361046729511116.045479410088
63113.2032630698109.725003326278116.681522813321
64113.2032630698109.188491848198117.218034291402
65113.2032630698108.71567072198117.690855417619
66113.2032630698108.288125004739118.11840113486
67113.2032630698107.894903688879118.51162245072
68113.2032630698107.528866499643118.877659639957
69113.2032630698107.185051246192119.221474893407
70113.2032630698106.85984359193119.546682547669
71113.2032630698106.550514180009119.85601195959
72113.2032630698106.254942056129120.15158408347

\begin{tabular}{lllllllll}
\hline
Extrapolation Forecasts of Exponential Smoothing \tabularnewline
t & Forecast & 95% Lower Bound & 95% Upper Bound \tabularnewline
61 & 113.2032630698 & 111.188791276351 & 115.217734863248 \tabularnewline
62 & 113.2032630698 & 110.361046729511 & 116.045479410088 \tabularnewline
63 & 113.2032630698 & 109.725003326278 & 116.681522813321 \tabularnewline
64 & 113.2032630698 & 109.188491848198 & 117.218034291402 \tabularnewline
65 & 113.2032630698 & 108.71567072198 & 117.690855417619 \tabularnewline
66 & 113.2032630698 & 108.288125004739 & 118.11840113486 \tabularnewline
67 & 113.2032630698 & 107.894903688879 & 118.51162245072 \tabularnewline
68 & 113.2032630698 & 107.528866499643 & 118.877659639957 \tabularnewline
69 & 113.2032630698 & 107.185051246192 & 119.221474893407 \tabularnewline
70 & 113.2032630698 & 106.85984359193 & 119.546682547669 \tabularnewline
71 & 113.2032630698 & 106.550514180009 & 119.85601195959 \tabularnewline
72 & 113.2032630698 & 106.254942056129 & 120.15158408347 \tabularnewline
\hline
\end{tabular}
%Source: https://freestatistics.org/blog/index.php?pk=&T=3

[TABLE]
[ROW][C]Extrapolation Forecasts of Exponential Smoothing[/C][/ROW]
[ROW][C]t[/C][C]Forecast[/C][C]95% Lower Bound[/C][C]95% Upper Bound[/C][/ROW]
[ROW][C]61[/C][C]113.2032630698[/C][C]111.188791276351[/C][C]115.217734863248[/C][/ROW]
[ROW][C]62[/C][C]113.2032630698[/C][C]110.361046729511[/C][C]116.045479410088[/C][/ROW]
[ROW][C]63[/C][C]113.2032630698[/C][C]109.725003326278[/C][C]116.681522813321[/C][/ROW]
[ROW][C]64[/C][C]113.2032630698[/C][C]109.188491848198[/C][C]117.218034291402[/C][/ROW]
[ROW][C]65[/C][C]113.2032630698[/C][C]108.71567072198[/C][C]117.690855417619[/C][/ROW]
[ROW][C]66[/C][C]113.2032630698[/C][C]108.288125004739[/C][C]118.11840113486[/C][/ROW]
[ROW][C]67[/C][C]113.2032630698[/C][C]107.894903688879[/C][C]118.51162245072[/C][/ROW]
[ROW][C]68[/C][C]113.2032630698[/C][C]107.528866499643[/C][C]118.877659639957[/C][/ROW]
[ROW][C]69[/C][C]113.2032630698[/C][C]107.185051246192[/C][C]119.221474893407[/C][/ROW]
[ROW][C]70[/C][C]113.2032630698[/C][C]106.85984359193[/C][C]119.546682547669[/C][/ROW]
[ROW][C]71[/C][C]113.2032630698[/C][C]106.550514180009[/C][C]119.85601195959[/C][/ROW]
[ROW][C]72[/C][C]113.2032630698[/C][C]106.254942056129[/C][C]120.15158408347[/C][/ROW]
[/TABLE]
Source: https://freestatistics.org/blog/index.php?pk=&T=3

Globally Unique Identifier (entire table): ba.freestatistics.org/blog/index.php?pk=&T=3

As an alternative you can also use a QR Code:  

The GUIDs for individual cells are displayed in the table below:

Extrapolation Forecasts of Exponential Smoothing
tForecast95% Lower Bound95% Upper Bound
61113.2032630698111.188791276351115.217734863248
62113.2032630698110.361046729511116.045479410088
63113.2032630698109.725003326278116.681522813321
64113.2032630698109.188491848198117.218034291402
65113.2032630698108.71567072198117.690855417619
66113.2032630698108.288125004739118.11840113486
67113.2032630698107.894903688879118.51162245072
68113.2032630698107.528866499643118.877659639957
69113.2032630698107.185051246192119.221474893407
70113.2032630698106.85984359193119.546682547669
71113.2032630698106.550514180009119.85601195959
72113.2032630698106.254942056129120.15158408347


Parameters (Session):
par1 = 12 ; par2 = Single ; par3 = additive ;
Parameters (R input):
par1 = 12 ; par2 = Single ; par3 = additive ;
R code (references can be found in the software module):
par1 <- as.numeric(par1)
if (par2 == 'Single') K <- 1
if (par2 == 'Double') K <- 2
if (par2 == 'Triple') K <- par1
nx <- length(x)
nxmK <- nx - K
x <- ts(x, frequency = par1)
if (par2 == 'Single') fit <- HoltWinters(x, gamma=F, beta=F)
if (par2 == 'Double') fit <- HoltWinters(x, gamma=F)
if (par2 == 'Triple') fit <- HoltWinters(x, seasonal=par3)
fit
myresid <- x - fit$fitted[,'xhat']
bitmap(file='test1.png')
op <- par(mfrow=c(2,1))
plot(fit,ylab='Observed (black) / Fitted (red)',main='Interpolation Fit of Exponential Smoothing')
plot(myresid,ylab='Residuals',main='Interpolation Prediction Errors')
par(op)
dev.off()
bitmap(file='test2.png')
p <- predict(fit, par1, prediction.interval=TRUE)
np <- length(p[,1])
plot(fit,p,ylab='Observed (black) / Fitted (red)',main='Extrapolation Fit of Exponential Smoothing')
dev.off()
bitmap(file='test3.png')
op <- par(mfrow = c(2,2))
acf(as.numeric(myresid),lag.max = nx/2,main='Residual ACF')
spectrum(myresid,main='Residals Periodogram')
cpgram(myresid,main='Residal Cumulative Periodogram')
qqnorm(myresid,main='Residual Normal QQ Plot')
qqline(myresid)
par(op)
dev.off()
load(file='createtable')
a<-table.start()
a<-table.row.start(a)
a<-table.element(a,'Estimated Parameters of Exponential Smoothing',2,TRUE)
a<-table.row.end(a)
a<-table.row.start(a)
a<-table.element(a,'Parameter',header=TRUE)
a<-table.element(a,'Value',header=TRUE)
a<-table.row.end(a)
a<-table.row.start(a)
a<-table.element(a,'alpha',header=TRUE)
a<-table.element(a,fit$alpha)
a<-table.row.end(a)
a<-table.row.start(a)
a<-table.element(a,'beta',header=TRUE)
a<-table.element(a,fit$beta)
a<-table.row.end(a)
a<-table.row.start(a)
a<-table.element(a,'gamma',header=TRUE)
a<-table.element(a,fit$gamma)
a<-table.row.end(a)
a<-table.end(a)
table.save(a,file='mytable.tab')
a<-table.start()
a<-table.row.start(a)
a<-table.element(a,'Interpolation Forecasts of Exponential Smoothing',4,TRUE)
a<-table.row.end(a)
a<-table.row.start(a)
a<-table.element(a,'t',header=TRUE)
a<-table.element(a,'Observed',header=TRUE)
a<-table.element(a,'Fitted',header=TRUE)
a<-table.element(a,'Residuals',header=TRUE)
a<-table.row.end(a)
for (i in 1:nxmK) {
a<-table.row.start(a)
a<-table.element(a,i+K,header=TRUE)
a<-table.element(a,x[i+K])
a<-table.element(a,fit$fitted[i,'xhat'])
a<-table.element(a,myresid[i])
a<-table.row.end(a)
}
a<-table.end(a)
table.save(a,file='mytable1.tab')
a<-table.start()
a<-table.row.start(a)
a<-table.element(a,'Extrapolation Forecasts of Exponential Smoothing',4,TRUE)
a<-table.row.end(a)
a<-table.row.start(a)
a<-table.element(a,'t',header=TRUE)
a<-table.element(a,'Forecast',header=TRUE)
a<-table.element(a,'95% Lower Bound',header=TRUE)
a<-table.element(a,'95% Upper Bound',header=TRUE)
a<-table.row.end(a)
for (i in 1:np) {
a<-table.row.start(a)
a<-table.element(a,nx+i,header=TRUE)
a<-table.element(a,p[i,'fit'])
a<-table.element(a,p[i,'lwr'])
a<-table.element(a,p[i,'upr'])
a<-table.row.end(a)
}
a<-table.end(a)
table.save(a,file='mytable2.tab')