Free Statistics

of Irreproducible Research!

Author's title

Author*Unverified author*
R Software Modulerwasp_exponentialsmoothing.wasp
Title produced by softwareExponential Smoothing
Date of computationFri, 25 Nov 2016 15:30:15 +0000
Cite this page as followsStatistical Computations at FreeStatistics.org, Office for Research Development and Education, URL https://freestatistics.org/blog/index.php?v=date/2016/Nov/25/t1480087832pkggz9ovgwj8sqq.htm/, Retrieved Sun, 19 May 2024 01:40:48 +0200
Statistical Computations at FreeStatistics.org, Office for Research Development and Education, URL https://freestatistics.org/blog/index.php?pk=, Retrieved Sun, 19 May 2024 01:40:48 +0200
QR Codes:

Original text written by user:
IsPrivate?No (this computation is public)
User-defined keywords
Estimated Impact0
Dataseries X:
149
143
135
126
119
133
134
123
147
144
150
140
165
173
167
161
151
163
158
152
176
170
168
164
185
186
184
179
171
187
191
176
204
196
193
179
195
201
192
181
171
177
176
155
173
167
164
152
173
162
158
154
151
160
160
143
170
166
153
144


Summary of computational transaction
Raw Inputview raw input (R code)
Raw Outputview raw output of R engine
Computing time1 seconds
R Server'George Udny Yule' @ yule.wessa.net

\begin{tabular}{lllllllll}
\hline
Summary of computational transaction \tabularnewline
Raw Input & view raw input (R code)  \tabularnewline
Raw Output & view raw output of R engine  \tabularnewline
Computing time & 1 seconds \tabularnewline
R Server & 'George Udny Yule' @ yule.wessa.net \tabularnewline
\hline
\end{tabular}
%Source: https://freestatistics.org/blog/index.php?pk=&T=0

[TABLE]
[ROW][C]Summary of computational transaction[/C][/ROW]
[ROW][C]Raw Input[/C][C]view raw input (R code) [/C][/ROW]
[ROW][C]Raw Output[/C][C]view raw output of R engine [/C][/ROW]
[ROW][C]Computing time[/C][C]1 seconds[/C][/ROW]
[ROW][C]R Server[/C][C]'George Udny Yule' @ yule.wessa.net[/C][/ROW]
[/TABLE]
Source: https://freestatistics.org/blog/index.php?pk=&T=0

Globally Unique Identifier (entire table): ba.freestatistics.org/blog/index.php?pk=&T=0

As an alternative you can also use a QR Code:  

The GUIDs for individual cells are displayed in the table below:

Summary of computational transaction
Raw Inputview raw input (R code)
Raw Outputview raw output of R engine
Computing time1 seconds
R Server'George Udny Yule' @ yule.wessa.net


Estimated Parameters of Exponential Smoothing
ParameterValue
alpha0.527846679069132
beta0.198106617152047
gammaFALSE

\begin{tabular}{lllllllll}
\hline
Estimated Parameters of Exponential Smoothing \tabularnewline
Parameter & Value \tabularnewline
alpha & 0.527846679069132 \tabularnewline
beta & 0.198106617152047 \tabularnewline
gamma & FALSE \tabularnewline
\hline
\end{tabular}
%Source: https://freestatistics.org/blog/index.php?pk=&T=1

[TABLE]
[ROW][C]Estimated Parameters of Exponential Smoothing[/C][/ROW]
[ROW][C]Parameter[/C][C]Value[/C][/ROW]
[ROW][C]alpha[/C][C]0.527846679069132[/C][/ROW]
[ROW][C]beta[/C][C]0.198106617152047[/C][/ROW]
[ROW][C]gamma[/C][C]FALSE[/C][/ROW]
[/TABLE]
Source: https://freestatistics.org/blog/index.php?pk=&T=1

Globally Unique Identifier (entire table): ba.freestatistics.org/blog/index.php?pk=&T=1

As an alternative you can also use a QR Code:  

The GUIDs for individual cells are displayed in the table below:

Estimated Parameters of Exponential Smoothing
ParameterValue
alpha0.527846679069132
beta0.198106617152047
gammaFALSE


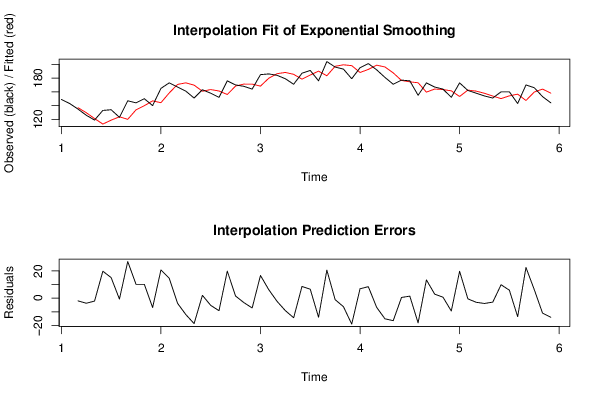
Interpolation Forecasts of Exponential Smoothing
tObservedFittedResiduals
3135137-2
4126129.735166801931-3.73516680193109
5119121.163845476297-2.16384547629673
6133113.19566774587519.8043322541247
7134118.89425711443815.1057428855621
8123123.692318013055-0.6923180130552
9147120.0790292913926.9209707086103
10144133.85644707202110.1435529279792
11150139.83867111163310.1613288883668
12140146.892847481501-6.89284748150135
13165144.22424898080120.7757510191985
14173158.3329469344914.6670530655096
15167170.750921525076-3.75092152507582
16161173.054795829168-12.0547958291676
17151169.714928623383-18.7149286233827
18163160.9025138517082.09748614829206
19158163.295197059326-5.29519705932634
20152161.231958653699-9.23195865369885
21176156.12532853665419.8746714633456
22170168.4608292700451.53917072995532
23168171.27894779229-3.27894779228967
24164171.210959144996-7.21095914499594
25185168.31342194244916.6865780575514
26186179.775034522176.22496547782973
27184186.365463785782-2.36546378578157
28179188.174107132057-9.17410713205732
29171185.429495050483-14.4294950504827
30187178.4019527663788.59804723362191
31191184.428519315146.57148068485989
32176190.072548650495-14.072548650495
33204183.34813037248720.6518696275134
34196197.112445319216-1.11244531921588
35193199.272210581103-6.27221058110322
36179198.052526326255-19.0525263262554
37195188.09447369486.90552630519974
38201192.5604032730148.43959672698634
39192198.718614783106-6.71861478310589
40181196.173049676821-15.1730496768212
41171187.578194598148-16.5781945981475
42177176.5080579568430.491942043156968
43176174.4997785929881.50022140701211
44155173.180594175379-18.1805941753791
45173159.57181333339213.4281866666084
46167164.0518068932782.94819310672199
47164163.3082629731250.691737026875302
48152161.445991090296-9.44599109029636
49173153.24478655520819.7552134447923
50162162.523141947604-0.523141947603989
51158161.042929877549-3.0429298775488
52154157.914457182958-3.91445718295839
53151153.91661722016-2.91661722015976
54160150.1404933386859.85950666131473
55160154.1392118418945.86078815810575
56143156.640082211279-13.6400822112789
57170147.42114061207222.5788593879277
58166159.681316574516.31868342549026
59153164.019356874185-11.0193568741846
60144158.053276913706-14.0532769137064

\begin{tabular}{lllllllll}
\hline
Interpolation Forecasts of Exponential Smoothing \tabularnewline
t & Observed & Fitted & Residuals \tabularnewline
3 & 135 & 137 & -2 \tabularnewline
4 & 126 & 129.735166801931 & -3.73516680193109 \tabularnewline
5 & 119 & 121.163845476297 & -2.16384547629673 \tabularnewline
6 & 133 & 113.195667745875 & 19.8043322541247 \tabularnewline
7 & 134 & 118.894257114438 & 15.1057428855621 \tabularnewline
8 & 123 & 123.692318013055 & -0.6923180130552 \tabularnewline
9 & 147 & 120.07902929139 & 26.9209707086103 \tabularnewline
10 & 144 & 133.856447072021 & 10.1435529279792 \tabularnewline
11 & 150 & 139.838671111633 & 10.1613288883668 \tabularnewline
12 & 140 & 146.892847481501 & -6.89284748150135 \tabularnewline
13 & 165 & 144.224248980801 & 20.7757510191985 \tabularnewline
14 & 173 & 158.33294693449 & 14.6670530655096 \tabularnewline
15 & 167 & 170.750921525076 & -3.75092152507582 \tabularnewline
16 & 161 & 173.054795829168 & -12.0547958291676 \tabularnewline
17 & 151 & 169.714928623383 & -18.7149286233827 \tabularnewline
18 & 163 & 160.902513851708 & 2.09748614829206 \tabularnewline
19 & 158 & 163.295197059326 & -5.29519705932634 \tabularnewline
20 & 152 & 161.231958653699 & -9.23195865369885 \tabularnewline
21 & 176 & 156.125328536654 & 19.8746714633456 \tabularnewline
22 & 170 & 168.460829270045 & 1.53917072995532 \tabularnewline
23 & 168 & 171.27894779229 & -3.27894779228967 \tabularnewline
24 & 164 & 171.210959144996 & -7.21095914499594 \tabularnewline
25 & 185 & 168.313421942449 & 16.6865780575514 \tabularnewline
26 & 186 & 179.77503452217 & 6.22496547782973 \tabularnewline
27 & 184 & 186.365463785782 & -2.36546378578157 \tabularnewline
28 & 179 & 188.174107132057 & -9.17410713205732 \tabularnewline
29 & 171 & 185.429495050483 & -14.4294950504827 \tabularnewline
30 & 187 & 178.401952766378 & 8.59804723362191 \tabularnewline
31 & 191 & 184.42851931514 & 6.57148068485989 \tabularnewline
32 & 176 & 190.072548650495 & -14.072548650495 \tabularnewline
33 & 204 & 183.348130372487 & 20.6518696275134 \tabularnewline
34 & 196 & 197.112445319216 & -1.11244531921588 \tabularnewline
35 & 193 & 199.272210581103 & -6.27221058110322 \tabularnewline
36 & 179 & 198.052526326255 & -19.0525263262554 \tabularnewline
37 & 195 & 188.0944736948 & 6.90552630519974 \tabularnewline
38 & 201 & 192.560403273014 & 8.43959672698634 \tabularnewline
39 & 192 & 198.718614783106 & -6.71861478310589 \tabularnewline
40 & 181 & 196.173049676821 & -15.1730496768212 \tabularnewline
41 & 171 & 187.578194598148 & -16.5781945981475 \tabularnewline
42 & 177 & 176.508057956843 & 0.491942043156968 \tabularnewline
43 & 176 & 174.499778592988 & 1.50022140701211 \tabularnewline
44 & 155 & 173.180594175379 & -18.1805941753791 \tabularnewline
45 & 173 & 159.571813333392 & 13.4281866666084 \tabularnewline
46 & 167 & 164.051806893278 & 2.94819310672199 \tabularnewline
47 & 164 & 163.308262973125 & 0.691737026875302 \tabularnewline
48 & 152 & 161.445991090296 & -9.44599109029636 \tabularnewline
49 & 173 & 153.244786555208 & 19.7552134447923 \tabularnewline
50 & 162 & 162.523141947604 & -0.523141947603989 \tabularnewline
51 & 158 & 161.042929877549 & -3.0429298775488 \tabularnewline
52 & 154 & 157.914457182958 & -3.91445718295839 \tabularnewline
53 & 151 & 153.91661722016 & -2.91661722015976 \tabularnewline
54 & 160 & 150.140493338685 & 9.85950666131473 \tabularnewline
55 & 160 & 154.139211841894 & 5.86078815810575 \tabularnewline
56 & 143 & 156.640082211279 & -13.6400822112789 \tabularnewline
57 & 170 & 147.421140612072 & 22.5788593879277 \tabularnewline
58 & 166 & 159.68131657451 & 6.31868342549026 \tabularnewline
59 & 153 & 164.019356874185 & -11.0193568741846 \tabularnewline
60 & 144 & 158.053276913706 & -14.0532769137064 \tabularnewline
\hline
\end{tabular}
%Source: https://freestatistics.org/blog/index.php?pk=&T=2

[TABLE]
[ROW][C]Interpolation Forecasts of Exponential Smoothing[/C][/ROW]
[ROW][C]t[/C][C]Observed[/C][C]Fitted[/C][C]Residuals[/C][/ROW]
[ROW][C]3[/C][C]135[/C][C]137[/C][C]-2[/C][/ROW]
[ROW][C]4[/C][C]126[/C][C]129.735166801931[/C][C]-3.73516680193109[/C][/ROW]
[ROW][C]5[/C][C]119[/C][C]121.163845476297[/C][C]-2.16384547629673[/C][/ROW]
[ROW][C]6[/C][C]133[/C][C]113.195667745875[/C][C]19.8043322541247[/C][/ROW]
[ROW][C]7[/C][C]134[/C][C]118.894257114438[/C][C]15.1057428855621[/C][/ROW]
[ROW][C]8[/C][C]123[/C][C]123.692318013055[/C][C]-0.6923180130552[/C][/ROW]
[ROW][C]9[/C][C]147[/C][C]120.07902929139[/C][C]26.9209707086103[/C][/ROW]
[ROW][C]10[/C][C]144[/C][C]133.856447072021[/C][C]10.1435529279792[/C][/ROW]
[ROW][C]11[/C][C]150[/C][C]139.838671111633[/C][C]10.1613288883668[/C][/ROW]
[ROW][C]12[/C][C]140[/C][C]146.892847481501[/C][C]-6.89284748150135[/C][/ROW]
[ROW][C]13[/C][C]165[/C][C]144.224248980801[/C][C]20.7757510191985[/C][/ROW]
[ROW][C]14[/C][C]173[/C][C]158.33294693449[/C][C]14.6670530655096[/C][/ROW]
[ROW][C]15[/C][C]167[/C][C]170.750921525076[/C][C]-3.75092152507582[/C][/ROW]
[ROW][C]16[/C][C]161[/C][C]173.054795829168[/C][C]-12.0547958291676[/C][/ROW]
[ROW][C]17[/C][C]151[/C][C]169.714928623383[/C][C]-18.7149286233827[/C][/ROW]
[ROW][C]18[/C][C]163[/C][C]160.902513851708[/C][C]2.09748614829206[/C][/ROW]
[ROW][C]19[/C][C]158[/C][C]163.295197059326[/C][C]-5.29519705932634[/C][/ROW]
[ROW][C]20[/C][C]152[/C][C]161.231958653699[/C][C]-9.23195865369885[/C][/ROW]
[ROW][C]21[/C][C]176[/C][C]156.125328536654[/C][C]19.8746714633456[/C][/ROW]
[ROW][C]22[/C][C]170[/C][C]168.460829270045[/C][C]1.53917072995532[/C][/ROW]
[ROW][C]23[/C][C]168[/C][C]171.27894779229[/C][C]-3.27894779228967[/C][/ROW]
[ROW][C]24[/C][C]164[/C][C]171.210959144996[/C][C]-7.21095914499594[/C][/ROW]
[ROW][C]25[/C][C]185[/C][C]168.313421942449[/C][C]16.6865780575514[/C][/ROW]
[ROW][C]26[/C][C]186[/C][C]179.77503452217[/C][C]6.22496547782973[/C][/ROW]
[ROW][C]27[/C][C]184[/C][C]186.365463785782[/C][C]-2.36546378578157[/C][/ROW]
[ROW][C]28[/C][C]179[/C][C]188.174107132057[/C][C]-9.17410713205732[/C][/ROW]
[ROW][C]29[/C][C]171[/C][C]185.429495050483[/C][C]-14.4294950504827[/C][/ROW]
[ROW][C]30[/C][C]187[/C][C]178.401952766378[/C][C]8.59804723362191[/C][/ROW]
[ROW][C]31[/C][C]191[/C][C]184.42851931514[/C][C]6.57148068485989[/C][/ROW]
[ROW][C]32[/C][C]176[/C][C]190.072548650495[/C][C]-14.072548650495[/C][/ROW]
[ROW][C]33[/C][C]204[/C][C]183.348130372487[/C][C]20.6518696275134[/C][/ROW]
[ROW][C]34[/C][C]196[/C][C]197.112445319216[/C][C]-1.11244531921588[/C][/ROW]
[ROW][C]35[/C][C]193[/C][C]199.272210581103[/C][C]-6.27221058110322[/C][/ROW]
[ROW][C]36[/C][C]179[/C][C]198.052526326255[/C][C]-19.0525263262554[/C][/ROW]
[ROW][C]37[/C][C]195[/C][C]188.0944736948[/C][C]6.90552630519974[/C][/ROW]
[ROW][C]38[/C][C]201[/C][C]192.560403273014[/C][C]8.43959672698634[/C][/ROW]
[ROW][C]39[/C][C]192[/C][C]198.718614783106[/C][C]-6.71861478310589[/C][/ROW]
[ROW][C]40[/C][C]181[/C][C]196.173049676821[/C][C]-15.1730496768212[/C][/ROW]
[ROW][C]41[/C][C]171[/C][C]187.578194598148[/C][C]-16.5781945981475[/C][/ROW]
[ROW][C]42[/C][C]177[/C][C]176.508057956843[/C][C]0.491942043156968[/C][/ROW]
[ROW][C]43[/C][C]176[/C][C]174.499778592988[/C][C]1.50022140701211[/C][/ROW]
[ROW][C]44[/C][C]155[/C][C]173.180594175379[/C][C]-18.1805941753791[/C][/ROW]
[ROW][C]45[/C][C]173[/C][C]159.571813333392[/C][C]13.4281866666084[/C][/ROW]
[ROW][C]46[/C][C]167[/C][C]164.051806893278[/C][C]2.94819310672199[/C][/ROW]
[ROW][C]47[/C][C]164[/C][C]163.308262973125[/C][C]0.691737026875302[/C][/ROW]
[ROW][C]48[/C][C]152[/C][C]161.445991090296[/C][C]-9.44599109029636[/C][/ROW]
[ROW][C]49[/C][C]173[/C][C]153.244786555208[/C][C]19.7552134447923[/C][/ROW]
[ROW][C]50[/C][C]162[/C][C]162.523141947604[/C][C]-0.523141947603989[/C][/ROW]
[ROW][C]51[/C][C]158[/C][C]161.042929877549[/C][C]-3.0429298775488[/C][/ROW]
[ROW][C]52[/C][C]154[/C][C]157.914457182958[/C][C]-3.91445718295839[/C][/ROW]
[ROW][C]53[/C][C]151[/C][C]153.91661722016[/C][C]-2.91661722015976[/C][/ROW]
[ROW][C]54[/C][C]160[/C][C]150.140493338685[/C][C]9.85950666131473[/C][/ROW]
[ROW][C]55[/C][C]160[/C][C]154.139211841894[/C][C]5.86078815810575[/C][/ROW]
[ROW][C]56[/C][C]143[/C][C]156.640082211279[/C][C]-13.6400822112789[/C][/ROW]
[ROW][C]57[/C][C]170[/C][C]147.421140612072[/C][C]22.5788593879277[/C][/ROW]
[ROW][C]58[/C][C]166[/C][C]159.68131657451[/C][C]6.31868342549026[/C][/ROW]
[ROW][C]59[/C][C]153[/C][C]164.019356874185[/C][C]-11.0193568741846[/C][/ROW]
[ROW][C]60[/C][C]144[/C][C]158.053276913706[/C][C]-14.0532769137064[/C][/ROW]
[/TABLE]
Source: https://freestatistics.org/blog/index.php?pk=&T=2

Globally Unique Identifier (entire table): ba.freestatistics.org/blog/index.php?pk=&T=2

As an alternative you can also use a QR Code:  

The GUIDs for individual cells are displayed in the table below:

Interpolation Forecasts of Exponential Smoothing
tObservedFittedResiduals
3135137-2
4126129.735166801931-3.73516680193109
5119121.163845476297-2.16384547629673
6133113.19566774587519.8043322541247
7134118.89425711443815.1057428855621
8123123.692318013055-0.6923180130552
9147120.0790292913926.9209707086103
10144133.85644707202110.1435529279792
11150139.83867111163310.1613288883668
12140146.892847481501-6.89284748150135
13165144.22424898080120.7757510191985
14173158.3329469344914.6670530655096
15167170.750921525076-3.75092152507582
16161173.054795829168-12.0547958291676
17151169.714928623383-18.7149286233827
18163160.9025138517082.09748614829206
19158163.295197059326-5.29519705932634
20152161.231958653699-9.23195865369885
21176156.12532853665419.8746714633456
22170168.4608292700451.53917072995532
23168171.27894779229-3.27894779228967
24164171.210959144996-7.21095914499594
25185168.31342194244916.6865780575514
26186179.775034522176.22496547782973
27184186.365463785782-2.36546378578157
28179188.174107132057-9.17410713205732
29171185.429495050483-14.4294950504827
30187178.4019527663788.59804723362191
31191184.428519315146.57148068485989
32176190.072548650495-14.072548650495
33204183.34813037248720.6518696275134
34196197.112445319216-1.11244531921588
35193199.272210581103-6.27221058110322
36179198.052526326255-19.0525263262554
37195188.09447369486.90552630519974
38201192.5604032730148.43959672698634
39192198.718614783106-6.71861478310589
40181196.173049676821-15.1730496768212
41171187.578194598148-16.5781945981475
42177176.5080579568430.491942043156968
43176174.4997785929881.50022140701211
44155173.180594175379-18.1805941753791
45173159.57181333339213.4281866666084
46167164.0518068932782.94819310672199
47164163.3082629731250.691737026875302
48152161.445991090296-9.44599109029636
49173153.24478655520819.7552134447923
50162162.523141947604-0.523141947603989
51158161.042929877549-3.0429298775488
52154157.914457182958-3.91445718295839
53151153.91661722016-2.91661722015976
54160150.1404933386859.85950666131473
55160154.1392118418945.86078815810575
56143156.640082211279-13.6400822112789
57170147.42114061207222.5788593879277
58166159.681316574516.31868342549026
59153164.019356874185-11.0193568741846
60144158.053276913706-14.0532769137064


Extrapolation Forecasts of Exponential Smoothing
tForecast95% Lower Bound95% Upper Bound
61149.016202293689125.830027432134172.202377155243
62147.397103222609119.963333660193174.830872785026
63145.77800415153113.457608412623178.098399890438
64144.158905080451106.405168158423181.91264200248
65142.53980600937298.8754170076022186.204195011142
66140.92070693829390.9200292568889190.921384619697
67139.30160786721482.5779928677909196.025222866637
68137.68250879613573.8793881919915201.485629400278
69136.06340972505664.8480040097782207.278815440334
70134.44431065397755.5031105261813213.385510781772
71132.82521158289845.8606639785913219.789759187204
72131.20611251181935.9341358328059226.478089190832

\begin{tabular}{lllllllll}
\hline
Extrapolation Forecasts of Exponential Smoothing \tabularnewline
t & Forecast & 95% Lower Bound & 95% Upper Bound \tabularnewline
61 & 149.016202293689 & 125.830027432134 & 172.202377155243 \tabularnewline
62 & 147.397103222609 & 119.963333660193 & 174.830872785026 \tabularnewline
63 & 145.77800415153 & 113.457608412623 & 178.098399890438 \tabularnewline
64 & 144.158905080451 & 106.405168158423 & 181.91264200248 \tabularnewline
65 & 142.539806009372 & 98.8754170076022 & 186.204195011142 \tabularnewline
66 & 140.920706938293 & 90.9200292568889 & 190.921384619697 \tabularnewline
67 & 139.301607867214 & 82.5779928677909 & 196.025222866637 \tabularnewline
68 & 137.682508796135 & 73.8793881919915 & 201.485629400278 \tabularnewline
69 & 136.063409725056 & 64.8480040097782 & 207.278815440334 \tabularnewline
70 & 134.444310653977 & 55.5031105261813 & 213.385510781772 \tabularnewline
71 & 132.825211582898 & 45.8606639785913 & 219.789759187204 \tabularnewline
72 & 131.206112511819 & 35.9341358328059 & 226.478089190832 \tabularnewline
\hline
\end{tabular}
%Source: https://freestatistics.org/blog/index.php?pk=&T=3

[TABLE]
[ROW][C]Extrapolation Forecasts of Exponential Smoothing[/C][/ROW]
[ROW][C]t[/C][C]Forecast[/C][C]95% Lower Bound[/C][C]95% Upper Bound[/C][/ROW]
[ROW][C]61[/C][C]149.016202293689[/C][C]125.830027432134[/C][C]172.202377155243[/C][/ROW]
[ROW][C]62[/C][C]147.397103222609[/C][C]119.963333660193[/C][C]174.830872785026[/C][/ROW]
[ROW][C]63[/C][C]145.77800415153[/C][C]113.457608412623[/C][C]178.098399890438[/C][/ROW]
[ROW][C]64[/C][C]144.158905080451[/C][C]106.405168158423[/C][C]181.91264200248[/C][/ROW]
[ROW][C]65[/C][C]142.539806009372[/C][C]98.8754170076022[/C][C]186.204195011142[/C][/ROW]
[ROW][C]66[/C][C]140.920706938293[/C][C]90.9200292568889[/C][C]190.921384619697[/C][/ROW]
[ROW][C]67[/C][C]139.301607867214[/C][C]82.5779928677909[/C][C]196.025222866637[/C][/ROW]
[ROW][C]68[/C][C]137.682508796135[/C][C]73.8793881919915[/C][C]201.485629400278[/C][/ROW]
[ROW][C]69[/C][C]136.063409725056[/C][C]64.8480040097782[/C][C]207.278815440334[/C][/ROW]
[ROW][C]70[/C][C]134.444310653977[/C][C]55.5031105261813[/C][C]213.385510781772[/C][/ROW]
[ROW][C]71[/C][C]132.825211582898[/C][C]45.8606639785913[/C][C]219.789759187204[/C][/ROW]
[ROW][C]72[/C][C]131.206112511819[/C][C]35.9341358328059[/C][C]226.478089190832[/C][/ROW]
[/TABLE]
Source: https://freestatistics.org/blog/index.php?pk=&T=3

Globally Unique Identifier (entire table): ba.freestatistics.org/blog/index.php?pk=&T=3

As an alternative you can also use a QR Code:  

The GUIDs for individual cells are displayed in the table below:

Extrapolation Forecasts of Exponential Smoothing
tForecast95% Lower Bound95% Upper Bound
61149.016202293689125.830027432134172.202377155243
62147.397103222609119.963333660193174.830872785026
63145.77800415153113.457608412623178.098399890438
64144.158905080451106.405168158423181.91264200248
65142.53980600937298.8754170076022186.204195011142
66140.92070693829390.9200292568889190.921384619697
67139.30160786721482.5779928677909196.025222866637
68137.68250879613573.8793881919915201.485629400278
69136.06340972505664.8480040097782207.278815440334
70134.44431065397755.5031105261813213.385510781772
71132.82521158289845.8606639785913219.789759187204
72131.20611251181935.9341358328059226.478089190832


Parameters (Session):
par1 = 12 ; par2 = Double ; par3 = additive ;
Parameters (R input):
par1 = 12 ; par2 = Double ; par3 = additive ;
R code (references can be found in the software module):
par1 <- as.numeric(par1)
if (par2 == 'Single') K <- 1
if (par2 == 'Double') K <- 2
if (par2 == 'Triple') K <- par1
nx <- length(x)
nxmK <- nx - K
x <- ts(x, frequency = par1)
if (par2 == 'Single') fit <- HoltWinters(x, gamma=F, beta=F)
if (par2 == 'Double') fit <- HoltWinters(x, gamma=F)
if (par2 == 'Triple') fit <- HoltWinters(x, seasonal=par3)
fit
myresid <- x - fit$fitted[,'xhat']
bitmap(file='test1.png')
op <- par(mfrow=c(2,1))
plot(fit,ylab='Observed (black) / Fitted (red)',main='Interpolation Fit of Exponential Smoothing')
plot(myresid,ylab='Residuals',main='Interpolation Prediction Errors')
par(op)
dev.off()
bitmap(file='test2.png')
p <- predict(fit, par1, prediction.interval=TRUE)
np <- length(p[,1])
plot(fit,p,ylab='Observed (black) / Fitted (red)',main='Extrapolation Fit of Exponential Smoothing')
dev.off()
bitmap(file='test3.png')
op <- par(mfrow = c(2,2))
acf(as.numeric(myresid),lag.max = nx/2,main='Residual ACF')
spectrum(myresid,main='Residals Periodogram')
cpgram(myresid,main='Residal Cumulative Periodogram')
qqnorm(myresid,main='Residual Normal QQ Plot')
qqline(myresid)
par(op)
dev.off()
load(file='createtable')
a<-table.start()
a<-table.row.start(a)
a<-table.element(a,'Estimated Parameters of Exponential Smoothing',2,TRUE)
a<-table.row.end(a)
a<-table.row.start(a)
a<-table.element(a,'Parameter',header=TRUE)
a<-table.element(a,'Value',header=TRUE)
a<-table.row.end(a)
a<-table.row.start(a)
a<-table.element(a,'alpha',header=TRUE)
a<-table.element(a,fit$alpha)
a<-table.row.end(a)
a<-table.row.start(a)
a<-table.element(a,'beta',header=TRUE)
a<-table.element(a,fit$beta)
a<-table.row.end(a)
a<-table.row.start(a)
a<-table.element(a,'gamma',header=TRUE)
a<-table.element(a,fit$gamma)
a<-table.row.end(a)
a<-table.end(a)
table.save(a,file='mytable.tab')
a<-table.start()
a<-table.row.start(a)
a<-table.element(a,'Interpolation Forecasts of Exponential Smoothing',4,TRUE)
a<-table.row.end(a)
a<-table.row.start(a)
a<-table.element(a,'t',header=TRUE)
a<-table.element(a,'Observed',header=TRUE)
a<-table.element(a,'Fitted',header=TRUE)
a<-table.element(a,'Residuals',header=TRUE)
a<-table.row.end(a)
for (i in 1:nxmK) {
a<-table.row.start(a)
a<-table.element(a,i+K,header=TRUE)
a<-table.element(a,x[i+K])
a<-table.element(a,fit$fitted[i,'xhat'])
a<-table.element(a,myresid[i])
a<-table.row.end(a)
}
a<-table.end(a)
table.save(a,file='mytable1.tab')
a<-table.start()
a<-table.row.start(a)
a<-table.element(a,'Extrapolation Forecasts of Exponential Smoothing',4,TRUE)
a<-table.row.end(a)
a<-table.row.start(a)
a<-table.element(a,'t',header=TRUE)
a<-table.element(a,'Forecast',header=TRUE)
a<-table.element(a,'95% Lower Bound',header=TRUE)
a<-table.element(a,'95% Upper Bound',header=TRUE)
a<-table.row.end(a)
for (i in 1:np) {
a<-table.row.start(a)
a<-table.element(a,nx+i,header=TRUE)
a<-table.element(a,p[i,'fit'])
a<-table.element(a,p[i,'lwr'])
a<-table.element(a,p[i,'upr'])
a<-table.row.end(a)
}
a<-table.end(a)
table.save(a,file='mytable2.tab')