Free Statistics

of Irreproducible Research!

Author's title

Author*Unverified author*
R Software Modulerwasp_exponentialsmoothing.wasp
Title produced by softwareExponential Smoothing
Date of computationFri, 25 Nov 2016 12:45:35 +0000
Cite this page as followsStatistical Computations at FreeStatistics.org, Office for Research Development and Education, URL https://freestatistics.org/blog/index.php?v=date/2016/Nov/25/t1480077966wpmsuu5ae9zd3pc.htm/, Retrieved Sun, 19 May 2024 01:21:45 +0200
Statistical Computations at FreeStatistics.org, Office for Research Development and Education, URL https://freestatistics.org/blog/index.php?pk=, Retrieved Sun, 19 May 2024 01:21:45 +0200
QR Codes:

Original text written by user:
IsPrivate?No (this computation is public)
User-defined keywords
Estimated Impact0
Dataseries X:
103,75
103,89
104,01
104,28
104,34
104,48
104,56
104,71
104,79
104,87
104,95
105
105,05
105,57
105,98
106,45
107,13
107,87
108,56
109,04
109,98
110,4
110,99
111,23
111,76
112,18
112,88
113,54
114,11
114,8
115,56
116,03
116,98
117,65
118,12
118,6
119,03
119,82
120,76
121,4
122,12
123,08
123,86
124,46
125,14
125,89
126,32
126,93
127,48
128,28
129,11
130,23
131,04
132,2
133,12
134,48
135,74
136,88
138,12
139,99


Summary of computational transaction
Raw Inputview raw input (R code)
Raw Outputview raw output of R engine
Computing time1 seconds
R Server'Gwilym Jenkins' @ jenkins.wessa.net

\begin{tabular}{lllllllll}
\hline
Summary of computational transaction \tabularnewline
Raw Input & view raw input (R code)  \tabularnewline
Raw Output & view raw output of R engine  \tabularnewline
Computing time & 1 seconds \tabularnewline
R Server & 'Gwilym Jenkins' @ jenkins.wessa.net \tabularnewline
\hline
\end{tabular}
%Source: https://freestatistics.org/blog/index.php?pk=&T=0

[TABLE]
[ROW][C]Summary of computational transaction[/C][/ROW]
[ROW][C]Raw Input[/C][C]view raw input (R code) [/C][/ROW]
[ROW][C]Raw Output[/C][C]view raw output of R engine [/C][/ROW]
[ROW][C]Computing time[/C][C]1 seconds[/C][/ROW]
[ROW][C]R Server[/C][C]'Gwilym Jenkins' @ jenkins.wessa.net[/C][/ROW]
[/TABLE]
Source: https://freestatistics.org/blog/index.php?pk=&T=0

Globally Unique Identifier (entire table): ba.freestatistics.org/blog/index.php?pk=&T=0

As an alternative you can also use a QR Code:  

The GUIDs for individual cells are displayed in the table below:

Summary of computational transaction
Raw Inputview raw input (R code)
Raw Outputview raw output of R engine
Computing time1 seconds
R Server'Gwilym Jenkins' @ jenkins.wessa.net


Estimated Parameters of Exponential Smoothing
ParameterValue
alpha0.999952143026438
betaFALSE
gammaFALSE

\begin{tabular}{lllllllll}
\hline
Estimated Parameters of Exponential Smoothing \tabularnewline
Parameter & Value \tabularnewline
alpha & 0.999952143026438 \tabularnewline
beta & FALSE \tabularnewline
gamma & FALSE \tabularnewline
\hline
\end{tabular}
%Source: https://freestatistics.org/blog/index.php?pk=&T=1

[TABLE]
[ROW][C]Estimated Parameters of Exponential Smoothing[/C][/ROW]
[ROW][C]Parameter[/C][C]Value[/C][/ROW]
[ROW][C]alpha[/C][C]0.999952143026438[/C][/ROW]
[ROW][C]beta[/C][C]FALSE[/C][/ROW]
[ROW][C]gamma[/C][C]FALSE[/C][/ROW]
[/TABLE]
Source: https://freestatistics.org/blog/index.php?pk=&T=1

Globally Unique Identifier (entire table): ba.freestatistics.org/blog/index.php?pk=&T=1

As an alternative you can also use a QR Code:  

The GUIDs for individual cells are displayed in the table below:

Estimated Parameters of Exponential Smoothing
ParameterValue
alpha0.999952143026438
betaFALSE
gammaFALSE


Interpolation Forecasts of Exponential Smoothing
tObservedFittedResiduals
2103.89103.750.140000000000001
3104.01103.8899933000240.120006699976301
4104.28104.0099942568430.270005743157455
5104.34104.2799870783420.0600129216577159
6104.48104.3399971279630.140002872036803
7104.56104.4799932998860.0800067001137421
8104.71104.5599961711210.150003828878525
9104.79104.7099928212710.0800071787292893
10104.87104.7899961710990.0800038289014253
11104.95104.8699961712590.0800038287411269
12105104.9499961712590.0500038287411115
13105.05104.9999976069680.0500023930319173
14105.57105.0499976070370.520002392963193
15105.98105.5699751142590.410024885740782
16106.45105.979980377450.470019622550126
17107.13106.4499775062830.680022493716649
18107.87107.1299674561810.740032543818515
19108.56107.8699645842820.690035415717887
20109.04108.5599669769930.480033023006641
21109.98109.0399770270720.940022972927693
22110.4109.9799550133450.420044986654574
23110.99110.3999798979180.590020102081809
24111.23110.9899717634240.240028236576435
25111.76111.2299885129750.530011487024979
26112.18111.7599746352540.420025364745712
27112.88112.1799798988570.700020101142769
28113.54112.8799664991570.660033500843483
29114.11113.5399684127940.57003158720579
30114.8114.1099727200130.690027279986595
31115.56114.7999669773830.760033022617307
32116.03115.559963627120.470036372880259
33116.98116.0299775054820.950022494518265
34117.65116.9799545347990.670045465201412
35118.12117.6499679336520.470032066348111
36118.6118.1199775056880.480022494312152
37119.03118.5999770275760.430022972423828
38119.82119.0299794204020.790020579598007
39120.76119.8199621920060.940037807994003
40121.4120.7599550126350.640044987364533
41122.12121.3999693693840.720030630616037
42123.08122.1199655415130.960034458486845
43123.86123.0799540556560.780045944343698
44124.46123.8599626693620.600037330638131
45125.14124.4599712840290.680028715970678
46125.89125.1399674558840.75003254411628
47126.32125.8899641057120.430035894287627
48126.93126.3199794197840.610020580216442
49127.48126.9299708062610.55002919373878
50128.28127.4799736772670.800026322732592
51129.11128.2799617131610.830038286838601
52130.23129.109960276881.1200397231203
53131.04130.2299463982890.810053601711417
54132.2131.0399612332861.1600387667138
55133.12132.1999444840550.920055515944597
56134.48133.1199559689271.3600440310725
57135.74134.4799349124091.26006508759127
58136.88135.7399396970981.14006030290156
59138.12136.8799454401641.24005455983578
60139.99138.1199406547421.87005934525828

\begin{tabular}{lllllllll}
\hline
Interpolation Forecasts of Exponential Smoothing \tabularnewline
t & Observed & Fitted & Residuals \tabularnewline
2 & 103.89 & 103.75 & 0.140000000000001 \tabularnewline
3 & 104.01 & 103.889993300024 & 0.120006699976301 \tabularnewline
4 & 104.28 & 104.009994256843 & 0.270005743157455 \tabularnewline
5 & 104.34 & 104.279987078342 & 0.0600129216577159 \tabularnewline
6 & 104.48 & 104.339997127963 & 0.140002872036803 \tabularnewline
7 & 104.56 & 104.479993299886 & 0.0800067001137421 \tabularnewline
8 & 104.71 & 104.559996171121 & 0.150003828878525 \tabularnewline
9 & 104.79 & 104.709992821271 & 0.0800071787292893 \tabularnewline
10 & 104.87 & 104.789996171099 & 0.0800038289014253 \tabularnewline
11 & 104.95 & 104.869996171259 & 0.0800038287411269 \tabularnewline
12 & 105 & 104.949996171259 & 0.0500038287411115 \tabularnewline
13 & 105.05 & 104.999997606968 & 0.0500023930319173 \tabularnewline
14 & 105.57 & 105.049997607037 & 0.520002392963193 \tabularnewline
15 & 105.98 & 105.569975114259 & 0.410024885740782 \tabularnewline
16 & 106.45 & 105.97998037745 & 0.470019622550126 \tabularnewline
17 & 107.13 & 106.449977506283 & 0.680022493716649 \tabularnewline
18 & 107.87 & 107.129967456181 & 0.740032543818515 \tabularnewline
19 & 108.56 & 107.869964584282 & 0.690035415717887 \tabularnewline
20 & 109.04 & 108.559966976993 & 0.480033023006641 \tabularnewline
21 & 109.98 & 109.039977027072 & 0.940022972927693 \tabularnewline
22 & 110.4 & 109.979955013345 & 0.420044986654574 \tabularnewline
23 & 110.99 & 110.399979897918 & 0.590020102081809 \tabularnewline
24 & 111.23 & 110.989971763424 & 0.240028236576435 \tabularnewline
25 & 111.76 & 111.229988512975 & 0.530011487024979 \tabularnewline
26 & 112.18 & 111.759974635254 & 0.420025364745712 \tabularnewline
27 & 112.88 & 112.179979898857 & 0.700020101142769 \tabularnewline
28 & 113.54 & 112.879966499157 & 0.660033500843483 \tabularnewline
29 & 114.11 & 113.539968412794 & 0.57003158720579 \tabularnewline
30 & 114.8 & 114.109972720013 & 0.690027279986595 \tabularnewline
31 & 115.56 & 114.799966977383 & 0.760033022617307 \tabularnewline
32 & 116.03 & 115.55996362712 & 0.470036372880259 \tabularnewline
33 & 116.98 & 116.029977505482 & 0.950022494518265 \tabularnewline
34 & 117.65 & 116.979954534799 & 0.670045465201412 \tabularnewline
35 & 118.12 & 117.649967933652 & 0.470032066348111 \tabularnewline
36 & 118.6 & 118.119977505688 & 0.480022494312152 \tabularnewline
37 & 119.03 & 118.599977027576 & 0.430022972423828 \tabularnewline
38 & 119.82 & 119.029979420402 & 0.790020579598007 \tabularnewline
39 & 120.76 & 119.819962192006 & 0.940037807994003 \tabularnewline
40 & 121.4 & 120.759955012635 & 0.640044987364533 \tabularnewline
41 & 122.12 & 121.399969369384 & 0.720030630616037 \tabularnewline
42 & 123.08 & 122.119965541513 & 0.960034458486845 \tabularnewline
43 & 123.86 & 123.079954055656 & 0.780045944343698 \tabularnewline
44 & 124.46 & 123.859962669362 & 0.600037330638131 \tabularnewline
45 & 125.14 & 124.459971284029 & 0.680028715970678 \tabularnewline
46 & 125.89 & 125.139967455884 & 0.75003254411628 \tabularnewline
47 & 126.32 & 125.889964105712 & 0.430035894287627 \tabularnewline
48 & 126.93 & 126.319979419784 & 0.610020580216442 \tabularnewline
49 & 127.48 & 126.929970806261 & 0.55002919373878 \tabularnewline
50 & 128.28 & 127.479973677267 & 0.800026322732592 \tabularnewline
51 & 129.11 & 128.279961713161 & 0.830038286838601 \tabularnewline
52 & 130.23 & 129.10996027688 & 1.1200397231203 \tabularnewline
53 & 131.04 & 130.229946398289 & 0.810053601711417 \tabularnewline
54 & 132.2 & 131.039961233286 & 1.1600387667138 \tabularnewline
55 & 133.12 & 132.199944484055 & 0.920055515944597 \tabularnewline
56 & 134.48 & 133.119955968927 & 1.3600440310725 \tabularnewline
57 & 135.74 & 134.479934912409 & 1.26006508759127 \tabularnewline
58 & 136.88 & 135.739939697098 & 1.14006030290156 \tabularnewline
59 & 138.12 & 136.879945440164 & 1.24005455983578 \tabularnewline
60 & 139.99 & 138.119940654742 & 1.87005934525828 \tabularnewline
\hline
\end{tabular}
%Source: https://freestatistics.org/blog/index.php?pk=&T=2

[TABLE]
[ROW][C]Interpolation Forecasts of Exponential Smoothing[/C][/ROW]
[ROW][C]t[/C][C]Observed[/C][C]Fitted[/C][C]Residuals[/C][/ROW]
[ROW][C]2[/C][C]103.89[/C][C]103.75[/C][C]0.140000000000001[/C][/ROW]
[ROW][C]3[/C][C]104.01[/C][C]103.889993300024[/C][C]0.120006699976301[/C][/ROW]
[ROW][C]4[/C][C]104.28[/C][C]104.009994256843[/C][C]0.270005743157455[/C][/ROW]
[ROW][C]5[/C][C]104.34[/C][C]104.279987078342[/C][C]0.0600129216577159[/C][/ROW]
[ROW][C]6[/C][C]104.48[/C][C]104.339997127963[/C][C]0.140002872036803[/C][/ROW]
[ROW][C]7[/C][C]104.56[/C][C]104.479993299886[/C][C]0.0800067001137421[/C][/ROW]
[ROW][C]8[/C][C]104.71[/C][C]104.559996171121[/C][C]0.150003828878525[/C][/ROW]
[ROW][C]9[/C][C]104.79[/C][C]104.709992821271[/C][C]0.0800071787292893[/C][/ROW]
[ROW][C]10[/C][C]104.87[/C][C]104.789996171099[/C][C]0.0800038289014253[/C][/ROW]
[ROW][C]11[/C][C]104.95[/C][C]104.869996171259[/C][C]0.0800038287411269[/C][/ROW]
[ROW][C]12[/C][C]105[/C][C]104.949996171259[/C][C]0.0500038287411115[/C][/ROW]
[ROW][C]13[/C][C]105.05[/C][C]104.999997606968[/C][C]0.0500023930319173[/C][/ROW]
[ROW][C]14[/C][C]105.57[/C][C]105.049997607037[/C][C]0.520002392963193[/C][/ROW]
[ROW][C]15[/C][C]105.98[/C][C]105.569975114259[/C][C]0.410024885740782[/C][/ROW]
[ROW][C]16[/C][C]106.45[/C][C]105.97998037745[/C][C]0.470019622550126[/C][/ROW]
[ROW][C]17[/C][C]107.13[/C][C]106.449977506283[/C][C]0.680022493716649[/C][/ROW]
[ROW][C]18[/C][C]107.87[/C][C]107.129967456181[/C][C]0.740032543818515[/C][/ROW]
[ROW][C]19[/C][C]108.56[/C][C]107.869964584282[/C][C]0.690035415717887[/C][/ROW]
[ROW][C]20[/C][C]109.04[/C][C]108.559966976993[/C][C]0.480033023006641[/C][/ROW]
[ROW][C]21[/C][C]109.98[/C][C]109.039977027072[/C][C]0.940022972927693[/C][/ROW]
[ROW][C]22[/C][C]110.4[/C][C]109.979955013345[/C][C]0.420044986654574[/C][/ROW]
[ROW][C]23[/C][C]110.99[/C][C]110.399979897918[/C][C]0.590020102081809[/C][/ROW]
[ROW][C]24[/C][C]111.23[/C][C]110.989971763424[/C][C]0.240028236576435[/C][/ROW]
[ROW][C]25[/C][C]111.76[/C][C]111.229988512975[/C][C]0.530011487024979[/C][/ROW]
[ROW][C]26[/C][C]112.18[/C][C]111.759974635254[/C][C]0.420025364745712[/C][/ROW]
[ROW][C]27[/C][C]112.88[/C][C]112.179979898857[/C][C]0.700020101142769[/C][/ROW]
[ROW][C]28[/C][C]113.54[/C][C]112.879966499157[/C][C]0.660033500843483[/C][/ROW]
[ROW][C]29[/C][C]114.11[/C][C]113.539968412794[/C][C]0.57003158720579[/C][/ROW]
[ROW][C]30[/C][C]114.8[/C][C]114.109972720013[/C][C]0.690027279986595[/C][/ROW]
[ROW][C]31[/C][C]115.56[/C][C]114.799966977383[/C][C]0.760033022617307[/C][/ROW]
[ROW][C]32[/C][C]116.03[/C][C]115.55996362712[/C][C]0.470036372880259[/C][/ROW]
[ROW][C]33[/C][C]116.98[/C][C]116.029977505482[/C][C]0.950022494518265[/C][/ROW]
[ROW][C]34[/C][C]117.65[/C][C]116.979954534799[/C][C]0.670045465201412[/C][/ROW]
[ROW][C]35[/C][C]118.12[/C][C]117.649967933652[/C][C]0.470032066348111[/C][/ROW]
[ROW][C]36[/C][C]118.6[/C][C]118.119977505688[/C][C]0.480022494312152[/C][/ROW]
[ROW][C]37[/C][C]119.03[/C][C]118.599977027576[/C][C]0.430022972423828[/C][/ROW]
[ROW][C]38[/C][C]119.82[/C][C]119.029979420402[/C][C]0.790020579598007[/C][/ROW]
[ROW][C]39[/C][C]120.76[/C][C]119.819962192006[/C][C]0.940037807994003[/C][/ROW]
[ROW][C]40[/C][C]121.4[/C][C]120.759955012635[/C][C]0.640044987364533[/C][/ROW]
[ROW][C]41[/C][C]122.12[/C][C]121.399969369384[/C][C]0.720030630616037[/C][/ROW]
[ROW][C]42[/C][C]123.08[/C][C]122.119965541513[/C][C]0.960034458486845[/C][/ROW]
[ROW][C]43[/C][C]123.86[/C][C]123.079954055656[/C][C]0.780045944343698[/C][/ROW]
[ROW][C]44[/C][C]124.46[/C][C]123.859962669362[/C][C]0.600037330638131[/C][/ROW]
[ROW][C]45[/C][C]125.14[/C][C]124.459971284029[/C][C]0.680028715970678[/C][/ROW]
[ROW][C]46[/C][C]125.89[/C][C]125.139967455884[/C][C]0.75003254411628[/C][/ROW]
[ROW][C]47[/C][C]126.32[/C][C]125.889964105712[/C][C]0.430035894287627[/C][/ROW]
[ROW][C]48[/C][C]126.93[/C][C]126.319979419784[/C][C]0.610020580216442[/C][/ROW]
[ROW][C]49[/C][C]127.48[/C][C]126.929970806261[/C][C]0.55002919373878[/C][/ROW]
[ROW][C]50[/C][C]128.28[/C][C]127.479973677267[/C][C]0.800026322732592[/C][/ROW]
[ROW][C]51[/C][C]129.11[/C][C]128.279961713161[/C][C]0.830038286838601[/C][/ROW]
[ROW][C]52[/C][C]130.23[/C][C]129.10996027688[/C][C]1.1200397231203[/C][/ROW]
[ROW][C]53[/C][C]131.04[/C][C]130.229946398289[/C][C]0.810053601711417[/C][/ROW]
[ROW][C]54[/C][C]132.2[/C][C]131.039961233286[/C][C]1.1600387667138[/C][/ROW]
[ROW][C]55[/C][C]133.12[/C][C]132.199944484055[/C][C]0.920055515944597[/C][/ROW]
[ROW][C]56[/C][C]134.48[/C][C]133.119955968927[/C][C]1.3600440310725[/C][/ROW]
[ROW][C]57[/C][C]135.74[/C][C]134.479934912409[/C][C]1.26006508759127[/C][/ROW]
[ROW][C]58[/C][C]136.88[/C][C]135.739939697098[/C][C]1.14006030290156[/C][/ROW]
[ROW][C]59[/C][C]138.12[/C][C]136.879945440164[/C][C]1.24005455983578[/C][/ROW]
[ROW][C]60[/C][C]139.99[/C][C]138.119940654742[/C][C]1.87005934525828[/C][/ROW]
[/TABLE]
Source: https://freestatistics.org/blog/index.php?pk=&T=2

Globally Unique Identifier (entire table): ba.freestatistics.org/blog/index.php?pk=&T=2

As an alternative you can also use a QR Code:  

The GUIDs for individual cells are displayed in the table below:

Interpolation Forecasts of Exponential Smoothing
tObservedFittedResiduals
2103.89103.750.140000000000001
3104.01103.8899933000240.120006699976301
4104.28104.0099942568430.270005743157455
5104.34104.2799870783420.0600129216577159
6104.48104.3399971279630.140002872036803
7104.56104.4799932998860.0800067001137421
8104.71104.5599961711210.150003828878525
9104.79104.7099928212710.0800071787292893
10104.87104.7899961710990.0800038289014253
11104.95104.8699961712590.0800038287411269
12105104.9499961712590.0500038287411115
13105.05104.9999976069680.0500023930319173
14105.57105.0499976070370.520002392963193
15105.98105.5699751142590.410024885740782
16106.45105.979980377450.470019622550126
17107.13106.4499775062830.680022493716649
18107.87107.1299674561810.740032543818515
19108.56107.8699645842820.690035415717887
20109.04108.5599669769930.480033023006641
21109.98109.0399770270720.940022972927693
22110.4109.9799550133450.420044986654574
23110.99110.3999798979180.590020102081809
24111.23110.9899717634240.240028236576435
25111.76111.2299885129750.530011487024979
26112.18111.7599746352540.420025364745712
27112.88112.1799798988570.700020101142769
28113.54112.8799664991570.660033500843483
29114.11113.5399684127940.57003158720579
30114.8114.1099727200130.690027279986595
31115.56114.7999669773830.760033022617307
32116.03115.559963627120.470036372880259
33116.98116.0299775054820.950022494518265
34117.65116.9799545347990.670045465201412
35118.12117.6499679336520.470032066348111
36118.6118.1199775056880.480022494312152
37119.03118.5999770275760.430022972423828
38119.82119.0299794204020.790020579598007
39120.76119.8199621920060.940037807994003
40121.4120.7599550126350.640044987364533
41122.12121.3999693693840.720030630616037
42123.08122.1199655415130.960034458486845
43123.86123.0799540556560.780045944343698
44124.46123.8599626693620.600037330638131
45125.14124.4599712840290.680028715970678
46125.89125.1399674558840.75003254411628
47126.32125.8899641057120.430035894287627
48126.93126.3199794197840.610020580216442
49127.48126.9299708062610.55002919373878
50128.28127.4799736772670.800026322732592
51129.11128.2799617131610.830038286838601
52130.23129.109960276881.1200397231203
53131.04130.2299463982890.810053601711417
54132.2131.0399612332861.1600387667138
55133.12132.1999444840550.920055515944597
56134.48133.1199559689271.3600440310725
57135.74134.4799349124091.26006508759127
58136.88135.7399396970981.14006030290156
59138.12136.8799454401641.24005455983578
60139.99138.1199406547421.87005934525828


Extrapolation Forecasts of Exponential Smoothing
tForecast95% Lower Bound95% Upper Bound
61139.989910504619139.255286527078140.724534482161
62139.989910504619138.951020171706141.028800837533
63139.989910504619138.717545046403141.262275962835
64139.989910504619138.520715284541141.459105724698
65139.989910504619138.347304243173141.632516766066
66139.989910504619138.190528370223141.789292639016
67139.989910504619138.046357880936141.933463128302
68139.989910504619137.91216712863142.067653880608
69139.989910504619137.786132323425142.193688685813
70139.989910504619137.666925569811142.312895439428
71139.989910504619137.553544410866142.426276598372
72139.989910504619137.445210035364142.534610973875

\begin{tabular}{lllllllll}
\hline
Extrapolation Forecasts of Exponential Smoothing \tabularnewline
t & Forecast & 95% Lower Bound & 95% Upper Bound \tabularnewline
61 & 139.989910504619 & 139.255286527078 & 140.724534482161 \tabularnewline
62 & 139.989910504619 & 138.951020171706 & 141.028800837533 \tabularnewline
63 & 139.989910504619 & 138.717545046403 & 141.262275962835 \tabularnewline
64 & 139.989910504619 & 138.520715284541 & 141.459105724698 \tabularnewline
65 & 139.989910504619 & 138.347304243173 & 141.632516766066 \tabularnewline
66 & 139.989910504619 & 138.190528370223 & 141.789292639016 \tabularnewline
67 & 139.989910504619 & 138.046357880936 & 141.933463128302 \tabularnewline
68 & 139.989910504619 & 137.91216712863 & 142.067653880608 \tabularnewline
69 & 139.989910504619 & 137.786132323425 & 142.193688685813 \tabularnewline
70 & 139.989910504619 & 137.666925569811 & 142.312895439428 \tabularnewline
71 & 139.989910504619 & 137.553544410866 & 142.426276598372 \tabularnewline
72 & 139.989910504619 & 137.445210035364 & 142.534610973875 \tabularnewline
\hline
\end{tabular}
%Source: https://freestatistics.org/blog/index.php?pk=&T=3

[TABLE]
[ROW][C]Extrapolation Forecasts of Exponential Smoothing[/C][/ROW]
[ROW][C]t[/C][C]Forecast[/C][C]95% Lower Bound[/C][C]95% Upper Bound[/C][/ROW]
[ROW][C]61[/C][C]139.989910504619[/C][C]139.255286527078[/C][C]140.724534482161[/C][/ROW]
[ROW][C]62[/C][C]139.989910504619[/C][C]138.951020171706[/C][C]141.028800837533[/C][/ROW]
[ROW][C]63[/C][C]139.989910504619[/C][C]138.717545046403[/C][C]141.262275962835[/C][/ROW]
[ROW][C]64[/C][C]139.989910504619[/C][C]138.520715284541[/C][C]141.459105724698[/C][/ROW]
[ROW][C]65[/C][C]139.989910504619[/C][C]138.347304243173[/C][C]141.632516766066[/C][/ROW]
[ROW][C]66[/C][C]139.989910504619[/C][C]138.190528370223[/C][C]141.789292639016[/C][/ROW]
[ROW][C]67[/C][C]139.989910504619[/C][C]138.046357880936[/C][C]141.933463128302[/C][/ROW]
[ROW][C]68[/C][C]139.989910504619[/C][C]137.91216712863[/C][C]142.067653880608[/C][/ROW]
[ROW][C]69[/C][C]139.989910504619[/C][C]137.786132323425[/C][C]142.193688685813[/C][/ROW]
[ROW][C]70[/C][C]139.989910504619[/C][C]137.666925569811[/C][C]142.312895439428[/C][/ROW]
[ROW][C]71[/C][C]139.989910504619[/C][C]137.553544410866[/C][C]142.426276598372[/C][/ROW]
[ROW][C]72[/C][C]139.989910504619[/C][C]137.445210035364[/C][C]142.534610973875[/C][/ROW]
[/TABLE]
Source: https://freestatistics.org/blog/index.php?pk=&T=3

Globally Unique Identifier (entire table): ba.freestatistics.org/blog/index.php?pk=&T=3

As an alternative you can also use a QR Code:  

The GUIDs for individual cells are displayed in the table below:

Extrapolation Forecasts of Exponential Smoothing
tForecast95% Lower Bound95% Upper Bound
61139.989910504619139.255286527078140.724534482161
62139.989910504619138.951020171706141.028800837533
63139.989910504619138.717545046403141.262275962835
64139.989910504619138.520715284541141.459105724698
65139.989910504619138.347304243173141.632516766066
66139.989910504619138.190528370223141.789292639016
67139.989910504619138.046357880936141.933463128302
68139.989910504619137.91216712863142.067653880608
69139.989910504619137.786132323425142.193688685813
70139.989910504619137.666925569811142.312895439428
71139.989910504619137.553544410866142.426276598372
72139.989910504619137.445210035364142.534610973875


Parameters (Session):
par1 = 12 ; par2 = Single ; par3 = additive ;
Parameters (R input):
par1 = 12 ; par2 = Single ; par3 = additive ;
R code (references can be found in the software module):
par1 <- as.numeric(par1)
if (par2 == 'Single') K <- 1
if (par2 == 'Double') K <- 2
if (par2 == 'Triple') K <- par1
nx <- length(x)
nxmK <- nx - K
x <- ts(x, frequency = par1)
if (par2 == 'Single') fit <- HoltWinters(x, gamma=F, beta=F)
if (par2 == 'Double') fit <- HoltWinters(x, gamma=F)
if (par2 == 'Triple') fit <- HoltWinters(x, seasonal=par3)
fit
myresid <- x - fit$fitted[,'xhat']
bitmap(file='test1.png')
op <- par(mfrow=c(2,1))
plot(fit,ylab='Observed (black) / Fitted (red)',main='Interpolation Fit of Exponential Smoothing')
plot(myresid,ylab='Residuals',main='Interpolation Prediction Errors')
par(op)
dev.off()
bitmap(file='test2.png')
p <- predict(fit, par1, prediction.interval=TRUE)
np <- length(p[,1])
plot(fit,p,ylab='Observed (black) / Fitted (red)',main='Extrapolation Fit of Exponential Smoothing')
dev.off()
bitmap(file='test3.png')
op <- par(mfrow = c(2,2))
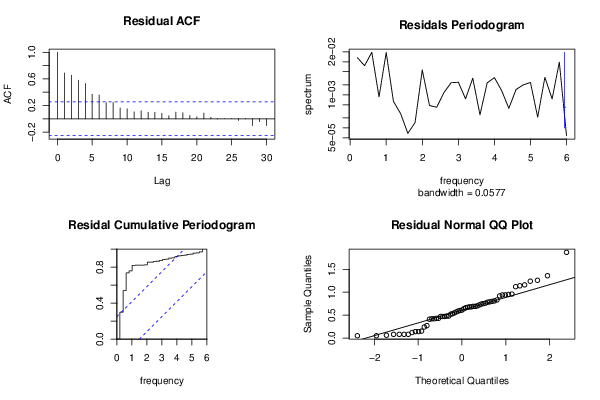
acf(as.numeric(myresid),lag.max = nx/2,main='Residual ACF')
spectrum(myresid,main='Residals Periodogram')
cpgram(myresid,main='Residal Cumulative Periodogram')
qqnorm(myresid,main='Residual Normal QQ Plot')
qqline(myresid)
par(op)
dev.off()
load(file='createtable')
a<-table.start()
a<-table.row.start(a)
a<-table.element(a,'Estimated Parameters of Exponential Smoothing',2,TRUE)
a<-table.row.end(a)
a<-table.row.start(a)
a<-table.element(a,'Parameter',header=TRUE)
a<-table.element(a,'Value',header=TRUE)
a<-table.row.end(a)
a<-table.row.start(a)
a<-table.element(a,'alpha',header=TRUE)
a<-table.element(a,fit$alpha)
a<-table.row.end(a)
a<-table.row.start(a)
a<-table.element(a,'beta',header=TRUE)
a<-table.element(a,fit$beta)
a<-table.row.end(a)
a<-table.row.start(a)
a<-table.element(a,'gamma',header=TRUE)
a<-table.element(a,fit$gamma)
a<-table.row.end(a)
a<-table.end(a)
table.save(a,file='mytable.tab')
a<-table.start()
a<-table.row.start(a)
a<-table.element(a,'Interpolation Forecasts of Exponential Smoothing',4,TRUE)
a<-table.row.end(a)
a<-table.row.start(a)
a<-table.element(a,'t',header=TRUE)
a<-table.element(a,'Observed',header=TRUE)
a<-table.element(a,'Fitted',header=TRUE)
a<-table.element(a,'Residuals',header=TRUE)
a<-table.row.end(a)
for (i in 1:nxmK) {
a<-table.row.start(a)
a<-table.element(a,i+K,header=TRUE)
a<-table.element(a,x[i+K])
a<-table.element(a,fit$fitted[i,'xhat'])
a<-table.element(a,myresid[i])
a<-table.row.end(a)
}
a<-table.end(a)
table.save(a,file='mytable1.tab')
a<-table.start()
a<-table.row.start(a)
a<-table.element(a,'Extrapolation Forecasts of Exponential Smoothing',4,TRUE)
a<-table.row.end(a)
a<-table.row.start(a)
a<-table.element(a,'t',header=TRUE)
a<-table.element(a,'Forecast',header=TRUE)
a<-table.element(a,'95% Lower Bound',header=TRUE)
a<-table.element(a,'95% Upper Bound',header=TRUE)
a<-table.row.end(a)
for (i in 1:np) {
a<-table.row.start(a)
a<-table.element(a,nx+i,header=TRUE)
a<-table.element(a,p[i,'fit'])
a<-table.element(a,p[i,'lwr'])
a<-table.element(a,p[i,'upr'])
a<-table.row.end(a)
}
a<-table.end(a)
table.save(a,file='mytable2.tab')