Free Statistics

of Irreproducible Research!

Author's title

Author*Unverified author*
R Software Modulerwasp_exponentialsmoothing.wasp
Title produced by softwareExponential Smoothing
Date of computationFri, 25 Nov 2016 11:13:50 +0000
Cite this page as followsStatistical Computations at FreeStatistics.org, Office for Research Development and Education, URL https://freestatistics.org/blog/index.php?v=date/2016/Nov/25/t1480072612o01b8up67v2yz04.htm/, Retrieved Sun, 19 May 2024 03:57:35 +0200
Statistical Computations at FreeStatistics.org, Office for Research Development and Education, URL https://freestatistics.org/blog/index.php?pk=, Retrieved Sun, 19 May 2024 03:57:35 +0200
QR Codes:

Original text written by user:
IsPrivate?No (this computation is public)
User-defined keywords
Estimated Impact0
Dataseries X:
96.07
95
93.27
91.94
91.62
91.01
90.62
97.72
99.09
99.72
100.22
99.15
101.16
101.8
103.31
101.19
99.09
95.91
94.56
95.76
100.36
102.67
103.58
100.89
103.46
104.86
104.88
104.46
103.83
101
99.36
96.71
95.23
95.62
95.8
94.79
95.39
94.9
94.84
94.68
94.17
94.1
93.84
94.2
97.76
98.26
99.63
98.75
100.15
99.63
99.72
98.87
98.4
97.99
98.46
98.73
98.66
98.14
98.39
97.78


Summary of computational transaction
Raw Inputview raw input (R code)
Raw Outputview raw output of R engine
Computing time2 seconds
R Server'George Udny Yule' @ yule.wessa.net

\begin{tabular}{lllllllll}
\hline
Summary of computational transaction \tabularnewline
Raw Input & view raw input (R code)  \tabularnewline
Raw Output & view raw output of R engine  \tabularnewline
Computing time & 2 seconds \tabularnewline
R Server & 'George Udny Yule' @ yule.wessa.net \tabularnewline
\hline
\end{tabular}
%Source: https://freestatistics.org/blog/index.php?pk=&T=0

[TABLE]
[ROW][C]Summary of computational transaction[/C][/ROW]
[ROW][C]Raw Input[/C][C]view raw input (R code) [/C][/ROW]
[ROW][C]Raw Output[/C][C]view raw output of R engine [/C][/ROW]
[ROW][C]Computing time[/C][C]2 seconds[/C][/ROW]
[ROW][C]R Server[/C][C]'George Udny Yule' @ yule.wessa.net[/C][/ROW]
[/TABLE]
Source: https://freestatistics.org/blog/index.php?pk=&T=0

Globally Unique Identifier (entire table): ba.freestatistics.org/blog/index.php?pk=&T=0

As an alternative you can also use a QR Code:  

The GUIDs for individual cells are displayed in the table below:

Summary of computational transaction
Raw Inputview raw input (R code)
Raw Outputview raw output of R engine
Computing time2 seconds
R Server'George Udny Yule' @ yule.wessa.net


Estimated Parameters of Exponential Smoothing
ParameterValue
alpha0.999943374706595
betaFALSE
gammaFALSE

\begin{tabular}{lllllllll}
\hline
Estimated Parameters of Exponential Smoothing \tabularnewline
Parameter & Value \tabularnewline
alpha & 0.999943374706595 \tabularnewline
beta & FALSE \tabularnewline
gamma & FALSE \tabularnewline
\hline
\end{tabular}
%Source: https://freestatistics.org/blog/index.php?pk=&T=1

[TABLE]
[ROW][C]Estimated Parameters of Exponential Smoothing[/C][/ROW]
[ROW][C]Parameter[/C][C]Value[/C][/ROW]
[ROW][C]alpha[/C][C]0.999943374706595[/C][/ROW]
[ROW][C]beta[/C][C]FALSE[/C][/ROW]
[ROW][C]gamma[/C][C]FALSE[/C][/ROW]
[/TABLE]
Source: https://freestatistics.org/blog/index.php?pk=&T=1

Globally Unique Identifier (entire table): ba.freestatistics.org/blog/index.php?pk=&T=1

As an alternative you can also use a QR Code:  

The GUIDs for individual cells are displayed in the table below:

Estimated Parameters of Exponential Smoothing
ParameterValue
alpha0.999943374706595
betaFALSE
gammaFALSE


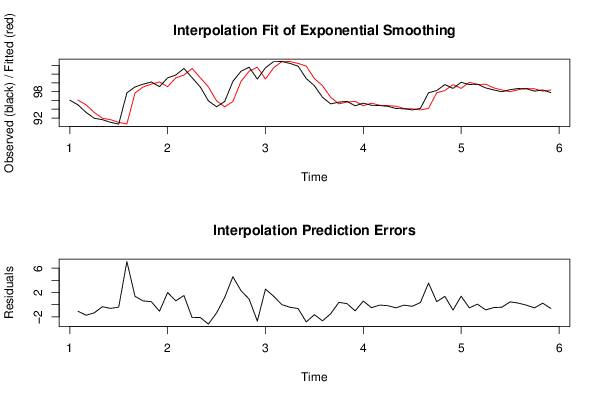
Interpolation Forecasts of Exponential Smoothing
tObservedFittedResiduals
29596.07-1.06999999999999
393.2795.0000605890639-1.73006058906395
491.9493.2700979651885-1.33009796518847
591.6291.9400753171875-0.320075317187531
691.0191.6200181243588-0.610018124358746
790.6291.0100345424553-0.390034542455268
897.7290.62002208582047.09997791417959
999.0997.71959796166741.37040203833256
1099.7299.08992240058250.63007759941749
11100.2299.71996432167110.500035678328928
1299.15100.219971685333-1.069971685333
13101.1699.15006058746062.00993941253938
14101.8101.1598861865910.640113813408973
15103.31101.7999637533681.5100362466325
16101.19103.309914493754-2.11991449375448
1799.09101.19012004078-2.1001200407802
1895.9199.0901189199135-3.18011891991351
1994.5695.9101800751669-1.3501800751669
2095.7694.56007645434291.1999235456571
21100.3695.75993205397724.60006794602282
22102.67100.3597395198032.31026048019713
23103.58102.6698691808220.910130819177525
24100.89103.579948463575-2.68994846357532
25103.46100.8901523191212.56984768087901
26104.86103.4598544816211.40014551837895
27104.88104.8599207163490.020079283650773
28104.46104.879998863005-0.419998863004679
29103.83104.460023782559-0.630023782558851
30101103.830035675282-2.83003567528154
3199.36101.0001602516-1.64016025160046
3296.7199.3600928745555-2.65009287455548
3395.2396.7101500622866-1.48015006228655
3495.6295.23008381393160.389916186068433
3595.895.61997792088160.18002207911843
3694.7995.7999898061969-1.00998980619694
3795.3994.79005719096910.599942809030878
3894.995.3899660280624-0.489966028062398
3994.8494.9000277444701-0.0600277444700907
4094.6894.8400033990886-0.160003399088637
4194.1794.6800090602394-0.510009060239426
4294.194.1700288794127-0.0700288794126891
4393.8494.1000039654058-0.260003965405843
4494.293.84001472280080.359985277199172
4597.7694.19997961572813.56002038427195
4698.2697.75979841280120.500201587198788
4799.6398.25997167593841.37002832406162
4898.7599.6299224217442-0.879922421744169
49100.1598.75004982586531.3999501741347
5099.63100.149920727411-0.51992072741065
5199.7299.63002944066370.0899705593362654
5298.8799.7199949053907-0.849994905390673
5398.498.8700481312109-0.470048131210902
5497.9998.4000266166134-0.410026616613365
5598.4697.99002321787750.469976782122529
5698.7398.45997338742680.270026612573204
5798.6698.7299847096638-0.0699847096638422
5898.1498.6600039629047-0.52000396290471
5998.3998.1400294453770.249970554623033
6097.7898.389985845344-0.609985845343999

\begin{tabular}{lllllllll}
\hline
Interpolation Forecasts of Exponential Smoothing \tabularnewline
t & Observed & Fitted & Residuals \tabularnewline
2 & 95 & 96.07 & -1.06999999999999 \tabularnewline
3 & 93.27 & 95.0000605890639 & -1.73006058906395 \tabularnewline
4 & 91.94 & 93.2700979651885 & -1.33009796518847 \tabularnewline
5 & 91.62 & 91.9400753171875 & -0.320075317187531 \tabularnewline
6 & 91.01 & 91.6200181243588 & -0.610018124358746 \tabularnewline
7 & 90.62 & 91.0100345424553 & -0.390034542455268 \tabularnewline
8 & 97.72 & 90.6200220858204 & 7.09997791417959 \tabularnewline
9 & 99.09 & 97.7195979616674 & 1.37040203833256 \tabularnewline
10 & 99.72 & 99.0899224005825 & 0.63007759941749 \tabularnewline
11 & 100.22 & 99.7199643216711 & 0.500035678328928 \tabularnewline
12 & 99.15 & 100.219971685333 & -1.069971685333 \tabularnewline
13 & 101.16 & 99.1500605874606 & 2.00993941253938 \tabularnewline
14 & 101.8 & 101.159886186591 & 0.640113813408973 \tabularnewline
15 & 103.31 & 101.799963753368 & 1.5100362466325 \tabularnewline
16 & 101.19 & 103.309914493754 & -2.11991449375448 \tabularnewline
17 & 99.09 & 101.19012004078 & -2.1001200407802 \tabularnewline
18 & 95.91 & 99.0901189199135 & -3.18011891991351 \tabularnewline
19 & 94.56 & 95.9101800751669 & -1.3501800751669 \tabularnewline
20 & 95.76 & 94.5600764543429 & 1.1999235456571 \tabularnewline
21 & 100.36 & 95.7599320539772 & 4.60006794602282 \tabularnewline
22 & 102.67 & 100.359739519803 & 2.31026048019713 \tabularnewline
23 & 103.58 & 102.669869180822 & 0.910130819177525 \tabularnewline
24 & 100.89 & 103.579948463575 & -2.68994846357532 \tabularnewline
25 & 103.46 & 100.890152319121 & 2.56984768087901 \tabularnewline
26 & 104.86 & 103.459854481621 & 1.40014551837895 \tabularnewline
27 & 104.88 & 104.859920716349 & 0.020079283650773 \tabularnewline
28 & 104.46 & 104.879998863005 & -0.419998863004679 \tabularnewline
29 & 103.83 & 104.460023782559 & -0.630023782558851 \tabularnewline
30 & 101 & 103.830035675282 & -2.83003567528154 \tabularnewline
31 & 99.36 & 101.0001602516 & -1.64016025160046 \tabularnewline
32 & 96.71 & 99.3600928745555 & -2.65009287455548 \tabularnewline
33 & 95.23 & 96.7101500622866 & -1.48015006228655 \tabularnewline
34 & 95.62 & 95.2300838139316 & 0.389916186068433 \tabularnewline
35 & 95.8 & 95.6199779208816 & 0.18002207911843 \tabularnewline
36 & 94.79 & 95.7999898061969 & -1.00998980619694 \tabularnewline
37 & 95.39 & 94.7900571909691 & 0.599942809030878 \tabularnewline
38 & 94.9 & 95.3899660280624 & -0.489966028062398 \tabularnewline
39 & 94.84 & 94.9000277444701 & -0.0600277444700907 \tabularnewline
40 & 94.68 & 94.8400033990886 & -0.160003399088637 \tabularnewline
41 & 94.17 & 94.6800090602394 & -0.510009060239426 \tabularnewline
42 & 94.1 & 94.1700288794127 & -0.0700288794126891 \tabularnewline
43 & 93.84 & 94.1000039654058 & -0.260003965405843 \tabularnewline
44 & 94.2 & 93.8400147228008 & 0.359985277199172 \tabularnewline
45 & 97.76 & 94.1999796157281 & 3.56002038427195 \tabularnewline
46 & 98.26 & 97.7597984128012 & 0.500201587198788 \tabularnewline
47 & 99.63 & 98.2599716759384 & 1.37002832406162 \tabularnewline
48 & 98.75 & 99.6299224217442 & -0.879922421744169 \tabularnewline
49 & 100.15 & 98.7500498258653 & 1.3999501741347 \tabularnewline
50 & 99.63 & 100.149920727411 & -0.51992072741065 \tabularnewline
51 & 99.72 & 99.6300294406637 & 0.0899705593362654 \tabularnewline
52 & 98.87 & 99.7199949053907 & -0.849994905390673 \tabularnewline
53 & 98.4 & 98.8700481312109 & -0.470048131210902 \tabularnewline
54 & 97.99 & 98.4000266166134 & -0.410026616613365 \tabularnewline
55 & 98.46 & 97.9900232178775 & 0.469976782122529 \tabularnewline
56 & 98.73 & 98.4599733874268 & 0.270026612573204 \tabularnewline
57 & 98.66 & 98.7299847096638 & -0.0699847096638422 \tabularnewline
58 & 98.14 & 98.6600039629047 & -0.52000396290471 \tabularnewline
59 & 98.39 & 98.140029445377 & 0.249970554623033 \tabularnewline
60 & 97.78 & 98.389985845344 & -0.609985845343999 \tabularnewline
\hline
\end{tabular}
%Source: https://freestatistics.org/blog/index.php?pk=&T=2

[TABLE]
[ROW][C]Interpolation Forecasts of Exponential Smoothing[/C][/ROW]
[ROW][C]t[/C][C]Observed[/C][C]Fitted[/C][C]Residuals[/C][/ROW]
[ROW][C]2[/C][C]95[/C][C]96.07[/C][C]-1.06999999999999[/C][/ROW]
[ROW][C]3[/C][C]93.27[/C][C]95.0000605890639[/C][C]-1.73006058906395[/C][/ROW]
[ROW][C]4[/C][C]91.94[/C][C]93.2700979651885[/C][C]-1.33009796518847[/C][/ROW]
[ROW][C]5[/C][C]91.62[/C][C]91.9400753171875[/C][C]-0.320075317187531[/C][/ROW]
[ROW][C]6[/C][C]91.01[/C][C]91.6200181243588[/C][C]-0.610018124358746[/C][/ROW]
[ROW][C]7[/C][C]90.62[/C][C]91.0100345424553[/C][C]-0.390034542455268[/C][/ROW]
[ROW][C]8[/C][C]97.72[/C][C]90.6200220858204[/C][C]7.09997791417959[/C][/ROW]
[ROW][C]9[/C][C]99.09[/C][C]97.7195979616674[/C][C]1.37040203833256[/C][/ROW]
[ROW][C]10[/C][C]99.72[/C][C]99.0899224005825[/C][C]0.63007759941749[/C][/ROW]
[ROW][C]11[/C][C]100.22[/C][C]99.7199643216711[/C][C]0.500035678328928[/C][/ROW]
[ROW][C]12[/C][C]99.15[/C][C]100.219971685333[/C][C]-1.069971685333[/C][/ROW]
[ROW][C]13[/C][C]101.16[/C][C]99.1500605874606[/C][C]2.00993941253938[/C][/ROW]
[ROW][C]14[/C][C]101.8[/C][C]101.159886186591[/C][C]0.640113813408973[/C][/ROW]
[ROW][C]15[/C][C]103.31[/C][C]101.799963753368[/C][C]1.5100362466325[/C][/ROW]
[ROW][C]16[/C][C]101.19[/C][C]103.309914493754[/C][C]-2.11991449375448[/C][/ROW]
[ROW][C]17[/C][C]99.09[/C][C]101.19012004078[/C][C]-2.1001200407802[/C][/ROW]
[ROW][C]18[/C][C]95.91[/C][C]99.0901189199135[/C][C]-3.18011891991351[/C][/ROW]
[ROW][C]19[/C][C]94.56[/C][C]95.9101800751669[/C][C]-1.3501800751669[/C][/ROW]
[ROW][C]20[/C][C]95.76[/C][C]94.5600764543429[/C][C]1.1999235456571[/C][/ROW]
[ROW][C]21[/C][C]100.36[/C][C]95.7599320539772[/C][C]4.60006794602282[/C][/ROW]
[ROW][C]22[/C][C]102.67[/C][C]100.359739519803[/C][C]2.31026048019713[/C][/ROW]
[ROW][C]23[/C][C]103.58[/C][C]102.669869180822[/C][C]0.910130819177525[/C][/ROW]
[ROW][C]24[/C][C]100.89[/C][C]103.579948463575[/C][C]-2.68994846357532[/C][/ROW]
[ROW][C]25[/C][C]103.46[/C][C]100.890152319121[/C][C]2.56984768087901[/C][/ROW]
[ROW][C]26[/C][C]104.86[/C][C]103.459854481621[/C][C]1.40014551837895[/C][/ROW]
[ROW][C]27[/C][C]104.88[/C][C]104.859920716349[/C][C]0.020079283650773[/C][/ROW]
[ROW][C]28[/C][C]104.46[/C][C]104.879998863005[/C][C]-0.419998863004679[/C][/ROW]
[ROW][C]29[/C][C]103.83[/C][C]104.460023782559[/C][C]-0.630023782558851[/C][/ROW]
[ROW][C]30[/C][C]101[/C][C]103.830035675282[/C][C]-2.83003567528154[/C][/ROW]
[ROW][C]31[/C][C]99.36[/C][C]101.0001602516[/C][C]-1.64016025160046[/C][/ROW]
[ROW][C]32[/C][C]96.71[/C][C]99.3600928745555[/C][C]-2.65009287455548[/C][/ROW]
[ROW][C]33[/C][C]95.23[/C][C]96.7101500622866[/C][C]-1.48015006228655[/C][/ROW]
[ROW][C]34[/C][C]95.62[/C][C]95.2300838139316[/C][C]0.389916186068433[/C][/ROW]
[ROW][C]35[/C][C]95.8[/C][C]95.6199779208816[/C][C]0.18002207911843[/C][/ROW]
[ROW][C]36[/C][C]94.79[/C][C]95.7999898061969[/C][C]-1.00998980619694[/C][/ROW]
[ROW][C]37[/C][C]95.39[/C][C]94.7900571909691[/C][C]0.599942809030878[/C][/ROW]
[ROW][C]38[/C][C]94.9[/C][C]95.3899660280624[/C][C]-0.489966028062398[/C][/ROW]
[ROW][C]39[/C][C]94.84[/C][C]94.9000277444701[/C][C]-0.0600277444700907[/C][/ROW]
[ROW][C]40[/C][C]94.68[/C][C]94.8400033990886[/C][C]-0.160003399088637[/C][/ROW]
[ROW][C]41[/C][C]94.17[/C][C]94.6800090602394[/C][C]-0.510009060239426[/C][/ROW]
[ROW][C]42[/C][C]94.1[/C][C]94.1700288794127[/C][C]-0.0700288794126891[/C][/ROW]
[ROW][C]43[/C][C]93.84[/C][C]94.1000039654058[/C][C]-0.260003965405843[/C][/ROW]
[ROW][C]44[/C][C]94.2[/C][C]93.8400147228008[/C][C]0.359985277199172[/C][/ROW]
[ROW][C]45[/C][C]97.76[/C][C]94.1999796157281[/C][C]3.56002038427195[/C][/ROW]
[ROW][C]46[/C][C]98.26[/C][C]97.7597984128012[/C][C]0.500201587198788[/C][/ROW]
[ROW][C]47[/C][C]99.63[/C][C]98.2599716759384[/C][C]1.37002832406162[/C][/ROW]
[ROW][C]48[/C][C]98.75[/C][C]99.6299224217442[/C][C]-0.879922421744169[/C][/ROW]
[ROW][C]49[/C][C]100.15[/C][C]98.7500498258653[/C][C]1.3999501741347[/C][/ROW]
[ROW][C]50[/C][C]99.63[/C][C]100.149920727411[/C][C]-0.51992072741065[/C][/ROW]
[ROW][C]51[/C][C]99.72[/C][C]99.6300294406637[/C][C]0.0899705593362654[/C][/ROW]
[ROW][C]52[/C][C]98.87[/C][C]99.7199949053907[/C][C]-0.849994905390673[/C][/ROW]
[ROW][C]53[/C][C]98.4[/C][C]98.8700481312109[/C][C]-0.470048131210902[/C][/ROW]
[ROW][C]54[/C][C]97.99[/C][C]98.4000266166134[/C][C]-0.410026616613365[/C][/ROW]
[ROW][C]55[/C][C]98.46[/C][C]97.9900232178775[/C][C]0.469976782122529[/C][/ROW]
[ROW][C]56[/C][C]98.73[/C][C]98.4599733874268[/C][C]0.270026612573204[/C][/ROW]
[ROW][C]57[/C][C]98.66[/C][C]98.7299847096638[/C][C]-0.0699847096638422[/C][/ROW]
[ROW][C]58[/C][C]98.14[/C][C]98.6600039629047[/C][C]-0.52000396290471[/C][/ROW]
[ROW][C]59[/C][C]98.39[/C][C]98.140029445377[/C][C]0.249970554623033[/C][/ROW]
[ROW][C]60[/C][C]97.78[/C][C]98.389985845344[/C][C]-0.609985845343999[/C][/ROW]
[/TABLE]
Source: https://freestatistics.org/blog/index.php?pk=&T=2

Globally Unique Identifier (entire table): ba.freestatistics.org/blog/index.php?pk=&T=2

As an alternative you can also use a QR Code:  

The GUIDs for individual cells are displayed in the table below:

Interpolation Forecasts of Exponential Smoothing
tObservedFittedResiduals
29596.07-1.06999999999999
393.2795.0000605890639-1.73006058906395
491.9493.2700979651885-1.33009796518847
591.6291.9400753171875-0.320075317187531
691.0191.6200181243588-0.610018124358746
790.6291.0100345424553-0.390034542455268
897.7290.62002208582047.09997791417959
999.0997.71959796166741.37040203833256
1099.7299.08992240058250.63007759941749
11100.2299.71996432167110.500035678328928
1299.15100.219971685333-1.069971685333
13101.1699.15006058746062.00993941253938
14101.8101.1598861865910.640113813408973
15103.31101.7999637533681.5100362466325
16101.19103.309914493754-2.11991449375448
1799.09101.19012004078-2.1001200407802
1895.9199.0901189199135-3.18011891991351
1994.5695.9101800751669-1.3501800751669
2095.7694.56007645434291.1999235456571
21100.3695.75993205397724.60006794602282
22102.67100.3597395198032.31026048019713
23103.58102.6698691808220.910130819177525
24100.89103.579948463575-2.68994846357532
25103.46100.8901523191212.56984768087901
26104.86103.4598544816211.40014551837895
27104.88104.8599207163490.020079283650773
28104.46104.879998863005-0.419998863004679
29103.83104.460023782559-0.630023782558851
30101103.830035675282-2.83003567528154
3199.36101.0001602516-1.64016025160046
3296.7199.3600928745555-2.65009287455548
3395.2396.7101500622866-1.48015006228655
3495.6295.23008381393160.389916186068433
3595.895.61997792088160.18002207911843
3694.7995.7999898061969-1.00998980619694
3795.3994.79005719096910.599942809030878
3894.995.3899660280624-0.489966028062398
3994.8494.9000277444701-0.0600277444700907
4094.6894.8400033990886-0.160003399088637
4194.1794.6800090602394-0.510009060239426
4294.194.1700288794127-0.0700288794126891
4393.8494.1000039654058-0.260003965405843
4494.293.84001472280080.359985277199172
4597.7694.19997961572813.56002038427195
4698.2697.75979841280120.500201587198788
4799.6398.25997167593841.37002832406162
4898.7599.6299224217442-0.879922421744169
49100.1598.75004982586531.3999501741347
5099.63100.149920727411-0.51992072741065
5199.7299.63002944066370.0899705593362654
5298.8799.7199949053907-0.849994905390673
5398.498.8700481312109-0.470048131210902
5497.9998.4000266166134-0.410026616613365
5598.4697.99002321787750.469976782122529
5698.7398.45997338742680.270026612573204
5798.6698.7299847096638-0.0699847096638422
5898.1498.6600039629047-0.52000396290471
5998.3998.1400294453770.249970554623033
6097.7898.389985845344-0.609985845343999


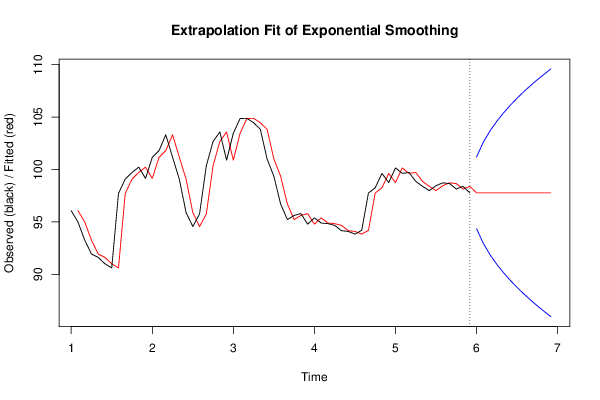
Extrapolation Forecasts of Exponential Smoothing
tForecast95% Lower Bound95% Upper Bound
6197.780034540627594.3715291625548101.1885399187
6297.780034540627592.9598164825983102.600252598657
6397.780034540627591.8765529118299103.683516169425
6497.780034540627590.9633132938586104.596755787396
6597.780034540627590.1587300741499105.401339007105
6697.780034540627589.4313295521067106.128739529148
6797.780034540627588.7624146661844106.797654415071
6897.780034540627588.139803142235107.42026593902
6997.780034540627587.5550330917693108.005035989486
7097.780034540627587.0019434367375108.558125644517
7197.780034540627586.4758830440156109.084186037239
7297.780034540627585.9732384352925109.586830645962

\begin{tabular}{lllllllll}
\hline
Extrapolation Forecasts of Exponential Smoothing \tabularnewline
t & Forecast & 95% Lower Bound & 95% Upper Bound \tabularnewline
61 & 97.7800345406275 & 94.3715291625548 & 101.1885399187 \tabularnewline
62 & 97.7800345406275 & 92.9598164825983 & 102.600252598657 \tabularnewline
63 & 97.7800345406275 & 91.8765529118299 & 103.683516169425 \tabularnewline
64 & 97.7800345406275 & 90.9633132938586 & 104.596755787396 \tabularnewline
65 & 97.7800345406275 & 90.1587300741499 & 105.401339007105 \tabularnewline
66 & 97.7800345406275 & 89.4313295521067 & 106.128739529148 \tabularnewline
67 & 97.7800345406275 & 88.7624146661844 & 106.797654415071 \tabularnewline
68 & 97.7800345406275 & 88.139803142235 & 107.42026593902 \tabularnewline
69 & 97.7800345406275 & 87.5550330917693 & 108.005035989486 \tabularnewline
70 & 97.7800345406275 & 87.0019434367375 & 108.558125644517 \tabularnewline
71 & 97.7800345406275 & 86.4758830440156 & 109.084186037239 \tabularnewline
72 & 97.7800345406275 & 85.9732384352925 & 109.586830645962 \tabularnewline
\hline
\end{tabular}
%Source: https://freestatistics.org/blog/index.php?pk=&T=3

[TABLE]
[ROW][C]Extrapolation Forecasts of Exponential Smoothing[/C][/ROW]
[ROW][C]t[/C][C]Forecast[/C][C]95% Lower Bound[/C][C]95% Upper Bound[/C][/ROW]
[ROW][C]61[/C][C]97.7800345406275[/C][C]94.3715291625548[/C][C]101.1885399187[/C][/ROW]
[ROW][C]62[/C][C]97.7800345406275[/C][C]92.9598164825983[/C][C]102.600252598657[/C][/ROW]
[ROW][C]63[/C][C]97.7800345406275[/C][C]91.8765529118299[/C][C]103.683516169425[/C][/ROW]
[ROW][C]64[/C][C]97.7800345406275[/C][C]90.9633132938586[/C][C]104.596755787396[/C][/ROW]
[ROW][C]65[/C][C]97.7800345406275[/C][C]90.1587300741499[/C][C]105.401339007105[/C][/ROW]
[ROW][C]66[/C][C]97.7800345406275[/C][C]89.4313295521067[/C][C]106.128739529148[/C][/ROW]
[ROW][C]67[/C][C]97.7800345406275[/C][C]88.7624146661844[/C][C]106.797654415071[/C][/ROW]
[ROW][C]68[/C][C]97.7800345406275[/C][C]88.139803142235[/C][C]107.42026593902[/C][/ROW]
[ROW][C]69[/C][C]97.7800345406275[/C][C]87.5550330917693[/C][C]108.005035989486[/C][/ROW]
[ROW][C]70[/C][C]97.7800345406275[/C][C]87.0019434367375[/C][C]108.558125644517[/C][/ROW]
[ROW][C]71[/C][C]97.7800345406275[/C][C]86.4758830440156[/C][C]109.084186037239[/C][/ROW]
[ROW][C]72[/C][C]97.7800345406275[/C][C]85.9732384352925[/C][C]109.586830645962[/C][/ROW]
[/TABLE]
Source: https://freestatistics.org/blog/index.php?pk=&T=3

Globally Unique Identifier (entire table): ba.freestatistics.org/blog/index.php?pk=&T=3

As an alternative you can also use a QR Code:  

The GUIDs for individual cells are displayed in the table below:

Extrapolation Forecasts of Exponential Smoothing
tForecast95% Lower Bound95% Upper Bound
6197.780034540627594.3715291625548101.1885399187
6297.780034540627592.9598164825983102.600252598657
6397.780034540627591.8765529118299103.683516169425
6497.780034540627590.9633132938586104.596755787396
6597.780034540627590.1587300741499105.401339007105
6697.780034540627589.4313295521067106.128739529148
6797.780034540627588.7624146661844106.797654415071
6897.780034540627588.139803142235107.42026593902
6997.780034540627587.5550330917693108.005035989486
7097.780034540627587.0019434367375108.558125644517
7197.780034540627586.4758830440156109.084186037239
7297.780034540627585.9732384352925109.586830645962


Parameters (Session):
par1 = 12 ; par2 = Single ; par3 = additive ;
Parameters (R input):
par1 = 12 ; par2 = Single ; par3 = additive ;
R code (references can be found in the software module):
par3 <- 'additive'
par2 <- 'Triple'
par1 <- '12'
par1 <- as.numeric(par1)
if (par2 == 'Single') K <- 1
if (par2 == 'Double') K <- 2
if (par2 == 'Triple') K <- par1
nx <- length(x)
nxmK <- nx - K
x <- ts(x, frequency = par1)
if (par2 == 'Single') fit <- HoltWinters(x, gamma=F, beta=F)
if (par2 == 'Double') fit <- HoltWinters(x, gamma=F)
if (par2 == 'Triple') fit <- HoltWinters(x, seasonal=par3)
fit
myresid <- x - fit$fitted[,'xhat']
bitmap(file='test1.png')
op <- par(mfrow=c(2,1))
plot(fit,ylab='Observed (black) / Fitted (red)',main='Interpolation Fit of Exponential Smoothing')
plot(myresid,ylab='Residuals',main='Interpolation Prediction Errors')
par(op)
dev.off()
bitmap(file='test2.png')
p <- predict(fit, par1, prediction.interval=TRUE)
np <- length(p[,1])
plot(fit,p,ylab='Observed (black) / Fitted (red)',main='Extrapolation Fit of Exponential Smoothing')
dev.off()
bitmap(file='test3.png')
op <- par(mfrow = c(2,2))
acf(as.numeric(myresid),lag.max = nx/2,main='Residual ACF')
spectrum(myresid,main='Residals Periodogram')
cpgram(myresid,main='Residal Cumulative Periodogram')
qqnorm(myresid,main='Residual Normal QQ Plot')
qqline(myresid)
par(op)
dev.off()
load(file='createtable')
a<-table.start()
a<-table.row.start(a)
a<-table.element(a,'Estimated Parameters of Exponential Smoothing',2,TRUE)
a<-table.row.end(a)
a<-table.row.start(a)
a<-table.element(a,'Parameter',header=TRUE)
a<-table.element(a,'Value',header=TRUE)
a<-table.row.end(a)
a<-table.row.start(a)
a<-table.element(a,'alpha',header=TRUE)
a<-table.element(a,fit$alpha)
a<-table.row.end(a)
a<-table.row.start(a)
a<-table.element(a,'beta',header=TRUE)
a<-table.element(a,fit$beta)
a<-table.row.end(a)
a<-table.row.start(a)
a<-table.element(a,'gamma',header=TRUE)
a<-table.element(a,fit$gamma)
a<-table.row.end(a)
a<-table.end(a)
table.save(a,file='mytable.tab')
a<-table.start()
a<-table.row.start(a)
a<-table.element(a,'Interpolation Forecasts of Exponential Smoothing',4,TRUE)
a<-table.row.end(a)
a<-table.row.start(a)
a<-table.element(a,'t',header=TRUE)
a<-table.element(a,'Observed',header=TRUE)
a<-table.element(a,'Fitted',header=TRUE)
a<-table.element(a,'Residuals',header=TRUE)
a<-table.row.end(a)
for (i in 1:nxmK) {
a<-table.row.start(a)
a<-table.element(a,i+K,header=TRUE)
a<-table.element(a,x[i+K])
a<-table.element(a,fit$fitted[i,'xhat'])
a<-table.element(a,myresid[i])
a<-table.row.end(a)
}
a<-table.end(a)
table.save(a,file='mytable1.tab')
a<-table.start()
a<-table.row.start(a)
a<-table.element(a,'Extrapolation Forecasts of Exponential Smoothing',4,TRUE)
a<-table.row.end(a)
a<-table.row.start(a)
a<-table.element(a,'t',header=TRUE)
a<-table.element(a,'Forecast',header=TRUE)
a<-table.element(a,'95% Lower Bound',header=TRUE)
a<-table.element(a,'95% Upper Bound',header=TRUE)
a<-table.row.end(a)
for (i in 1:np) {
a<-table.row.start(a)
a<-table.element(a,nx+i,header=TRUE)
a<-table.element(a,p[i,'fit'])
a<-table.element(a,p[i,'lwr'])
a<-table.element(a,p[i,'upr'])
a<-table.row.end(a)
}
a<-table.end(a)
table.save(a,file='mytable2.tab')