Free Statistics

of Irreproducible Research!

Author's title

Author*Unverified author*
R Software Modulerwasp_exponentialsmoothing.wasp
Title produced by softwareExponential Smoothing
Date of computationThu, 24 Nov 2016 18:02:26 +0000
Cite this page as followsStatistical Computations at FreeStatistics.org, Office for Research Development and Education, URL https://freestatistics.org/blog/index.php?v=date/2016/Nov/24/t14800105779yz8qi9d67ghz6t.htm/, Retrieved Sat, 18 May 2024 22:38:18 +0200
Statistical Computations at FreeStatistics.org, Office for Research Development and Education, URL https://freestatistics.org/blog/index.php?pk=, Retrieved Sat, 18 May 2024 22:38:18 +0200
QR Codes:

Original text written by user:
IsPrivate?No (this computation is public)
User-defined keywords
Estimated Impact0
Dataseries X:
134.93
134.37
132.98
130.1
128.24
127.52
126.94
127.38
130.95
128.65
127.37
127.04
125.95
124.06
121.55
119.82
119.19
118.77
118.31
119.47
119.79
117.46
115.74
114.97
112.83
111.44
110.6
109.67
107.96
107.56
116.12
114.38
113.96
113.95
114.99
113.64
112.53
110.59
110.1
109.38
110.43
114.67
114.48
114.76
113.27
111.56
109.89
108.04
107.53
106.11
104.11
103
104.74
104.14
101.98
100.91
100.02
98.49
97.38
95.86
93.99
94.09
93.44
93.61
98.31
103.97
104.12
107.63
105.22
104.59
101.54
99.47


Summary of computational transaction
Raw Inputview raw input (R code)
Raw Outputview raw output of R engine
Computing time1 seconds
R Server'Gwilym Jenkins' @ jenkins.wessa.net

\begin{tabular}{lllllllll}
\hline
Summary of computational transaction \tabularnewline
Raw Input & view raw input (R code)  \tabularnewline
Raw Output & view raw output of R engine  \tabularnewline
Computing time & 1 seconds \tabularnewline
R Server & 'Gwilym Jenkins' @ jenkins.wessa.net \tabularnewline
\hline
\end{tabular}
%Source: https://freestatistics.org/blog/index.php?pk=&T=0

[TABLE]
[ROW][C]Summary of computational transaction[/C][/ROW]
[ROW][C]Raw Input[/C][C]view raw input (R code) [/C][/ROW]
[ROW][C]Raw Output[/C][C]view raw output of R engine [/C][/ROW]
[ROW][C]Computing time[/C][C]1 seconds[/C][/ROW]
[ROW][C]R Server[/C][C]'Gwilym Jenkins' @ jenkins.wessa.net[/C][/ROW]
[/TABLE]
Source: https://freestatistics.org/blog/index.php?pk=&T=0

Globally Unique Identifier (entire table): ba.freestatistics.org/blog/index.php?pk=&T=0

As an alternative you can also use a QR Code:  

The GUIDs for individual cells are displayed in the table below:

Summary of computational transaction
Raw Inputview raw input (R code)
Raw Outputview raw output of R engine
Computing time1 seconds
R Server'Gwilym Jenkins' @ jenkins.wessa.net


Estimated Parameters of Exponential Smoothing
ParameterValue
alpha0.78994047529356
beta0.0055896265913631
gamma1

\begin{tabular}{lllllllll}
\hline
Estimated Parameters of Exponential Smoothing \tabularnewline
Parameter & Value \tabularnewline
alpha & 0.78994047529356 \tabularnewline
beta & 0.0055896265913631 \tabularnewline
gamma & 1 \tabularnewline
\hline
\end{tabular}
%Source: https://freestatistics.org/blog/index.php?pk=&T=1

[TABLE]
[ROW][C]Estimated Parameters of Exponential Smoothing[/C][/ROW]
[ROW][C]Parameter[/C][C]Value[/C][/ROW]
[ROW][C]alpha[/C][C]0.78994047529356[/C][/ROW]
[ROW][C]beta[/C][C]0.0055896265913631[/C][/ROW]
[ROW][C]gamma[/C][C]1[/C][/ROW]
[/TABLE]
Source: https://freestatistics.org/blog/index.php?pk=&T=1

Globally Unique Identifier (entire table): ba.freestatistics.org/blog/index.php?pk=&T=1

As an alternative you can also use a QR Code:  

The GUIDs for individual cells are displayed in the table below:

Estimated Parameters of Exponential Smoothing
ParameterValue
alpha0.78994047529356
beta0.0055896265913631
gamma1


Interpolation Forecasts of Exponential Smoothing
tObservedFittedResiduals
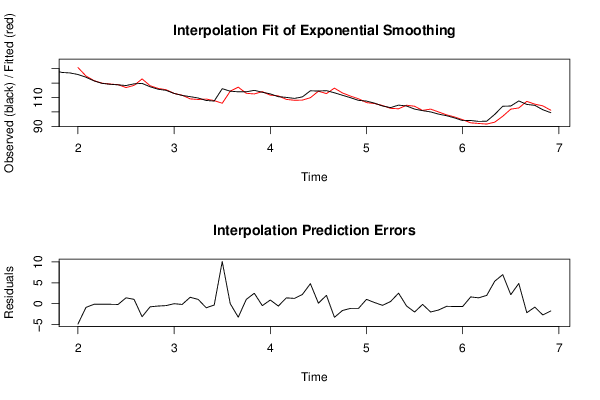
13125.95130.801861645299-4.85186164529914
14124.06124.929602352992-0.869602352992004
15121.55121.684667820369-0.134667820369131
16119.82119.936359866394-0.116359866394006
17119.19119.321583655852-0.131583655851657
18118.77118.94086722051-0.170867220510331
19118.31116.8921146479541.41788535204552
20119.47118.4171426711641.05285732883561
21119.79122.890552479915-3.10055247991457
22117.46118.198075366704-0.738075366704493
23115.74116.28938892918-0.549388929180168
24114.97115.413577734204-0.443577734204055
25112.83112.8227127285340.00728727146638164
26111.44111.608727661834-0.168727661833685
27110.6109.0582414338291.54175856617086
28109.67108.6318775301431.03812246985741
29107.96108.9247945614-0.964794561399884
30107.56107.872879019088-0.312879019087816
31116.12106.04029093867110.0797090613286
32114.38114.3638252787160.016174721283619
33113.96117.174135594143-3.21413559414289
34113.95112.9159752268831.03402477311673
35114.99112.4823822841772.50761771582349
36113.64114.09275363349-0.452753633489962
37112.53111.638410799280.891589200720205
38110.59111.138964713214-0.548964713214247
39110.1108.6987055535941.40129444640627
40109.38108.1062573633381.27374263666174
41110.43108.216276441832.2137235581698
42114.67109.8778846815484.79211531845166
43114.48114.3492839271210.130716072878712
44114.76112.7441188340042.01588116599557
45113.27116.508704464852-3.23870446485219
46111.56113.176577922193-1.61657792219331
47109.89111.000080419335-1.11008041933457
48108.04109.156229099485-1.11622909948518
49107.53106.4826403133691.04735968663103
50106.11105.826797525020.283202474979831
51104.11104.480401789361-0.370401789361395
52103102.480633052060.519366947939588
53104.74102.2078687531542.53213124684564
54104.14104.679698348895-0.539698348895072
55101.98103.953650873853-1.97365087385261
56100.91101.0664062761-0.156406276099773
57100.02101.985894935325-1.96589493532461
5898.4999.9802319061522-1.49023190615218
5997.3897.9907693555129-0.610769355512858
6095.8696.5230916556136-0.663091655613613
6193.9994.6469769148852-0.656976914885163
6294.0992.46180571529431.62819428470574
6393.4492.02403097652411.4159690234759
6493.6191.6136342456011.99636575439902
6598.3192.92827404452725.38172595547282
66103.9797.01629172707296.95370827292712
67104.12101.9519059370032.16809406299657
68107.63102.7799424820824.85005751791815
69105.22107.358064747102-2.13806474710221
70104.59105.399480698306-0.809480698306373
71101.54104.218681737321-2.67868173732096
7299.47101.183525911955-1.71352591195485

\begin{tabular}{lllllllll}
\hline
Interpolation Forecasts of Exponential Smoothing \tabularnewline
t & Observed & Fitted & Residuals \tabularnewline
13 & 125.95 & 130.801861645299 & -4.85186164529914 \tabularnewline
14 & 124.06 & 124.929602352992 & -0.869602352992004 \tabularnewline
15 & 121.55 & 121.684667820369 & -0.134667820369131 \tabularnewline
16 & 119.82 & 119.936359866394 & -0.116359866394006 \tabularnewline
17 & 119.19 & 119.321583655852 & -0.131583655851657 \tabularnewline
18 & 118.77 & 118.94086722051 & -0.170867220510331 \tabularnewline
19 & 118.31 & 116.892114647954 & 1.41788535204552 \tabularnewline
20 & 119.47 & 118.417142671164 & 1.05285732883561 \tabularnewline
21 & 119.79 & 122.890552479915 & -3.10055247991457 \tabularnewline
22 & 117.46 & 118.198075366704 & -0.738075366704493 \tabularnewline
23 & 115.74 & 116.28938892918 & -0.549388929180168 \tabularnewline
24 & 114.97 & 115.413577734204 & -0.443577734204055 \tabularnewline
25 & 112.83 & 112.822712728534 & 0.00728727146638164 \tabularnewline
26 & 111.44 & 111.608727661834 & -0.168727661833685 \tabularnewline
27 & 110.6 & 109.058241433829 & 1.54175856617086 \tabularnewline
28 & 109.67 & 108.631877530143 & 1.03812246985741 \tabularnewline
29 & 107.96 & 108.9247945614 & -0.964794561399884 \tabularnewline
30 & 107.56 & 107.872879019088 & -0.312879019087816 \tabularnewline
31 & 116.12 & 106.040290938671 & 10.0797090613286 \tabularnewline
32 & 114.38 & 114.363825278716 & 0.016174721283619 \tabularnewline
33 & 113.96 & 117.174135594143 & -3.21413559414289 \tabularnewline
34 & 113.95 & 112.915975226883 & 1.03402477311673 \tabularnewline
35 & 114.99 & 112.482382284177 & 2.50761771582349 \tabularnewline
36 & 113.64 & 114.09275363349 & -0.452753633489962 \tabularnewline
37 & 112.53 & 111.63841079928 & 0.891589200720205 \tabularnewline
38 & 110.59 & 111.138964713214 & -0.548964713214247 \tabularnewline
39 & 110.1 & 108.698705553594 & 1.40129444640627 \tabularnewline
40 & 109.38 & 108.106257363338 & 1.27374263666174 \tabularnewline
41 & 110.43 & 108.21627644183 & 2.2137235581698 \tabularnewline
42 & 114.67 & 109.877884681548 & 4.79211531845166 \tabularnewline
43 & 114.48 & 114.349283927121 & 0.130716072878712 \tabularnewline
44 & 114.76 & 112.744118834004 & 2.01588116599557 \tabularnewline
45 & 113.27 & 116.508704464852 & -3.23870446485219 \tabularnewline
46 & 111.56 & 113.176577922193 & -1.61657792219331 \tabularnewline
47 & 109.89 & 111.000080419335 & -1.11008041933457 \tabularnewline
48 & 108.04 & 109.156229099485 & -1.11622909948518 \tabularnewline
49 & 107.53 & 106.482640313369 & 1.04735968663103 \tabularnewline
50 & 106.11 & 105.82679752502 & 0.283202474979831 \tabularnewline
51 & 104.11 & 104.480401789361 & -0.370401789361395 \tabularnewline
52 & 103 & 102.48063305206 & 0.519366947939588 \tabularnewline
53 & 104.74 & 102.207868753154 & 2.53213124684564 \tabularnewline
54 & 104.14 & 104.679698348895 & -0.539698348895072 \tabularnewline
55 & 101.98 & 103.953650873853 & -1.97365087385261 \tabularnewline
56 & 100.91 & 101.0664062761 & -0.156406276099773 \tabularnewline
57 & 100.02 & 101.985894935325 & -1.96589493532461 \tabularnewline
58 & 98.49 & 99.9802319061522 & -1.49023190615218 \tabularnewline
59 & 97.38 & 97.9907693555129 & -0.610769355512858 \tabularnewline
60 & 95.86 & 96.5230916556136 & -0.663091655613613 \tabularnewline
61 & 93.99 & 94.6469769148852 & -0.656976914885163 \tabularnewline
62 & 94.09 & 92.4618057152943 & 1.62819428470574 \tabularnewline
63 & 93.44 & 92.0240309765241 & 1.4159690234759 \tabularnewline
64 & 93.61 & 91.613634245601 & 1.99636575439902 \tabularnewline
65 & 98.31 & 92.9282740445272 & 5.38172595547282 \tabularnewline
66 & 103.97 & 97.0162917270729 & 6.95370827292712 \tabularnewline
67 & 104.12 & 101.951905937003 & 2.16809406299657 \tabularnewline
68 & 107.63 & 102.779942482082 & 4.85005751791815 \tabularnewline
69 & 105.22 & 107.358064747102 & -2.13806474710221 \tabularnewline
70 & 104.59 & 105.399480698306 & -0.809480698306373 \tabularnewline
71 & 101.54 & 104.218681737321 & -2.67868173732096 \tabularnewline
72 & 99.47 & 101.183525911955 & -1.71352591195485 \tabularnewline
\hline
\end{tabular}
%Source: https://freestatistics.org/blog/index.php?pk=&T=2

[TABLE]
[ROW][C]Interpolation Forecasts of Exponential Smoothing[/C][/ROW]
[ROW][C]t[/C][C]Observed[/C][C]Fitted[/C][C]Residuals[/C][/ROW]
[ROW][C]13[/C][C]125.95[/C][C]130.801861645299[/C][C]-4.85186164529914[/C][/ROW]
[ROW][C]14[/C][C]124.06[/C][C]124.929602352992[/C][C]-0.869602352992004[/C][/ROW]
[ROW][C]15[/C][C]121.55[/C][C]121.684667820369[/C][C]-0.134667820369131[/C][/ROW]
[ROW][C]16[/C][C]119.82[/C][C]119.936359866394[/C][C]-0.116359866394006[/C][/ROW]
[ROW][C]17[/C][C]119.19[/C][C]119.321583655852[/C][C]-0.131583655851657[/C][/ROW]
[ROW][C]18[/C][C]118.77[/C][C]118.94086722051[/C][C]-0.170867220510331[/C][/ROW]
[ROW][C]19[/C][C]118.31[/C][C]116.892114647954[/C][C]1.41788535204552[/C][/ROW]
[ROW][C]20[/C][C]119.47[/C][C]118.417142671164[/C][C]1.05285732883561[/C][/ROW]
[ROW][C]21[/C][C]119.79[/C][C]122.890552479915[/C][C]-3.10055247991457[/C][/ROW]
[ROW][C]22[/C][C]117.46[/C][C]118.198075366704[/C][C]-0.738075366704493[/C][/ROW]
[ROW][C]23[/C][C]115.74[/C][C]116.28938892918[/C][C]-0.549388929180168[/C][/ROW]
[ROW][C]24[/C][C]114.97[/C][C]115.413577734204[/C][C]-0.443577734204055[/C][/ROW]
[ROW][C]25[/C][C]112.83[/C][C]112.822712728534[/C][C]0.00728727146638164[/C][/ROW]
[ROW][C]26[/C][C]111.44[/C][C]111.608727661834[/C][C]-0.168727661833685[/C][/ROW]
[ROW][C]27[/C][C]110.6[/C][C]109.058241433829[/C][C]1.54175856617086[/C][/ROW]
[ROW][C]28[/C][C]109.67[/C][C]108.631877530143[/C][C]1.03812246985741[/C][/ROW]
[ROW][C]29[/C][C]107.96[/C][C]108.9247945614[/C][C]-0.964794561399884[/C][/ROW]
[ROW][C]30[/C][C]107.56[/C][C]107.872879019088[/C][C]-0.312879019087816[/C][/ROW]
[ROW][C]31[/C][C]116.12[/C][C]106.040290938671[/C][C]10.0797090613286[/C][/ROW]
[ROW][C]32[/C][C]114.38[/C][C]114.363825278716[/C][C]0.016174721283619[/C][/ROW]
[ROW][C]33[/C][C]113.96[/C][C]117.174135594143[/C][C]-3.21413559414289[/C][/ROW]
[ROW][C]34[/C][C]113.95[/C][C]112.915975226883[/C][C]1.03402477311673[/C][/ROW]
[ROW][C]35[/C][C]114.99[/C][C]112.482382284177[/C][C]2.50761771582349[/C][/ROW]
[ROW][C]36[/C][C]113.64[/C][C]114.09275363349[/C][C]-0.452753633489962[/C][/ROW]
[ROW][C]37[/C][C]112.53[/C][C]111.63841079928[/C][C]0.891589200720205[/C][/ROW]
[ROW][C]38[/C][C]110.59[/C][C]111.138964713214[/C][C]-0.548964713214247[/C][/ROW]
[ROW][C]39[/C][C]110.1[/C][C]108.698705553594[/C][C]1.40129444640627[/C][/ROW]
[ROW][C]40[/C][C]109.38[/C][C]108.106257363338[/C][C]1.27374263666174[/C][/ROW]
[ROW][C]41[/C][C]110.43[/C][C]108.21627644183[/C][C]2.2137235581698[/C][/ROW]
[ROW][C]42[/C][C]114.67[/C][C]109.877884681548[/C][C]4.79211531845166[/C][/ROW]
[ROW][C]43[/C][C]114.48[/C][C]114.349283927121[/C][C]0.130716072878712[/C][/ROW]
[ROW][C]44[/C][C]114.76[/C][C]112.744118834004[/C][C]2.01588116599557[/C][/ROW]
[ROW][C]45[/C][C]113.27[/C][C]116.508704464852[/C][C]-3.23870446485219[/C][/ROW]
[ROW][C]46[/C][C]111.56[/C][C]113.176577922193[/C][C]-1.61657792219331[/C][/ROW]
[ROW][C]47[/C][C]109.89[/C][C]111.000080419335[/C][C]-1.11008041933457[/C][/ROW]
[ROW][C]48[/C][C]108.04[/C][C]109.156229099485[/C][C]-1.11622909948518[/C][/ROW]
[ROW][C]49[/C][C]107.53[/C][C]106.482640313369[/C][C]1.04735968663103[/C][/ROW]
[ROW][C]50[/C][C]106.11[/C][C]105.82679752502[/C][C]0.283202474979831[/C][/ROW]
[ROW][C]51[/C][C]104.11[/C][C]104.480401789361[/C][C]-0.370401789361395[/C][/ROW]
[ROW][C]52[/C][C]103[/C][C]102.48063305206[/C][C]0.519366947939588[/C][/ROW]
[ROW][C]53[/C][C]104.74[/C][C]102.207868753154[/C][C]2.53213124684564[/C][/ROW]
[ROW][C]54[/C][C]104.14[/C][C]104.679698348895[/C][C]-0.539698348895072[/C][/ROW]
[ROW][C]55[/C][C]101.98[/C][C]103.953650873853[/C][C]-1.97365087385261[/C][/ROW]
[ROW][C]56[/C][C]100.91[/C][C]101.0664062761[/C][C]-0.156406276099773[/C][/ROW]
[ROW][C]57[/C][C]100.02[/C][C]101.985894935325[/C][C]-1.96589493532461[/C][/ROW]
[ROW][C]58[/C][C]98.49[/C][C]99.9802319061522[/C][C]-1.49023190615218[/C][/ROW]
[ROW][C]59[/C][C]97.38[/C][C]97.9907693555129[/C][C]-0.610769355512858[/C][/ROW]
[ROW][C]60[/C][C]95.86[/C][C]96.5230916556136[/C][C]-0.663091655613613[/C][/ROW]
[ROW][C]61[/C][C]93.99[/C][C]94.6469769148852[/C][C]-0.656976914885163[/C][/ROW]
[ROW][C]62[/C][C]94.09[/C][C]92.4618057152943[/C][C]1.62819428470574[/C][/ROW]
[ROW][C]63[/C][C]93.44[/C][C]92.0240309765241[/C][C]1.4159690234759[/C][/ROW]
[ROW][C]64[/C][C]93.61[/C][C]91.613634245601[/C][C]1.99636575439902[/C][/ROW]
[ROW][C]65[/C][C]98.31[/C][C]92.9282740445272[/C][C]5.38172595547282[/C][/ROW]
[ROW][C]66[/C][C]103.97[/C][C]97.0162917270729[/C][C]6.95370827292712[/C][/ROW]
[ROW][C]67[/C][C]104.12[/C][C]101.951905937003[/C][C]2.16809406299657[/C][/ROW]
[ROW][C]68[/C][C]107.63[/C][C]102.779942482082[/C][C]4.85005751791815[/C][/ROW]
[ROW][C]69[/C][C]105.22[/C][C]107.358064747102[/C][C]-2.13806474710221[/C][/ROW]
[ROW][C]70[/C][C]104.59[/C][C]105.399480698306[/C][C]-0.809480698306373[/C][/ROW]
[ROW][C]71[/C][C]101.54[/C][C]104.218681737321[/C][C]-2.67868173732096[/C][/ROW]
[ROW][C]72[/C][C]99.47[/C][C]101.183525911955[/C][C]-1.71352591195485[/C][/ROW]
[/TABLE]
Source: https://freestatistics.org/blog/index.php?pk=&T=2

Globally Unique Identifier (entire table): ba.freestatistics.org/blog/index.php?pk=&T=2

As an alternative you can also use a QR Code:  

The GUIDs for individual cells are displayed in the table below:

Interpolation Forecasts of Exponential Smoothing
tObservedFittedResiduals
13125.95130.801861645299-4.85186164529914
14124.06124.929602352992-0.869602352992004
15121.55121.684667820369-0.134667820369131
16119.82119.936359866394-0.116359866394006
17119.19119.321583655852-0.131583655851657
18118.77118.94086722051-0.170867220510331
19118.31116.8921146479541.41788535204552
20119.47118.4171426711641.05285732883561
21119.79122.890552479915-3.10055247991457
22117.46118.198075366704-0.738075366704493
23115.74116.28938892918-0.549388929180168
24114.97115.413577734204-0.443577734204055
25112.83112.8227127285340.00728727146638164
26111.44111.608727661834-0.168727661833685
27110.6109.0582414338291.54175856617086
28109.67108.6318775301431.03812246985741
29107.96108.9247945614-0.964794561399884
30107.56107.872879019088-0.312879019087816
31116.12106.04029093867110.0797090613286
32114.38114.3638252787160.016174721283619
33113.96117.174135594143-3.21413559414289
34113.95112.9159752268831.03402477311673
35114.99112.4823822841772.50761771582349
36113.64114.09275363349-0.452753633489962
37112.53111.638410799280.891589200720205
38110.59111.138964713214-0.548964713214247
39110.1108.6987055535941.40129444640627
40109.38108.1062573633381.27374263666174
41110.43108.216276441832.2137235581698
42114.67109.8778846815484.79211531845166
43114.48114.3492839271210.130716072878712
44114.76112.7441188340042.01588116599557
45113.27116.508704464852-3.23870446485219
46111.56113.176577922193-1.61657792219331
47109.89111.000080419335-1.11008041933457
48108.04109.156229099485-1.11622909948518
49107.53106.4826403133691.04735968663103
50106.11105.826797525020.283202474979831
51104.11104.480401789361-0.370401789361395
52103102.480633052060.519366947939588
53104.74102.2078687531542.53213124684564
54104.14104.679698348895-0.539698348895072
55101.98103.953650873853-1.97365087385261
56100.91101.0664062761-0.156406276099773
57100.02101.985894935325-1.96589493532461
5898.4999.9802319061522-1.49023190615218
5997.3897.9907693555129-0.610769355512858
6095.8696.5230916556136-0.663091655613613
6193.9994.6469769148852-0.656976914885163
6294.0992.46180571529431.62819428470574
6393.4492.02403097652411.4159690234759
6493.6191.6136342456011.99636575439902
6598.3192.92827404452725.38172595547282
66103.9797.01629172707296.95370827292712
67104.12101.9519059370032.16809406299657
68107.63102.7799424820824.85005751791815
69105.22107.358064747102-2.13806474710221
70104.59105.399480698306-0.809480698306373
71101.54104.218681737321-2.67868173732096
7299.47101.183525911955-1.71352591195485


Extrapolation Forecasts of Exponential Smoothing
tForecast95% Lower Bound95% Upper Bound
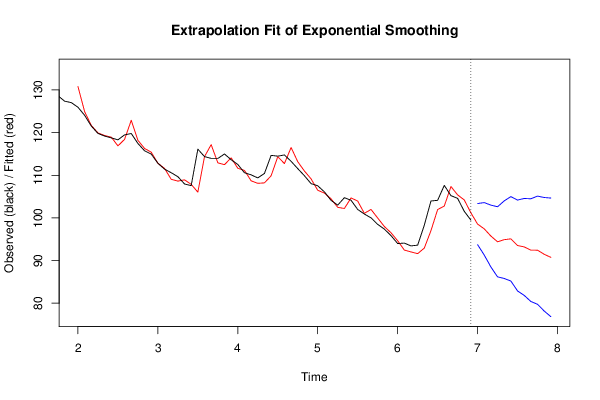
7398.55131729346693.7343759207084103.368258666224
7497.44044378812391.2886959736106103.592191602635
7595.740026359764488.4841117355403102.995940983989
7694.394877889940286.1719394542365102.617816325644
7794.896681476177985.7999697422512103.993393210105
7895.092949741603985.1909527036744104.994946779533
7993.52886446442882.8744867645731104.183242164283
8093.196614541702181.8322084589836104.561020624421
8192.443149947858680.4035347375939104.482765158123
8292.42962360467979.7440217146283105.11522549473
8391.476229058267578.1695723382431104.782885778292
8490.752246505408876.846093463926104.658399546892

\begin{tabular}{lllllllll}
\hline
Extrapolation Forecasts of Exponential Smoothing \tabularnewline
t & Forecast & 95% Lower Bound & 95% Upper Bound \tabularnewline
73 & 98.551317293466 & 93.7343759207084 & 103.368258666224 \tabularnewline
74 & 97.440443788123 & 91.2886959736106 & 103.592191602635 \tabularnewline
75 & 95.7400263597644 & 88.4841117355403 & 102.995940983989 \tabularnewline
76 & 94.3948778899402 & 86.1719394542365 & 102.617816325644 \tabularnewline
77 & 94.8966814761779 & 85.7999697422512 & 103.993393210105 \tabularnewline
78 & 95.0929497416039 & 85.1909527036744 & 104.994946779533 \tabularnewline
79 & 93.528864464428 & 82.8744867645731 & 104.183242164283 \tabularnewline
80 & 93.1966145417021 & 81.8322084589836 & 104.561020624421 \tabularnewline
81 & 92.4431499478586 & 80.4035347375939 & 104.482765158123 \tabularnewline
82 & 92.429623604679 & 79.7440217146283 & 105.11522549473 \tabularnewline
83 & 91.4762290582675 & 78.1695723382431 & 104.782885778292 \tabularnewline
84 & 90.7522465054088 & 76.846093463926 & 104.658399546892 \tabularnewline
\hline
\end{tabular}
%Source: https://freestatistics.org/blog/index.php?pk=&T=3

[TABLE]
[ROW][C]Extrapolation Forecasts of Exponential Smoothing[/C][/ROW]
[ROW][C]t[/C][C]Forecast[/C][C]95% Lower Bound[/C][C]95% Upper Bound[/C][/ROW]
[ROW][C]73[/C][C]98.551317293466[/C][C]93.7343759207084[/C][C]103.368258666224[/C][/ROW]
[ROW][C]74[/C][C]97.440443788123[/C][C]91.2886959736106[/C][C]103.592191602635[/C][/ROW]
[ROW][C]75[/C][C]95.7400263597644[/C][C]88.4841117355403[/C][C]102.995940983989[/C][/ROW]
[ROW][C]76[/C][C]94.3948778899402[/C][C]86.1719394542365[/C][C]102.617816325644[/C][/ROW]
[ROW][C]77[/C][C]94.8966814761779[/C][C]85.7999697422512[/C][C]103.993393210105[/C][/ROW]
[ROW][C]78[/C][C]95.0929497416039[/C][C]85.1909527036744[/C][C]104.994946779533[/C][/ROW]
[ROW][C]79[/C][C]93.528864464428[/C][C]82.8744867645731[/C][C]104.183242164283[/C][/ROW]
[ROW][C]80[/C][C]93.1966145417021[/C][C]81.8322084589836[/C][C]104.561020624421[/C][/ROW]
[ROW][C]81[/C][C]92.4431499478586[/C][C]80.4035347375939[/C][C]104.482765158123[/C][/ROW]
[ROW][C]82[/C][C]92.429623604679[/C][C]79.7440217146283[/C][C]105.11522549473[/C][/ROW]
[ROW][C]83[/C][C]91.4762290582675[/C][C]78.1695723382431[/C][C]104.782885778292[/C][/ROW]
[ROW][C]84[/C][C]90.7522465054088[/C][C]76.846093463926[/C][C]104.658399546892[/C][/ROW]
[/TABLE]
Source: https://freestatistics.org/blog/index.php?pk=&T=3

Globally Unique Identifier (entire table): ba.freestatistics.org/blog/index.php?pk=&T=3

As an alternative you can also use a QR Code:  

The GUIDs for individual cells are displayed in the table below:

Extrapolation Forecasts of Exponential Smoothing
tForecast95% Lower Bound95% Upper Bound
7398.55131729346693.7343759207084103.368258666224
7497.44044378812391.2886959736106103.592191602635
7595.740026359764488.4841117355403102.995940983989
7694.394877889940286.1719394542365102.617816325644
7794.896681476177985.7999697422512103.993393210105
7895.092949741603985.1909527036744104.994946779533
7993.52886446442882.8744867645731104.183242164283
8093.196614541702181.8322084589836104.561020624421
8192.443149947858680.4035347375939104.482765158123
8292.42962360467979.7440217146283105.11522549473
8391.476229058267578.1695723382431104.782885778292
8490.752246505408876.846093463926104.658399546892


Parameters (Session):
par1 = 12 ; par2 = Triple ; par3 = additive ;
Parameters (R input):
par1 = 12 ; par2 = Triple ; par3 = additive ;
R code (references can be found in the software module):
par3 <- 'additive'
par2 <- 'Double'
par1 <- '12'
par1 <- as.numeric(par1)
if (par2 == 'Single') K <- 1
if (par2 == 'Double') K <- 2
if (par2 == 'Triple') K <- par1
nx <- length(x)
nxmK <- nx - K
x <- ts(x, frequency = par1)
if (par2 == 'Single') fit <- HoltWinters(x, gamma=F, beta=F)
if (par2 == 'Double') fit <- HoltWinters(x, gamma=F)
if (par2 == 'Triple') fit <- HoltWinters(x, seasonal=par3)
fit
myresid <- x - fit$fitted[,'xhat']
bitmap(file='test1.png')
op <- par(mfrow=c(2,1))
plot(fit,ylab='Observed (black) / Fitted (red)',main='Interpolation Fit of Exponential Smoothing')
plot(myresid,ylab='Residuals',main='Interpolation Prediction Errors')
par(op)
dev.off()
bitmap(file='test2.png')
p <- predict(fit, par1, prediction.interval=TRUE)
np <- length(p[,1])
plot(fit,p,ylab='Observed (black) / Fitted (red)',main='Extrapolation Fit of Exponential Smoothing')
dev.off()
bitmap(file='test3.png')
op <- par(mfrow = c(2,2))
acf(as.numeric(myresid),lag.max = nx/2,main='Residual ACF')
spectrum(myresid,main='Residals Periodogram')
cpgram(myresid,main='Residal Cumulative Periodogram')
qqnorm(myresid,main='Residual Normal QQ Plot')
qqline(myresid)
par(op)
dev.off()
load(file='createtable')
a<-table.start()
a<-table.row.start(a)
a<-table.element(a,'Estimated Parameters of Exponential Smoothing',2,TRUE)
a<-table.row.end(a)
a<-table.row.start(a)
a<-table.element(a,'Parameter',header=TRUE)
a<-table.element(a,'Value',header=TRUE)
a<-table.row.end(a)
a<-table.row.start(a)
a<-table.element(a,'alpha',header=TRUE)
a<-table.element(a,fit$alpha)
a<-table.row.end(a)
a<-table.row.start(a)
a<-table.element(a,'beta',header=TRUE)
a<-table.element(a,fit$beta)
a<-table.row.end(a)
a<-table.row.start(a)
a<-table.element(a,'gamma',header=TRUE)
a<-table.element(a,fit$gamma)
a<-table.row.end(a)
a<-table.end(a)
table.save(a,file='mytable.tab')
a<-table.start()
a<-table.row.start(a)
a<-table.element(a,'Interpolation Forecasts of Exponential Smoothing',4,TRUE)
a<-table.row.end(a)
a<-table.row.start(a)
a<-table.element(a,'t',header=TRUE)
a<-table.element(a,'Observed',header=TRUE)
a<-table.element(a,'Fitted',header=TRUE)
a<-table.element(a,'Residuals',header=TRUE)
a<-table.row.end(a)
for (i in 1:nxmK) {
a<-table.row.start(a)
a<-table.element(a,i+K,header=TRUE)
a<-table.element(a,x[i+K])
a<-table.element(a,fit$fitted[i,'xhat'])
a<-table.element(a,myresid[i])
a<-table.row.end(a)
}
a<-table.end(a)
table.save(a,file='mytable1.tab')
a<-table.start()
a<-table.row.start(a)
a<-table.element(a,'Extrapolation Forecasts of Exponential Smoothing',4,TRUE)
a<-table.row.end(a)
a<-table.row.start(a)
a<-table.element(a,'t',header=TRUE)
a<-table.element(a,'Forecast',header=TRUE)
a<-table.element(a,'95% Lower Bound',header=TRUE)
a<-table.element(a,'95% Upper Bound',header=TRUE)
a<-table.row.end(a)
for (i in 1:np) {
a<-table.row.start(a)
a<-table.element(a,nx+i,header=TRUE)
a<-table.element(a,p[i,'fit'])
a<-table.element(a,p[i,'lwr'])
a<-table.element(a,p[i,'upr'])
a<-table.row.end(a)
}
a<-table.end(a)
table.save(a,file='mytable2.tab')