Free Statistics

of Irreproducible Research!

Author's title

Author*Unverified author*
R Software Modulerwasp_kendall.wasp
Title produced by softwareKendall tau Rank Correlation
Date of computationThu, 05 May 2016 22:20:09 +0100
Cite this page as followsStatistical Computations at FreeStatistics.org, Office for Research Development and Education, URL https://freestatistics.org/blog/index.php?v=date/2016/May/05/t14624832530jiu64awu12q2it.htm/, Retrieved Sat, 18 May 2024 01:02:39 +0000
Statistical Computations at FreeStatistics.org, Office for Research Development and Education, URL https://freestatistics.org/blog/index.php?pk=295334, Retrieved Sat, 18 May 2024 01:02:39 +0000
QR Codes:

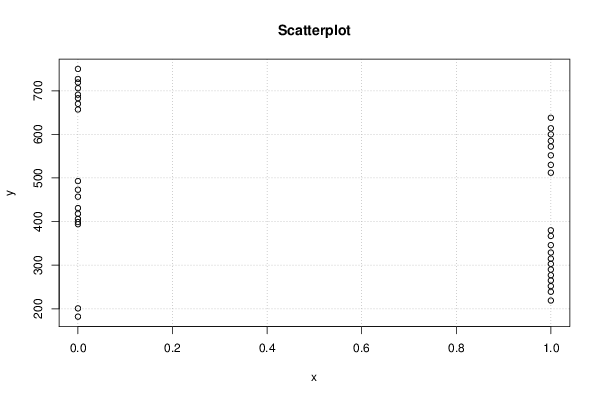
Original text written by user:Y-axis Earning data: http://data.bls.gov/timeseries/LEU0252882700 X-axis Presidential Data: https://en.wikipedia.org/wiki/Party_divisions_of_United_States_Congresses
IsPrivate?No (this computation is public)
User-defined keywords
Estimated Impact139
Family? (F = Feedback message, R = changed R code, M = changed R Module, P = changed Parameters, D = changed Data)
-       [Kendall tau Rank Correlation] [] [2016-05-05 21:20:09] [d41d8cd98f00b204e9800998ecf8427e] [Current]
Feedback Forum

Post a new message
Dataseries X:
0
0
1
1
1
1
1
1
1
1
1
1
1
1
0
0
0
0
0
0
0
0
1
1
1
1
1
1
1
1
0
0
0
0
0
0
0
0
Dataseries Y:
182
201
219
239
252
265
277
290
303
315
329
346
367
380
394
399
406
418
431
457
473
493
512
530
552
572
585
600
614
638
657
670
683
691
706
719
727
750


Summary of computational transaction
Raw Inputview raw input (R code)
Raw Outputview raw output of R engine
Computing time1 seconds
R Server'Gwilym Jenkins' @ jenkins.wessa.net

\begin{tabular}{lllllllll}
\hline
Summary of computational transaction \tabularnewline
Raw Input & view raw input (R code)  \tabularnewline
Raw Output & view raw output of R engine  \tabularnewline
Computing time & 1 seconds \tabularnewline
R Server & 'Gwilym Jenkins' @ jenkins.wessa.net \tabularnewline
\hline
\end{tabular}
%Source: https://freestatistics.org/blog/index.php?pk=295334&T=0

[TABLE]
[ROW][C]Summary of computational transaction[/C][/ROW]
[ROW][C]Raw Input[/C][C]view raw input (R code) [/C][/ROW]
[ROW][C]Raw Output[/C][C]view raw output of R engine [/C][/ROW]
[ROW][C]Computing time[/C][C]1 seconds[/C][/ROW]
[ROW][C]R Server[/C][C]'Gwilym Jenkins' @ jenkins.wessa.net[/C][/ROW]
[/TABLE]
Source: https://freestatistics.org/blog/index.php?pk=295334&T=0

Globally Unique Identifier (entire table): ba.freestatistics.org/blog/index.php?pk=295334&T=0

As an alternative you can also use a QR Code:  

The GUIDs for individual cells are displayed in the table below:

Summary of computational transaction
Raw Inputview raw input (R code)
Raw Outputview raw output of R engine
Computing time1 seconds
R Server'Gwilym Jenkins' @ jenkins.wessa.net


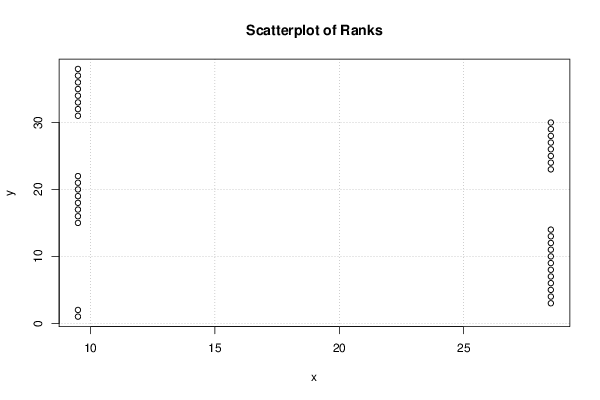
Kendall tau Rank Correlation
Kendall tau-0.30214449763298
2-sided p-value0.0272957105189562
Score-152
Var(Score)4680
Denominator503.070556640625

\begin{tabular}{lllllllll}
\hline
Kendall tau Rank Correlation \tabularnewline
Kendall tau & -0.30214449763298 \tabularnewline
2-sided p-value & 0.0272957105189562 \tabularnewline
Score & -152 \tabularnewline
Var(Score) & 4680 \tabularnewline
Denominator & 503.070556640625 \tabularnewline
\hline
\end{tabular}
%Source: https://freestatistics.org/blog/index.php?pk=295334&T=1

[TABLE]
[ROW][C]Kendall tau Rank Correlation[/C][/ROW]
[ROW][C]Kendall tau[/C][C]-0.30214449763298[/C][/ROW]
[ROW][C]2-sided p-value[/C][C]0.0272957105189562[/C][/ROW]
[ROW][C]Score[/C][C]-152[/C][/ROW]
[ROW][C]Var(Score)[/C][C]4680[/C][/ROW]
[ROW][C]Denominator[/C][C]503.070556640625[/C][/ROW]
[/TABLE]
Source: https://freestatistics.org/blog/index.php?pk=295334&T=1

Globally Unique Identifier (entire table): ba.freestatistics.org/blog/index.php?pk=295334&T=1

As an alternative you can also use a QR Code:  

The GUIDs for individual cells are displayed in the table below:

Kendall tau Rank Correlation
Kendall tau-0.30214449763298
2-sided p-value0.0272957105189562
Score-152
Var(Score)4680
Denominator503.070556640625


Parameters (Session):
Parameters (R input):
R code (references can be found in the software module):
library('Kendall')
k <- Kendall(x,y)
bitmap(file='test1.png')
par(bg=rgb(0.2,0.4,0.6))
plot(x,y,main='Scatterplot',xlab=xlab,ylab=ylab)
grid()
dev.off()
bitmap(file='test2.png')
par(bg=rgb(0.2,0.4,0.6))
plot(rank(x),rank(y),main='Scatterplot of Ranks',xlab=xlab,ylab=ylab)
grid()
dev.off()
load(file='createtable')
a<-table.start()
a<-table.row.start(a)
a<-table.element(a,'Kendall tau Rank Correlation',2,TRUE)
a<-table.row.end(a)
a<-table.row.start(a)
a<-table.element(a,'Kendall tau',header=TRUE)
a<-table.element(a,k$tau)
a<-table.row.end(a)
a<-table.row.start(a)
a<-table.element(a,'2-sided p-value',header=TRUE)
a<-table.element(a,k$sl)
a<-table.row.end(a)
a<-table.row.start(a)
a<-table.element(a,'Score',header=TRUE)
a<-table.element(a,k$S)
a<-table.row.end(a)
a<-table.row.start(a)
a<-table.element(a,'Var(Score)',header=TRUE)
a<-table.element(a,k$varS)
a<-table.row.end(a)
a<-table.row.start(a)
a<-table.element(a,'Denominator',header=TRUE)
a<-table.element(a,k$D)
a<-table.row.end(a)
a<-table.end(a)
table.save(a,file='mytable.tab')