Free Statistics

of Irreproducible Research!

Author's title

Author*Unverified author*
R Software Modulerwasp_autocorrelation.wasp
Title produced by software(Partial) Autocorrelation Function
Date of computationFri, 11 Mar 2016 15:35:57 +0000
Cite this page as followsStatistical Computations at FreeStatistics.org, Office for Research Development and Education, URL https://freestatistics.org/blog/index.php?v=date/2016/Mar/11/t1457710850ume10j0ctkbt3y8.htm/, Retrieved Sat, 18 May 2024 16:46:14 +0000
Statistical Computations at FreeStatistics.org, Office for Research Development and Education, URL https://freestatistics.org/blog/index.php?pk=293867, Retrieved Sat, 18 May 2024 16:46:14 +0000
QR Codes:

Original text written by user:
IsPrivate?No (this computation is public)
User-defined keywords
Estimated Impact179
Family? (F = Feedback message, R = changed R code, M = changed R Module, P = changed Parameters, D = changed Data)
-       [(Partial) Autocorrelation Function] [] [2016-03-11 15:35:57] [581ca8b06495ff9ab5cb116090b703d7] [Current]
Feedback Forum

Post a new message
Dataseries X:
7612
7381
6978
6819
6688
6454
6679
6921
7807
7898
7832
7384
7620
7281
6929
6587
6071
5928
5964
6374
7160
7213
6890
6525
6739
6580
6391
6254
6114
5978
6315
6427
7132
7292
7708
7525
7450
7526
7263
7070
6893
6781
7188
7015
8273
8470
8230
8137
8122
8367
8141
7750
7504
7330
7608
7647
8942
8865
8320
8207
8105
8290
8162
8051
7699
7440
7656
7549
9086
8942
8764
8500
8239
8443
8349
8288
7970
7496
7745
7543
9036
9075
8859
8605
8419
8495
8284
7582
7691
7046
7442
7596
8597
8436
7881
7477
7508
7361
7299
6914
6768
6746
7052
7139
7714
7750
7622
7424
7444
7208
7128
7022
6688
6199
6400
6474
7182
7330
7410
7442
7753
7762
7814
7838
7298
7155
7076
7450
8216
8246
8335
8171
8485
8435
8369
8210
7888
8061
8139
7837
8943
8523
8104
7969
7921
7930
7706
7552
7379
6946
7128
7393
8092
8004
7903
7710
7867
7860
7723
7477
7126
7161
7162
7406
7944
8084
8088
7972
8184
7914
7845
7610
7278
6883
7123
7182
7912
7893
7671
7403
7663
7589
7450
7069
6670
6285
6506
6539
7291
7391
7126
6752
6835
6664
6562
6174
5741
5398
5203
5673
6379
6418
6272
6059


Summary of computational transaction
Raw Inputview raw input (R code)
Raw Outputview raw output of R engine
Computing time2 seconds
R Server'George Udny Yule' @ yule.wessa.net

\begin{tabular}{lllllllll}
\hline
Summary of computational transaction \tabularnewline
Raw Input & view raw input (R code)  \tabularnewline
Raw Output & view raw output of R engine  \tabularnewline
Computing time & 2 seconds \tabularnewline
R Server & 'George Udny Yule' @ yule.wessa.net \tabularnewline
\hline
\end{tabular}
%Source: https://freestatistics.org/blog/index.php?pk=293867&T=0

[TABLE]
[ROW][C]Summary of computational transaction[/C][/ROW]
[ROW][C]Raw Input[/C][C]view raw input (R code) [/C][/ROW]
[ROW][C]Raw Output[/C][C]view raw output of R engine [/C][/ROW]
[ROW][C]Computing time[/C][C]2 seconds[/C][/ROW]
[ROW][C]R Server[/C][C]'George Udny Yule' @ yule.wessa.net[/C][/ROW]
[/TABLE]
Source: https://freestatistics.org/blog/index.php?pk=293867&T=0

Globally Unique Identifier (entire table): ba.freestatistics.org/blog/index.php?pk=293867&T=0

As an alternative you can also use a QR Code:  

The GUIDs for individual cells are displayed in the table below:

Summary of computational transaction
Raw Inputview raw input (R code)
Raw Outputview raw output of R engine
Computing time2 seconds
R Server'George Udny Yule' @ yule.wessa.net


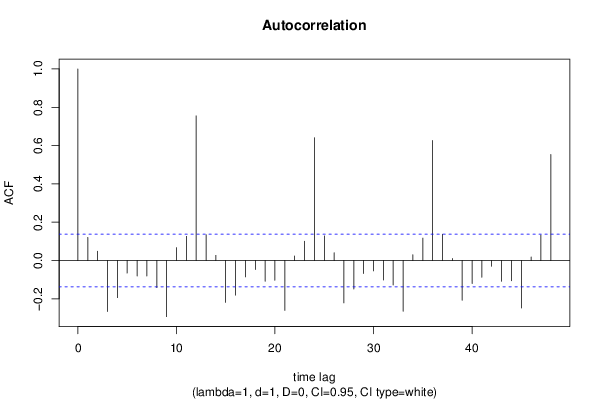
Autocorrelation Function
Time lag kACF(k)T-STATP-value
10.1204481.71610.043833
20.0484730.69060.245292
3-0.266338-3.79479.8e-05
4-0.194257-2.76770.003083
5-0.06596-0.93980.174222
6-0.081536-1.16170.123359
7-0.081076-1.15510.124694
8-0.141837-2.02090.022304
9-0.293345-4.17952.2e-05
100.0670750.95570.170186
110.1257171.79120.037376
120.75509410.75840
130.1342221.91240.028618
140.0267060.38050.351988
15-0.219059-3.12110.001032
16-0.181187-2.58150.005271
17-0.085877-1.22360.111267
18-0.047473-0.67640.249782
19-0.108689-1.54860.061519
20-0.103382-1.4730.071155
21-0.260482-3.71130.000133
220.0234240.33370.36946
230.1003111.42920.07724
240.6408189.13020
250.1282861.82780.034525
260.0402680.57370.283393
27-0.221526-3.15630.000921
28-0.148726-2.1190.017652
29-0.067929-0.96780.167139
30-0.054371-0.77470.219719
31-0.102179-1.45580.073493
32-0.128567-1.83180.034224
33-0.265582-3.7840.000102
340.0299030.42610.335258
350.116691.66260.04897
360.6265438.92690
370.1366581.94710.026452
380.0099030.14110.443965
39-0.20757-2.95740.001735
40-0.120694-1.71960.043512
41-0.087292-1.24370.107519
42-0.030008-0.42750.334717
43-0.108532-1.54630.06179
44-0.10624-1.51370.065831
45-0.248344-3.53840.00025
460.0183860.2620.396809
470.1331371.89690.02963
480.5531647.88140

\begin{tabular}{lllllllll}
\hline
Autocorrelation Function \tabularnewline
Time lag k & ACF(k) & T-STAT & P-value \tabularnewline
1 & 0.120448 & 1.7161 & 0.043833 \tabularnewline
2 & 0.048473 & 0.6906 & 0.245292 \tabularnewline
3 & -0.266338 & -3.7947 & 9.8e-05 \tabularnewline
4 & -0.194257 & -2.7677 & 0.003083 \tabularnewline
5 & -0.06596 & -0.9398 & 0.174222 \tabularnewline
6 & -0.081536 & -1.1617 & 0.123359 \tabularnewline
7 & -0.081076 & -1.1551 & 0.124694 \tabularnewline
8 & -0.141837 & -2.0209 & 0.022304 \tabularnewline
9 & -0.293345 & -4.1795 & 2.2e-05 \tabularnewline
10 & 0.067075 & 0.9557 & 0.170186 \tabularnewline
11 & 0.125717 & 1.7912 & 0.037376 \tabularnewline
12 & 0.755094 & 10.7584 & 0 \tabularnewline
13 & 0.134222 & 1.9124 & 0.028618 \tabularnewline
14 & 0.026706 & 0.3805 & 0.351988 \tabularnewline
15 & -0.219059 & -3.1211 & 0.001032 \tabularnewline
16 & -0.181187 & -2.5815 & 0.005271 \tabularnewline
17 & -0.085877 & -1.2236 & 0.111267 \tabularnewline
18 & -0.047473 & -0.6764 & 0.249782 \tabularnewline
19 & -0.108689 & -1.5486 & 0.061519 \tabularnewline
20 & -0.103382 & -1.473 & 0.071155 \tabularnewline
21 & -0.260482 & -3.7113 & 0.000133 \tabularnewline
22 & 0.023424 & 0.3337 & 0.36946 \tabularnewline
23 & 0.100311 & 1.4292 & 0.07724 \tabularnewline
24 & 0.640818 & 9.1302 & 0 \tabularnewline
25 & 0.128286 & 1.8278 & 0.034525 \tabularnewline
26 & 0.040268 & 0.5737 & 0.283393 \tabularnewline
27 & -0.221526 & -3.1563 & 0.000921 \tabularnewline
28 & -0.148726 & -2.119 & 0.017652 \tabularnewline
29 & -0.067929 & -0.9678 & 0.167139 \tabularnewline
30 & -0.054371 & -0.7747 & 0.219719 \tabularnewline
31 & -0.102179 & -1.4558 & 0.073493 \tabularnewline
32 & -0.128567 & -1.8318 & 0.034224 \tabularnewline
33 & -0.265582 & -3.784 & 0.000102 \tabularnewline
34 & 0.029903 & 0.4261 & 0.335258 \tabularnewline
35 & 0.11669 & 1.6626 & 0.04897 \tabularnewline
36 & 0.626543 & 8.9269 & 0 \tabularnewline
37 & 0.136658 & 1.9471 & 0.026452 \tabularnewline
38 & 0.009903 & 0.1411 & 0.443965 \tabularnewline
39 & -0.20757 & -2.9574 & 0.001735 \tabularnewline
40 & -0.120694 & -1.7196 & 0.043512 \tabularnewline
41 & -0.087292 & -1.2437 & 0.107519 \tabularnewline
42 & -0.030008 & -0.4275 & 0.334717 \tabularnewline
43 & -0.108532 & -1.5463 & 0.06179 \tabularnewline
44 & -0.10624 & -1.5137 & 0.065831 \tabularnewline
45 & -0.248344 & -3.5384 & 0.00025 \tabularnewline
46 & 0.018386 & 0.262 & 0.396809 \tabularnewline
47 & 0.133137 & 1.8969 & 0.02963 \tabularnewline
48 & 0.553164 & 7.8814 & 0 \tabularnewline
\hline
\end{tabular}
%Source: https://freestatistics.org/blog/index.php?pk=293867&T=1

[TABLE]
[ROW][C]Autocorrelation Function[/C][/ROW]
[ROW][C]Time lag k[/C][C]ACF(k)[/C][C]T-STAT[/C][C]P-value[/C][/ROW]
[ROW][C]1[/C][C]0.120448[/C][C]1.7161[/C][C]0.043833[/C][/ROW]
[ROW][C]2[/C][C]0.048473[/C][C]0.6906[/C][C]0.245292[/C][/ROW]
[ROW][C]3[/C][C]-0.266338[/C][C]-3.7947[/C][C]9.8e-05[/C][/ROW]
[ROW][C]4[/C][C]-0.194257[/C][C]-2.7677[/C][C]0.003083[/C][/ROW]
[ROW][C]5[/C][C]-0.06596[/C][C]-0.9398[/C][C]0.174222[/C][/ROW]
[ROW][C]6[/C][C]-0.081536[/C][C]-1.1617[/C][C]0.123359[/C][/ROW]
[ROW][C]7[/C][C]-0.081076[/C][C]-1.1551[/C][C]0.124694[/C][/ROW]
[ROW][C]8[/C][C]-0.141837[/C][C]-2.0209[/C][C]0.022304[/C][/ROW]
[ROW][C]9[/C][C]-0.293345[/C][C]-4.1795[/C][C]2.2e-05[/C][/ROW]
[ROW][C]10[/C][C]0.067075[/C][C]0.9557[/C][C]0.170186[/C][/ROW]
[ROW][C]11[/C][C]0.125717[/C][C]1.7912[/C][C]0.037376[/C][/ROW]
[ROW][C]12[/C][C]0.755094[/C][C]10.7584[/C][C]0[/C][/ROW]
[ROW][C]13[/C][C]0.134222[/C][C]1.9124[/C][C]0.028618[/C][/ROW]
[ROW][C]14[/C][C]0.026706[/C][C]0.3805[/C][C]0.351988[/C][/ROW]
[ROW][C]15[/C][C]-0.219059[/C][C]-3.1211[/C][C]0.001032[/C][/ROW]
[ROW][C]16[/C][C]-0.181187[/C][C]-2.5815[/C][C]0.005271[/C][/ROW]
[ROW][C]17[/C][C]-0.085877[/C][C]-1.2236[/C][C]0.111267[/C][/ROW]
[ROW][C]18[/C][C]-0.047473[/C][C]-0.6764[/C][C]0.249782[/C][/ROW]
[ROW][C]19[/C][C]-0.108689[/C][C]-1.5486[/C][C]0.061519[/C][/ROW]
[ROW][C]20[/C][C]-0.103382[/C][C]-1.473[/C][C]0.071155[/C][/ROW]
[ROW][C]21[/C][C]-0.260482[/C][C]-3.7113[/C][C]0.000133[/C][/ROW]
[ROW][C]22[/C][C]0.023424[/C][C]0.3337[/C][C]0.36946[/C][/ROW]
[ROW][C]23[/C][C]0.100311[/C][C]1.4292[/C][C]0.07724[/C][/ROW]
[ROW][C]24[/C][C]0.640818[/C][C]9.1302[/C][C]0[/C][/ROW]
[ROW][C]25[/C][C]0.128286[/C][C]1.8278[/C][C]0.034525[/C][/ROW]
[ROW][C]26[/C][C]0.040268[/C][C]0.5737[/C][C]0.283393[/C][/ROW]
[ROW][C]27[/C][C]-0.221526[/C][C]-3.1563[/C][C]0.000921[/C][/ROW]
[ROW][C]28[/C][C]-0.148726[/C][C]-2.119[/C][C]0.017652[/C][/ROW]
[ROW][C]29[/C][C]-0.067929[/C][C]-0.9678[/C][C]0.167139[/C][/ROW]
[ROW][C]30[/C][C]-0.054371[/C][C]-0.7747[/C][C]0.219719[/C][/ROW]
[ROW][C]31[/C][C]-0.102179[/C][C]-1.4558[/C][C]0.073493[/C][/ROW]
[ROW][C]32[/C][C]-0.128567[/C][C]-1.8318[/C][C]0.034224[/C][/ROW]
[ROW][C]33[/C][C]-0.265582[/C][C]-3.784[/C][C]0.000102[/C][/ROW]
[ROW][C]34[/C][C]0.029903[/C][C]0.4261[/C][C]0.335258[/C][/ROW]
[ROW][C]35[/C][C]0.11669[/C][C]1.6626[/C][C]0.04897[/C][/ROW]
[ROW][C]36[/C][C]0.626543[/C][C]8.9269[/C][C]0[/C][/ROW]
[ROW][C]37[/C][C]0.136658[/C][C]1.9471[/C][C]0.026452[/C][/ROW]
[ROW][C]38[/C][C]0.009903[/C][C]0.1411[/C][C]0.443965[/C][/ROW]
[ROW][C]39[/C][C]-0.20757[/C][C]-2.9574[/C][C]0.001735[/C][/ROW]
[ROW][C]40[/C][C]-0.120694[/C][C]-1.7196[/C][C]0.043512[/C][/ROW]
[ROW][C]41[/C][C]-0.087292[/C][C]-1.2437[/C][C]0.107519[/C][/ROW]
[ROW][C]42[/C][C]-0.030008[/C][C]-0.4275[/C][C]0.334717[/C][/ROW]
[ROW][C]43[/C][C]-0.108532[/C][C]-1.5463[/C][C]0.06179[/C][/ROW]
[ROW][C]44[/C][C]-0.10624[/C][C]-1.5137[/C][C]0.065831[/C][/ROW]
[ROW][C]45[/C][C]-0.248344[/C][C]-3.5384[/C][C]0.00025[/C][/ROW]
[ROW][C]46[/C][C]0.018386[/C][C]0.262[/C][C]0.396809[/C][/ROW]
[ROW][C]47[/C][C]0.133137[/C][C]1.8969[/C][C]0.02963[/C][/ROW]
[ROW][C]48[/C][C]0.553164[/C][C]7.8814[/C][C]0[/C][/ROW]
[/TABLE]
Source: https://freestatistics.org/blog/index.php?pk=293867&T=1

Globally Unique Identifier (entire table): ba.freestatistics.org/blog/index.php?pk=293867&T=1

As an alternative you can also use a QR Code:  

The GUIDs for individual cells are displayed in the table below:

Autocorrelation Function
Time lag kACF(k)T-STATP-value
10.1204481.71610.043833
20.0484730.69060.245292
3-0.266338-3.79479.8e-05
4-0.194257-2.76770.003083
5-0.06596-0.93980.174222
6-0.081536-1.16170.123359
7-0.081076-1.15510.124694
8-0.141837-2.02090.022304
9-0.293345-4.17952.2e-05
100.0670750.95570.170186
110.1257171.79120.037376
120.75509410.75840
130.1342221.91240.028618
140.0267060.38050.351988
15-0.219059-3.12110.001032
16-0.181187-2.58150.005271
17-0.085877-1.22360.111267
18-0.047473-0.67640.249782
19-0.108689-1.54860.061519
20-0.103382-1.4730.071155
21-0.260482-3.71130.000133
220.0234240.33370.36946
230.1003111.42920.07724
240.6408189.13020
250.1282861.82780.034525
260.0402680.57370.283393
27-0.221526-3.15630.000921
28-0.148726-2.1190.017652
29-0.067929-0.96780.167139
30-0.054371-0.77470.219719
31-0.102179-1.45580.073493
32-0.128567-1.83180.034224
33-0.265582-3.7840.000102
340.0299030.42610.335258
350.116691.66260.04897
360.6265438.92690
370.1366581.94710.026452
380.0099030.14110.443965
39-0.20757-2.95740.001735
40-0.120694-1.71960.043512
41-0.087292-1.24370.107519
42-0.030008-0.42750.334717
43-0.108532-1.54630.06179
44-0.10624-1.51370.065831
45-0.248344-3.53840.00025
460.0183860.2620.396809
470.1331371.89690.02963
480.5531647.88140


Partial Autocorrelation Function
Time lag kPACF(k)T-STATP-value
10.1204481.71610.043833
20.0344650.49110.311959
3-0.280525-3.99694.5e-05
4-0.14354-2.04510.021066
50.0012740.01810.49277
6-0.139633-1.98950.023997
7-0.169533-2.41550.0083
8-0.18473-2.6320.00457
9-0.408603-5.82170
10-0.05097-0.72620.234272
11-0.047937-0.6830.247695
120.6453259.19450
13-0.001975-0.02810.488789
14-0.018067-0.25740.39856
150.0099120.14120.443917
160.0425120.60570.272693
17-0.069175-0.98560.162752
180.0249320.35520.361394
19-0.058189-0.82910.204021
20-0.008871-0.12640.449776
210.0299760.42710.334882
22-0.127046-1.81010.035877
23-0.104589-1.49020.068866
240.1612332.29720.011313
25-0.053705-0.76520.222526
26-0.015732-0.22420.411433
27-0.080616-1.14860.126035
280.0239050.34060.366879
290.0373690.53240.297505
30-0.066836-0.95230.171047
31-0.051421-0.73260.232312
32-0.122665-1.74770.041014
33-0.080918-1.15290.125153
340.0090590.12910.448712
350.0381490.54350.293676
360.1506262.14610.016526
370.0394420.5620.287382
38-0.087921-1.25270.10588
39-0.032275-0.45990.323058
400.081611.16280.123145
41-0.125112-1.78260.038075
420.0277230.3950.346631
430.0234960.33480.369074
440.0156490.2230.411896
450.0265770.37870.352665
46-0.055684-0.79340.214244
47-0.026351-0.37550.353859
48-0.008742-0.12460.450499

\begin{tabular}{lllllllll}
\hline
Partial Autocorrelation Function \tabularnewline
Time lag k & PACF(k) & T-STAT & P-value \tabularnewline
1 & 0.120448 & 1.7161 & 0.043833 \tabularnewline
2 & 0.034465 & 0.4911 & 0.311959 \tabularnewline
3 & -0.280525 & -3.9969 & 4.5e-05 \tabularnewline
4 & -0.14354 & -2.0451 & 0.021066 \tabularnewline
5 & 0.001274 & 0.0181 & 0.49277 \tabularnewline
6 & -0.139633 & -1.9895 & 0.023997 \tabularnewline
7 & -0.169533 & -2.4155 & 0.0083 \tabularnewline
8 & -0.18473 & -2.632 & 0.00457 \tabularnewline
9 & -0.408603 & -5.8217 & 0 \tabularnewline
10 & -0.05097 & -0.7262 & 0.234272 \tabularnewline
11 & -0.047937 & -0.683 & 0.247695 \tabularnewline
12 & 0.645325 & 9.1945 & 0 \tabularnewline
13 & -0.001975 & -0.0281 & 0.488789 \tabularnewline
14 & -0.018067 & -0.2574 & 0.39856 \tabularnewline
15 & 0.009912 & 0.1412 & 0.443917 \tabularnewline
16 & 0.042512 & 0.6057 & 0.272693 \tabularnewline
17 & -0.069175 & -0.9856 & 0.162752 \tabularnewline
18 & 0.024932 & 0.3552 & 0.361394 \tabularnewline
19 & -0.058189 & -0.8291 & 0.204021 \tabularnewline
20 & -0.008871 & -0.1264 & 0.449776 \tabularnewline
21 & 0.029976 & 0.4271 & 0.334882 \tabularnewline
22 & -0.127046 & -1.8101 & 0.035877 \tabularnewline
23 & -0.104589 & -1.4902 & 0.068866 \tabularnewline
24 & 0.161233 & 2.2972 & 0.011313 \tabularnewline
25 & -0.053705 & -0.7652 & 0.222526 \tabularnewline
26 & -0.015732 & -0.2242 & 0.411433 \tabularnewline
27 & -0.080616 & -1.1486 & 0.126035 \tabularnewline
28 & 0.023905 & 0.3406 & 0.366879 \tabularnewline
29 & 0.037369 & 0.5324 & 0.297505 \tabularnewline
30 & -0.066836 & -0.9523 & 0.171047 \tabularnewline
31 & -0.051421 & -0.7326 & 0.232312 \tabularnewline
32 & -0.122665 & -1.7477 & 0.041014 \tabularnewline
33 & -0.080918 & -1.1529 & 0.125153 \tabularnewline
34 & 0.009059 & 0.1291 & 0.448712 \tabularnewline
35 & 0.038149 & 0.5435 & 0.293676 \tabularnewline
36 & 0.150626 & 2.1461 & 0.016526 \tabularnewline
37 & 0.039442 & 0.562 & 0.287382 \tabularnewline
38 & -0.087921 & -1.2527 & 0.10588 \tabularnewline
39 & -0.032275 & -0.4599 & 0.323058 \tabularnewline
40 & 0.08161 & 1.1628 & 0.123145 \tabularnewline
41 & -0.125112 & -1.7826 & 0.038075 \tabularnewline
42 & 0.027723 & 0.395 & 0.346631 \tabularnewline
43 & 0.023496 & 0.3348 & 0.369074 \tabularnewline
44 & 0.015649 & 0.223 & 0.411896 \tabularnewline
45 & 0.026577 & 0.3787 & 0.352665 \tabularnewline
46 & -0.055684 & -0.7934 & 0.214244 \tabularnewline
47 & -0.026351 & -0.3755 & 0.353859 \tabularnewline
48 & -0.008742 & -0.1246 & 0.450499 \tabularnewline
\hline
\end{tabular}
%Source: https://freestatistics.org/blog/index.php?pk=293867&T=2

[TABLE]
[ROW][C]Partial Autocorrelation Function[/C][/ROW]
[ROW][C]Time lag k[/C][C]PACF(k)[/C][C]T-STAT[/C][C]P-value[/C][/ROW]
[ROW][C]1[/C][C]0.120448[/C][C]1.7161[/C][C]0.043833[/C][/ROW]
[ROW][C]2[/C][C]0.034465[/C][C]0.4911[/C][C]0.311959[/C][/ROW]
[ROW][C]3[/C][C]-0.280525[/C][C]-3.9969[/C][C]4.5e-05[/C][/ROW]
[ROW][C]4[/C][C]-0.14354[/C][C]-2.0451[/C][C]0.021066[/C][/ROW]
[ROW][C]5[/C][C]0.001274[/C][C]0.0181[/C][C]0.49277[/C][/ROW]
[ROW][C]6[/C][C]-0.139633[/C][C]-1.9895[/C][C]0.023997[/C][/ROW]
[ROW][C]7[/C][C]-0.169533[/C][C]-2.4155[/C][C]0.0083[/C][/ROW]
[ROW][C]8[/C][C]-0.18473[/C][C]-2.632[/C][C]0.00457[/C][/ROW]
[ROW][C]9[/C][C]-0.408603[/C][C]-5.8217[/C][C]0[/C][/ROW]
[ROW][C]10[/C][C]-0.05097[/C][C]-0.7262[/C][C]0.234272[/C][/ROW]
[ROW][C]11[/C][C]-0.047937[/C][C]-0.683[/C][C]0.247695[/C][/ROW]
[ROW][C]12[/C][C]0.645325[/C][C]9.1945[/C][C]0[/C][/ROW]
[ROW][C]13[/C][C]-0.001975[/C][C]-0.0281[/C][C]0.488789[/C][/ROW]
[ROW][C]14[/C][C]-0.018067[/C][C]-0.2574[/C][C]0.39856[/C][/ROW]
[ROW][C]15[/C][C]0.009912[/C][C]0.1412[/C][C]0.443917[/C][/ROW]
[ROW][C]16[/C][C]0.042512[/C][C]0.6057[/C][C]0.272693[/C][/ROW]
[ROW][C]17[/C][C]-0.069175[/C][C]-0.9856[/C][C]0.162752[/C][/ROW]
[ROW][C]18[/C][C]0.024932[/C][C]0.3552[/C][C]0.361394[/C][/ROW]
[ROW][C]19[/C][C]-0.058189[/C][C]-0.8291[/C][C]0.204021[/C][/ROW]
[ROW][C]20[/C][C]-0.008871[/C][C]-0.1264[/C][C]0.449776[/C][/ROW]
[ROW][C]21[/C][C]0.029976[/C][C]0.4271[/C][C]0.334882[/C][/ROW]
[ROW][C]22[/C][C]-0.127046[/C][C]-1.8101[/C][C]0.035877[/C][/ROW]
[ROW][C]23[/C][C]-0.104589[/C][C]-1.4902[/C][C]0.068866[/C][/ROW]
[ROW][C]24[/C][C]0.161233[/C][C]2.2972[/C][C]0.011313[/C][/ROW]
[ROW][C]25[/C][C]-0.053705[/C][C]-0.7652[/C][C]0.222526[/C][/ROW]
[ROW][C]26[/C][C]-0.015732[/C][C]-0.2242[/C][C]0.411433[/C][/ROW]
[ROW][C]27[/C][C]-0.080616[/C][C]-1.1486[/C][C]0.126035[/C][/ROW]
[ROW][C]28[/C][C]0.023905[/C][C]0.3406[/C][C]0.366879[/C][/ROW]
[ROW][C]29[/C][C]0.037369[/C][C]0.5324[/C][C]0.297505[/C][/ROW]
[ROW][C]30[/C][C]-0.066836[/C][C]-0.9523[/C][C]0.171047[/C][/ROW]
[ROW][C]31[/C][C]-0.051421[/C][C]-0.7326[/C][C]0.232312[/C][/ROW]
[ROW][C]32[/C][C]-0.122665[/C][C]-1.7477[/C][C]0.041014[/C][/ROW]
[ROW][C]33[/C][C]-0.080918[/C][C]-1.1529[/C][C]0.125153[/C][/ROW]
[ROW][C]34[/C][C]0.009059[/C][C]0.1291[/C][C]0.448712[/C][/ROW]
[ROW][C]35[/C][C]0.038149[/C][C]0.5435[/C][C]0.293676[/C][/ROW]
[ROW][C]36[/C][C]0.150626[/C][C]2.1461[/C][C]0.016526[/C][/ROW]
[ROW][C]37[/C][C]0.039442[/C][C]0.562[/C][C]0.287382[/C][/ROW]
[ROW][C]38[/C][C]-0.087921[/C][C]-1.2527[/C][C]0.10588[/C][/ROW]
[ROW][C]39[/C][C]-0.032275[/C][C]-0.4599[/C][C]0.323058[/C][/ROW]
[ROW][C]40[/C][C]0.08161[/C][C]1.1628[/C][C]0.123145[/C][/ROW]
[ROW][C]41[/C][C]-0.125112[/C][C]-1.7826[/C][C]0.038075[/C][/ROW]
[ROW][C]42[/C][C]0.027723[/C][C]0.395[/C][C]0.346631[/C][/ROW]
[ROW][C]43[/C][C]0.023496[/C][C]0.3348[/C][C]0.369074[/C][/ROW]
[ROW][C]44[/C][C]0.015649[/C][C]0.223[/C][C]0.411896[/C][/ROW]
[ROW][C]45[/C][C]0.026577[/C][C]0.3787[/C][C]0.352665[/C][/ROW]
[ROW][C]46[/C][C]-0.055684[/C][C]-0.7934[/C][C]0.214244[/C][/ROW]
[ROW][C]47[/C][C]-0.026351[/C][C]-0.3755[/C][C]0.353859[/C][/ROW]
[ROW][C]48[/C][C]-0.008742[/C][C]-0.1246[/C][C]0.450499[/C][/ROW]
[/TABLE]
Source: https://freestatistics.org/blog/index.php?pk=293867&T=2

Globally Unique Identifier (entire table): ba.freestatistics.org/blog/index.php?pk=293867&T=2

As an alternative you can also use a QR Code:  

The GUIDs for individual cells are displayed in the table below:

Partial Autocorrelation Function
Time lag kPACF(k)T-STATP-value
10.1204481.71610.043833
20.0344650.49110.311959
3-0.280525-3.99694.5e-05
4-0.14354-2.04510.021066
50.0012740.01810.49277
6-0.139633-1.98950.023997
7-0.169533-2.41550.0083
8-0.18473-2.6320.00457
9-0.408603-5.82170
10-0.05097-0.72620.234272
11-0.047937-0.6830.247695
120.6453259.19450
13-0.001975-0.02810.488789
14-0.018067-0.25740.39856
150.0099120.14120.443917
160.0425120.60570.272693
17-0.069175-0.98560.162752
180.0249320.35520.361394
19-0.058189-0.82910.204021
20-0.008871-0.12640.449776
210.0299760.42710.334882
22-0.127046-1.81010.035877
23-0.104589-1.49020.068866
240.1612332.29720.011313
25-0.053705-0.76520.222526
26-0.015732-0.22420.411433
27-0.080616-1.14860.126035
280.0239050.34060.366879
290.0373690.53240.297505
30-0.066836-0.95230.171047
31-0.051421-0.73260.232312
32-0.122665-1.74770.041014
33-0.080918-1.15290.125153
340.0090590.12910.448712
350.0381490.54350.293676
360.1506262.14610.016526
370.0394420.5620.287382
38-0.087921-1.25270.10588
39-0.032275-0.45990.323058
400.081611.16280.123145
41-0.125112-1.78260.038075
420.0277230.3950.346631
430.0234960.33480.369074
440.0156490.2230.411896
450.0265770.37870.352665
46-0.055684-0.79340.214244
47-0.026351-0.37550.353859
48-0.008742-0.12460.450499


Parameters (Session):
par1 = 48 ; par2 = 1 ; par3 = 1 ; par4 = 0 ; par5 = 12 ; par6 = White Noise ; par7 = 0.95 ;
Parameters (R input):
par1 = 48 ; par2 = 1 ; par3 = 1 ; par4 = 0 ; par5 = 12 ; par6 = White Noise ; par7 = 0.95 ; par8 = ;
R code (references can be found in the software module):
par8 <- ''
par7 <- '0.95'
par6 <- 'White Noise'
par5 <- '12'
par4 <- '0'
par3 <- '0'
par2 <- '1'
par1 <- '48'
if (par1 == 'Default') {
par1 = 10*log10(length(x))
} else {
par1 <- as.numeric(par1)
}
par2 <- as.numeric(par2)
par3 <- as.numeric(par3)
par4 <- as.numeric(par4)
par5 <- as.numeric(par5)
if (par6 == 'White Noise') par6 <- 'white' else par6 <- 'ma'
par7 <- as.numeric(par7)
if (par8 != '') par8 <- as.numeric(par8)
x <- na.omit(x)
ox <- x
if (par8 == '') {
if (par2 == 0) {
x <- log(x)
} else {
x <- (x ^ par2 - 1) / par2
}
} else {
x <- log(x,base=par8)
}
if (par3 > 0) x <- diff(x,lag=1,difference=par3)
if (par4 > 0) x <- diff(x,lag=par5,difference=par4)
bitmap(file='picts.png')
op <- par(mfrow=c(2,1))
plot(ox,type='l',main='Original Time Series',xlab='time',ylab='value')
if (par8=='') {
mytitle <- paste('Working Time Series (lambda=',par2,', d=',par3,', D=',par4,')',sep='')
mysub <- paste('(lambda=',par2,', d=',par3,', D=',par4,', CI=', par7, ', CI type=',par6,')',sep='')
} else {
mytitle <- paste('Working Time Series (base=',par8,', d=',par3,', D=',par4,')',sep='')
mysub <- paste('(base=',par8,', d=',par3,', D=',par4,', CI=', par7, ', CI type=',par6,')',sep='')
}
plot(x,type='l', main=mytitle,xlab='time',ylab='value')
par(op)
dev.off()
bitmap(file='pic1.png')
racf <- acf(x, par1, main='Autocorrelation', xlab='time lag', ylab='ACF', ci.type=par6, ci=par7, sub=mysub)
dev.off()
bitmap(file='pic2.png')
rpacf <- pacf(x,par1,main='Partial Autocorrelation',xlab='lags',ylab='PACF',sub=mysub)
dev.off()
(myacf <- c(racf$acf))
(mypacf <- c(rpacf$acf))
lengthx <- length(x)
sqrtn <- sqrt(lengthx)
load(file='createtable')
a<-table.start()
a<-table.row.start(a)
a<-table.element(a,'Autocorrelation Function',4,TRUE)
a<-table.row.end(a)
a<-table.row.start(a)
a<-table.element(a,'Time lag k',header=TRUE)
a<-table.element(a,hyperlink('basics.htm','ACF(k)','click here for more information about the Autocorrelation Function'),header=TRUE)
a<-table.element(a,'T-STAT',header=TRUE)
a<-table.element(a,'P-value',header=TRUE)
a<-table.row.end(a)
for (i in 2:(par1+1)) {
a<-table.row.start(a)
a<-table.element(a,i-1,header=TRUE)
a<-table.element(a,round(myacf[i],6))
mytstat <- myacf[i]*sqrtn
a<-table.element(a,round(mytstat,4))
a<-table.element(a,round(1-pt(abs(mytstat),lengthx),6))
a<-table.row.end(a)
}
a<-table.end(a)
table.save(a,file='mytable.tab')
a<-table.start()
a<-table.row.start(a)
a<-table.element(a,'Partial Autocorrelation Function',4,TRUE)
a<-table.row.end(a)
a<-table.row.start(a)
a<-table.element(a,'Time lag k',header=TRUE)
a<-table.element(a,hyperlink('basics.htm','PACF(k)','click here for more information about the Partial Autocorrelation Function'),header=TRUE)
a<-table.element(a,'T-STAT',header=TRUE)
a<-table.element(a,'P-value',header=TRUE)
a<-table.row.end(a)
for (i in 1:par1) {
a<-table.row.start(a)
a<-table.element(a,i,header=TRUE)
a<-table.element(a,round(mypacf[i],6))
mytstat <- mypacf[i]*sqrtn
a<-table.element(a,round(mytstat,4))
a<-table.element(a,round(1-pt(abs(mytstat),lengthx),6))
a<-table.row.end(a)
}
a<-table.end(a)
table.save(a,file='mytable1.tab')