Free Statistics

of Irreproducible Research!

Author's title

Author*Unverified author*
R Software Modulerwasp_autocorrelation.wasp
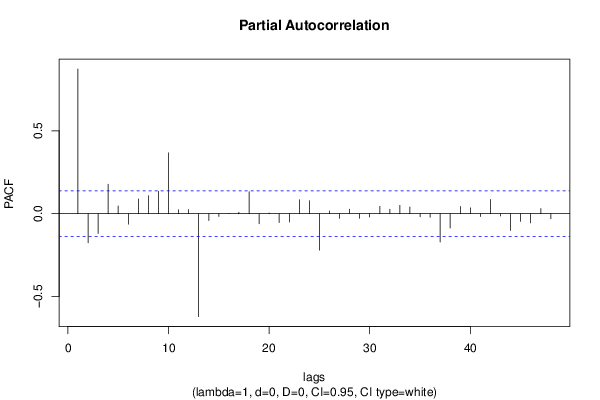
Title produced by software(Partial) Autocorrelation Function
Date of computationFri, 11 Mar 2016 15:33:07 +0000
Cite this page as followsStatistical Computations at FreeStatistics.org, Office for Research Development and Education, URL https://freestatistics.org/blog/index.php?v=date/2016/Mar/11/t14577104518f5qe43j6897qfh.htm/, Retrieved Sat, 18 May 2024 17:52:01 +0000
Statistical Computations at FreeStatistics.org, Office for Research Development and Education, URL https://freestatistics.org/blog/index.php?pk=293865, Retrieved Sat, 18 May 2024 17:52:01 +0000
QR Codes:

Original text written by user:
IsPrivate?No (this computation is public)
User-defined keywords
Estimated Impact172
Family? (F = Feedback message, R = changed R code, M = changed R Module, P = changed Parameters, D = changed Data)
-       [(Partial) Autocorrelation Function] [] [2016-03-11 15:33:07] [c0731e2da3d44c5042060944ee7b2289] [Current]
Feedback Forum

Post a new message
Dataseries X:
7612
7381
6978
6819
6688
6454
6679
6921
7807
7898
7832
7384
7620
7281
6929
6587
6071
5928
5964
6374
7160
7213
6890
6525
6739
6580
6391
6254
6114
5978
6315
6427
7132
7292
7708
7525
7450
7526
7263
7070
6893
6781
7188
7015
8273
8470
8230
8137
8122
8367
8141
7750
7504
7330
7608
7647
8942
8865
8320
8207
8105
8290
8162
8051
7699
7440
7656
7549
9086
8942
8764
8500
8239
8443
8349
8288
7970
7496
7745
7543
9036
9075
8859
8605
8419
8495
8284
7582
7691
7046
7442
7596
8597
8436
7881
7477
7508
7361
7299
6914
6768
6746
7052
7139
7714
7750
7622
7424
7444
7208
7128
7022
6688
6199
6400
6474
7182
7330
7410
7442
7753
7762
7814
7838
7298
7155
7076
7450
8216
8246
8335
8171
8485
8435
8369
8210
7888
8061
8139
7837
8943
8523
8104
7969
7921
7930
7706
7552
7379
6946
7128
7393
8092
8004
7903
7710
7867
7860
7723
7477
7126
7161
7162
7406
7944
8084
8088
7972
8184
7914
7845
7610
7278
6883
7123
7182
7912
7893
7671
7403
7663
7589
7450
7069
6670
6285
6506
6539
7291
7391
7126
6752
6835
6664
6562
6174
5741
5398
5203
5673
6379
6418
6272
6059


Summary of computational transaction
Raw Inputview raw input (R code)
Raw Outputview raw output of R engine
Computing time2 seconds
R Server'Sir Maurice George Kendall' @ kendall.wessa.net

\begin{tabular}{lllllllll}
\hline
Summary of computational transaction \tabularnewline
Raw Input & view raw input (R code)  \tabularnewline
Raw Output & view raw output of R engine  \tabularnewline
Computing time & 2 seconds \tabularnewline
R Server & 'Sir Maurice George Kendall' @ kendall.wessa.net \tabularnewline
\hline
\end{tabular}
%Source: https://freestatistics.org/blog/index.php?pk=293865&T=0

[TABLE]
[ROW][C]Summary of computational transaction[/C][/ROW]
[ROW][C]Raw Input[/C][C]view raw input (R code) [/C][/ROW]
[ROW][C]Raw Output[/C][C]view raw output of R engine [/C][/ROW]
[ROW][C]Computing time[/C][C]2 seconds[/C][/ROW]
[ROW][C]R Server[/C][C]'Sir Maurice George Kendall' @ kendall.wessa.net[/C][/ROW]
[/TABLE]
Source: https://freestatistics.org/blog/index.php?pk=293865&T=0

Globally Unique Identifier (entire table): ba.freestatistics.org/blog/index.php?pk=293865&T=0

As an alternative you can also use a QR Code:  

The GUIDs for individual cells are displayed in the table below:

Summary of computational transaction
Raw Inputview raw input (R code)
Raw Outputview raw output of R engine
Computing time2 seconds
R Server'Sir Maurice George Kendall' @ kendall.wessa.net


Autocorrelation Function
Time lag kACF(k)T-STATP-value
10.87337312.47430
20.7211510.30010
30.5597457.99480
40.4608566.58230
50.399295.7030
60.3477764.96721e-06
70.3174914.53475e-06
80.3101124.42938e-06
90.3402144.85921e-06
100.4440166.34180
110.533247.61620
120.5954228.50430
130.4781366.82920
140.3341584.77272e-06
150.1875782.67920.003992
160.0919221.31290.095343
170.0305310.43610.331625
18-0.010796-0.15420.438804
19-0.043648-0.62340.266852
20-0.046693-0.66690.252791
21-0.021517-0.30730.379456
220.069670.99510.160438
230.1574692.24910.012787
240.2230383.18560.000836
250.1340621.91480.028459
260.0183510.26210.396752
27-0.103829-1.4830.069812
28-0.173259-2.47460.007077
29-0.216258-3.08880.001145
30-0.243719-3.4810.000305
31-0.261684-3.73760.000121
32-0.250845-3.58280.000213
33-0.206525-2.94980.001776
34-0.09689-1.38390.083957
350.0059990.08570.465903
360.0849091.21270.113316
370.0135770.19390.423219
38-0.088654-1.26620.103436
39-0.1929-2.75520.003199
40-0.249607-3.56510.000227
41-0.284156-4.05863.5e-05
42-0.300938-4.29831.3e-05
43-0.311196-4.44487e-06
44-0.296075-4.22881.8e-05
45-0.253304-3.61790.000187
46-0.149289-2.13230.01709
47-0.047686-0.68110.248295
480.0226780.32390.373168

\begin{tabular}{lllllllll}
\hline
Autocorrelation Function \tabularnewline
Time lag k & ACF(k) & T-STAT & P-value \tabularnewline
1 & 0.873373 & 12.4743 & 0 \tabularnewline
2 & 0.72115 & 10.3001 & 0 \tabularnewline
3 & 0.559745 & 7.9948 & 0 \tabularnewline
4 & 0.460856 & 6.5823 & 0 \tabularnewline
5 & 0.39929 & 5.703 & 0 \tabularnewline
6 & 0.347776 & 4.9672 & 1e-06 \tabularnewline
7 & 0.317491 & 4.5347 & 5e-06 \tabularnewline
8 & 0.310112 & 4.4293 & 8e-06 \tabularnewline
9 & 0.340214 & 4.8592 & 1e-06 \tabularnewline
10 & 0.444016 & 6.3418 & 0 \tabularnewline
11 & 0.53324 & 7.6162 & 0 \tabularnewline
12 & 0.595422 & 8.5043 & 0 \tabularnewline
13 & 0.478136 & 6.8292 & 0 \tabularnewline
14 & 0.334158 & 4.7727 & 2e-06 \tabularnewline
15 & 0.187578 & 2.6792 & 0.003992 \tabularnewline
16 & 0.091922 & 1.3129 & 0.095343 \tabularnewline
17 & 0.030531 & 0.4361 & 0.331625 \tabularnewline
18 & -0.010796 & -0.1542 & 0.438804 \tabularnewline
19 & -0.043648 & -0.6234 & 0.266852 \tabularnewline
20 & -0.046693 & -0.6669 & 0.252791 \tabularnewline
21 & -0.021517 & -0.3073 & 0.379456 \tabularnewline
22 & 0.06967 & 0.9951 & 0.160438 \tabularnewline
23 & 0.157469 & 2.2491 & 0.012787 \tabularnewline
24 & 0.223038 & 3.1856 & 0.000836 \tabularnewline
25 & 0.134062 & 1.9148 & 0.028459 \tabularnewline
26 & 0.018351 & 0.2621 & 0.396752 \tabularnewline
27 & -0.103829 & -1.483 & 0.069812 \tabularnewline
28 & -0.173259 & -2.4746 & 0.007077 \tabularnewline
29 & -0.216258 & -3.0888 & 0.001145 \tabularnewline
30 & -0.243719 & -3.481 & 0.000305 \tabularnewline
31 & -0.261684 & -3.7376 & 0.000121 \tabularnewline
32 & -0.250845 & -3.5828 & 0.000213 \tabularnewline
33 & -0.206525 & -2.9498 & 0.001776 \tabularnewline
34 & -0.09689 & -1.3839 & 0.083957 \tabularnewline
35 & 0.005999 & 0.0857 & 0.465903 \tabularnewline
36 & 0.084909 & 1.2127 & 0.113316 \tabularnewline
37 & 0.013577 & 0.1939 & 0.423219 \tabularnewline
38 & -0.088654 & -1.2662 & 0.103436 \tabularnewline
39 & -0.1929 & -2.7552 & 0.003199 \tabularnewline
40 & -0.249607 & -3.5651 & 0.000227 \tabularnewline
41 & -0.284156 & -4.0586 & 3.5e-05 \tabularnewline
42 & -0.300938 & -4.2983 & 1.3e-05 \tabularnewline
43 & -0.311196 & -4.4448 & 7e-06 \tabularnewline
44 & -0.296075 & -4.2288 & 1.8e-05 \tabularnewline
45 & -0.253304 & -3.6179 & 0.000187 \tabularnewline
46 & -0.149289 & -2.1323 & 0.01709 \tabularnewline
47 & -0.047686 & -0.6811 & 0.248295 \tabularnewline
48 & 0.022678 & 0.3239 & 0.373168 \tabularnewline
\hline
\end{tabular}
%Source: https://freestatistics.org/blog/index.php?pk=293865&T=1

[TABLE]
[ROW][C]Autocorrelation Function[/C][/ROW]
[ROW][C]Time lag k[/C][C]ACF(k)[/C][C]T-STAT[/C][C]P-value[/C][/ROW]
[ROW][C]1[/C][C]0.873373[/C][C]12.4743[/C][C]0[/C][/ROW]
[ROW][C]2[/C][C]0.72115[/C][C]10.3001[/C][C]0[/C][/ROW]
[ROW][C]3[/C][C]0.559745[/C][C]7.9948[/C][C]0[/C][/ROW]
[ROW][C]4[/C][C]0.460856[/C][C]6.5823[/C][C]0[/C][/ROW]
[ROW][C]5[/C][C]0.39929[/C][C]5.703[/C][C]0[/C][/ROW]
[ROW][C]6[/C][C]0.347776[/C][C]4.9672[/C][C]1e-06[/C][/ROW]
[ROW][C]7[/C][C]0.317491[/C][C]4.5347[/C][C]5e-06[/C][/ROW]
[ROW][C]8[/C][C]0.310112[/C][C]4.4293[/C][C]8e-06[/C][/ROW]
[ROW][C]9[/C][C]0.340214[/C][C]4.8592[/C][C]1e-06[/C][/ROW]
[ROW][C]10[/C][C]0.444016[/C][C]6.3418[/C][C]0[/C][/ROW]
[ROW][C]11[/C][C]0.53324[/C][C]7.6162[/C][C]0[/C][/ROW]
[ROW][C]12[/C][C]0.595422[/C][C]8.5043[/C][C]0[/C][/ROW]
[ROW][C]13[/C][C]0.478136[/C][C]6.8292[/C][C]0[/C][/ROW]
[ROW][C]14[/C][C]0.334158[/C][C]4.7727[/C][C]2e-06[/C][/ROW]
[ROW][C]15[/C][C]0.187578[/C][C]2.6792[/C][C]0.003992[/C][/ROW]
[ROW][C]16[/C][C]0.091922[/C][C]1.3129[/C][C]0.095343[/C][/ROW]
[ROW][C]17[/C][C]0.030531[/C][C]0.4361[/C][C]0.331625[/C][/ROW]
[ROW][C]18[/C][C]-0.010796[/C][C]-0.1542[/C][C]0.438804[/C][/ROW]
[ROW][C]19[/C][C]-0.043648[/C][C]-0.6234[/C][C]0.266852[/C][/ROW]
[ROW][C]20[/C][C]-0.046693[/C][C]-0.6669[/C][C]0.252791[/C][/ROW]
[ROW][C]21[/C][C]-0.021517[/C][C]-0.3073[/C][C]0.379456[/C][/ROW]
[ROW][C]22[/C][C]0.06967[/C][C]0.9951[/C][C]0.160438[/C][/ROW]
[ROW][C]23[/C][C]0.157469[/C][C]2.2491[/C][C]0.012787[/C][/ROW]
[ROW][C]24[/C][C]0.223038[/C][C]3.1856[/C][C]0.000836[/C][/ROW]
[ROW][C]25[/C][C]0.134062[/C][C]1.9148[/C][C]0.028459[/C][/ROW]
[ROW][C]26[/C][C]0.018351[/C][C]0.2621[/C][C]0.396752[/C][/ROW]
[ROW][C]27[/C][C]-0.103829[/C][C]-1.483[/C][C]0.069812[/C][/ROW]
[ROW][C]28[/C][C]-0.173259[/C][C]-2.4746[/C][C]0.007077[/C][/ROW]
[ROW][C]29[/C][C]-0.216258[/C][C]-3.0888[/C][C]0.001145[/C][/ROW]
[ROW][C]30[/C][C]-0.243719[/C][C]-3.481[/C][C]0.000305[/C][/ROW]
[ROW][C]31[/C][C]-0.261684[/C][C]-3.7376[/C][C]0.000121[/C][/ROW]
[ROW][C]32[/C][C]-0.250845[/C][C]-3.5828[/C][C]0.000213[/C][/ROW]
[ROW][C]33[/C][C]-0.206525[/C][C]-2.9498[/C][C]0.001776[/C][/ROW]
[ROW][C]34[/C][C]-0.09689[/C][C]-1.3839[/C][C]0.083957[/C][/ROW]
[ROW][C]35[/C][C]0.005999[/C][C]0.0857[/C][C]0.465903[/C][/ROW]
[ROW][C]36[/C][C]0.084909[/C][C]1.2127[/C][C]0.113316[/C][/ROW]
[ROW][C]37[/C][C]0.013577[/C][C]0.1939[/C][C]0.423219[/C][/ROW]
[ROW][C]38[/C][C]-0.088654[/C][C]-1.2662[/C][C]0.103436[/C][/ROW]
[ROW][C]39[/C][C]-0.1929[/C][C]-2.7552[/C][C]0.003199[/C][/ROW]
[ROW][C]40[/C][C]-0.249607[/C][C]-3.5651[/C][C]0.000227[/C][/ROW]
[ROW][C]41[/C][C]-0.284156[/C][C]-4.0586[/C][C]3.5e-05[/C][/ROW]
[ROW][C]42[/C][C]-0.300938[/C][C]-4.2983[/C][C]1.3e-05[/C][/ROW]
[ROW][C]43[/C][C]-0.311196[/C][C]-4.4448[/C][C]7e-06[/C][/ROW]
[ROW][C]44[/C][C]-0.296075[/C][C]-4.2288[/C][C]1.8e-05[/C][/ROW]
[ROW][C]45[/C][C]-0.253304[/C][C]-3.6179[/C][C]0.000187[/C][/ROW]
[ROW][C]46[/C][C]-0.149289[/C][C]-2.1323[/C][C]0.01709[/C][/ROW]
[ROW][C]47[/C][C]-0.047686[/C][C]-0.6811[/C][C]0.248295[/C][/ROW]
[ROW][C]48[/C][C]0.022678[/C][C]0.3239[/C][C]0.373168[/C][/ROW]
[/TABLE]
Source: https://freestatistics.org/blog/index.php?pk=293865&T=1

Globally Unique Identifier (entire table): ba.freestatistics.org/blog/index.php?pk=293865&T=1

As an alternative you can also use a QR Code:  

The GUIDs for individual cells are displayed in the table below:

Autocorrelation Function
Time lag kACF(k)T-STATP-value
10.87337312.47430
20.7211510.30010
30.5597457.99480
40.4608566.58230
50.399295.7030
60.3477764.96721e-06
70.3174914.53475e-06
80.3101124.42938e-06
90.3402144.85921e-06
100.4440166.34180
110.533247.61620
120.5954228.50430
130.4781366.82920
140.3341584.77272e-06
150.1875782.67920.003992
160.0919221.31290.095343
170.0305310.43610.331625
18-0.010796-0.15420.438804
19-0.043648-0.62340.266852
20-0.046693-0.66690.252791
21-0.021517-0.30730.379456
220.069670.99510.160438
230.1574692.24910.012787
240.2230383.18560.000836
250.1340621.91480.028459
260.0183510.26210.396752
27-0.103829-1.4830.069812
28-0.173259-2.47460.007077
29-0.216258-3.08880.001145
30-0.243719-3.4810.000305
31-0.261684-3.73760.000121
32-0.250845-3.58280.000213
33-0.206525-2.94980.001776
34-0.09689-1.38390.083957
350.0059990.08570.465903
360.0849091.21270.113316
370.0135770.19390.423219
38-0.088654-1.26620.103436
39-0.1929-2.75520.003199
40-0.249607-3.56510.000227
41-0.284156-4.05863.5e-05
42-0.300938-4.29831.3e-05
43-0.311196-4.44487e-06
44-0.296075-4.22881.8e-05
45-0.253304-3.61790.000187
46-0.149289-2.13230.01709
47-0.047686-0.68110.248295
480.0226780.32390.373168


Partial Autocorrelation Function
Time lag kPACF(k)T-STATP-value
10.87337312.47430
2-0.175495-2.50660.006486
3-0.118946-1.69890.045432
40.1776192.53690.005966
50.0459650.65650.256119
6-0.063082-0.9010.184329
70.0891521.27330.102172
80.1083461.54750.061648
90.1353371.9330.027311
100.3668195.23920
110.0241740.34530.365121
120.025190.35980.359688
13-0.62136-8.87480
14-0.041284-0.58960.27804
15-0.016225-0.23170.408487
160.000890.01270.494937
170.0082670.11810.453059
180.1325361.8930.029887
19-0.060725-0.86730.193392
200.0037360.05340.478748
21-0.053285-0.76110.223749
22-0.050051-0.71490.237753
230.0843751.20510.114776
240.0778481.11190.133746
25-0.21987-3.14040.000969
260.0160190.22880.409627
27-0.028551-0.40780.341926
280.0265440.37910.352493
29-0.027519-0.39310.347344
30-0.02042-0.29170.385424
310.0442340.63180.264115
320.0265320.37890.352561
330.0500210.71440.237886
340.0404620.57790.281979
35-0.018556-0.2650.395628
36-0.021934-0.31330.377196
37-0.17059-2.43650.007844
38-0.086741-1.23890.108402
390.0432430.61760.268755
400.0350280.50030.308703
41-0.016992-0.24270.404241
420.0852421.21750.112411
43-0.013563-0.19370.423295
44-0.101207-1.44550.074922
45-0.046602-0.66560.253208
46-0.055528-0.79310.214319
470.0306790.43820.330859
48-0.030427-0.43460.332159

\begin{tabular}{lllllllll}
\hline
Partial Autocorrelation Function \tabularnewline
Time lag k & PACF(k) & T-STAT & P-value \tabularnewline
1 & 0.873373 & 12.4743 & 0 \tabularnewline
2 & -0.175495 & -2.5066 & 0.006486 \tabularnewline
3 & -0.118946 & -1.6989 & 0.045432 \tabularnewline
4 & 0.177619 & 2.5369 & 0.005966 \tabularnewline
5 & 0.045965 & 0.6565 & 0.256119 \tabularnewline
6 & -0.063082 & -0.901 & 0.184329 \tabularnewline
7 & 0.089152 & 1.2733 & 0.102172 \tabularnewline
8 & 0.108346 & 1.5475 & 0.061648 \tabularnewline
9 & 0.135337 & 1.933 & 0.027311 \tabularnewline
10 & 0.366819 & 5.2392 & 0 \tabularnewline
11 & 0.024174 & 0.3453 & 0.365121 \tabularnewline
12 & 0.02519 & 0.3598 & 0.359688 \tabularnewline
13 & -0.62136 & -8.8748 & 0 \tabularnewline
14 & -0.041284 & -0.5896 & 0.27804 \tabularnewline
15 & -0.016225 & -0.2317 & 0.408487 \tabularnewline
16 & 0.00089 & 0.0127 & 0.494937 \tabularnewline
17 & 0.008267 & 0.1181 & 0.453059 \tabularnewline
18 & 0.132536 & 1.893 & 0.029887 \tabularnewline
19 & -0.060725 & -0.8673 & 0.193392 \tabularnewline
20 & 0.003736 & 0.0534 & 0.478748 \tabularnewline
21 & -0.053285 & -0.7611 & 0.223749 \tabularnewline
22 & -0.050051 & -0.7149 & 0.237753 \tabularnewline
23 & 0.084375 & 1.2051 & 0.114776 \tabularnewline
24 & 0.077848 & 1.1119 & 0.133746 \tabularnewline
25 & -0.21987 & -3.1404 & 0.000969 \tabularnewline
26 & 0.016019 & 0.2288 & 0.409627 \tabularnewline
27 & -0.028551 & -0.4078 & 0.341926 \tabularnewline
28 & 0.026544 & 0.3791 & 0.352493 \tabularnewline
29 & -0.027519 & -0.3931 & 0.347344 \tabularnewline
30 & -0.02042 & -0.2917 & 0.385424 \tabularnewline
31 & 0.044234 & 0.6318 & 0.264115 \tabularnewline
32 & 0.026532 & 0.3789 & 0.352561 \tabularnewline
33 & 0.050021 & 0.7144 & 0.237886 \tabularnewline
34 & 0.040462 & 0.5779 & 0.281979 \tabularnewline
35 & -0.018556 & -0.265 & 0.395628 \tabularnewline
36 & -0.021934 & -0.3133 & 0.377196 \tabularnewline
37 & -0.17059 & -2.4365 & 0.007844 \tabularnewline
38 & -0.086741 & -1.2389 & 0.108402 \tabularnewline
39 & 0.043243 & 0.6176 & 0.268755 \tabularnewline
40 & 0.035028 & 0.5003 & 0.308703 \tabularnewline
41 & -0.016992 & -0.2427 & 0.404241 \tabularnewline
42 & 0.085242 & 1.2175 & 0.112411 \tabularnewline
43 & -0.013563 & -0.1937 & 0.423295 \tabularnewline
44 & -0.101207 & -1.4455 & 0.074922 \tabularnewline
45 & -0.046602 & -0.6656 & 0.253208 \tabularnewline
46 & -0.055528 & -0.7931 & 0.214319 \tabularnewline
47 & 0.030679 & 0.4382 & 0.330859 \tabularnewline
48 & -0.030427 & -0.4346 & 0.332159 \tabularnewline
\hline
\end{tabular}
%Source: https://freestatistics.org/blog/index.php?pk=293865&T=2

[TABLE]
[ROW][C]Partial Autocorrelation Function[/C][/ROW]
[ROW][C]Time lag k[/C][C]PACF(k)[/C][C]T-STAT[/C][C]P-value[/C][/ROW]
[ROW][C]1[/C][C]0.873373[/C][C]12.4743[/C][C]0[/C][/ROW]
[ROW][C]2[/C][C]-0.175495[/C][C]-2.5066[/C][C]0.006486[/C][/ROW]
[ROW][C]3[/C][C]-0.118946[/C][C]-1.6989[/C][C]0.045432[/C][/ROW]
[ROW][C]4[/C][C]0.177619[/C][C]2.5369[/C][C]0.005966[/C][/ROW]
[ROW][C]5[/C][C]0.045965[/C][C]0.6565[/C][C]0.256119[/C][/ROW]
[ROW][C]6[/C][C]-0.063082[/C][C]-0.901[/C][C]0.184329[/C][/ROW]
[ROW][C]7[/C][C]0.089152[/C][C]1.2733[/C][C]0.102172[/C][/ROW]
[ROW][C]8[/C][C]0.108346[/C][C]1.5475[/C][C]0.061648[/C][/ROW]
[ROW][C]9[/C][C]0.135337[/C][C]1.933[/C][C]0.027311[/C][/ROW]
[ROW][C]10[/C][C]0.366819[/C][C]5.2392[/C][C]0[/C][/ROW]
[ROW][C]11[/C][C]0.024174[/C][C]0.3453[/C][C]0.365121[/C][/ROW]
[ROW][C]12[/C][C]0.02519[/C][C]0.3598[/C][C]0.359688[/C][/ROW]
[ROW][C]13[/C][C]-0.62136[/C][C]-8.8748[/C][C]0[/C][/ROW]
[ROW][C]14[/C][C]-0.041284[/C][C]-0.5896[/C][C]0.27804[/C][/ROW]
[ROW][C]15[/C][C]-0.016225[/C][C]-0.2317[/C][C]0.408487[/C][/ROW]
[ROW][C]16[/C][C]0.00089[/C][C]0.0127[/C][C]0.494937[/C][/ROW]
[ROW][C]17[/C][C]0.008267[/C][C]0.1181[/C][C]0.453059[/C][/ROW]
[ROW][C]18[/C][C]0.132536[/C][C]1.893[/C][C]0.029887[/C][/ROW]
[ROW][C]19[/C][C]-0.060725[/C][C]-0.8673[/C][C]0.193392[/C][/ROW]
[ROW][C]20[/C][C]0.003736[/C][C]0.0534[/C][C]0.478748[/C][/ROW]
[ROW][C]21[/C][C]-0.053285[/C][C]-0.7611[/C][C]0.223749[/C][/ROW]
[ROW][C]22[/C][C]-0.050051[/C][C]-0.7149[/C][C]0.237753[/C][/ROW]
[ROW][C]23[/C][C]0.084375[/C][C]1.2051[/C][C]0.114776[/C][/ROW]
[ROW][C]24[/C][C]0.077848[/C][C]1.1119[/C][C]0.133746[/C][/ROW]
[ROW][C]25[/C][C]-0.21987[/C][C]-3.1404[/C][C]0.000969[/C][/ROW]
[ROW][C]26[/C][C]0.016019[/C][C]0.2288[/C][C]0.409627[/C][/ROW]
[ROW][C]27[/C][C]-0.028551[/C][C]-0.4078[/C][C]0.341926[/C][/ROW]
[ROW][C]28[/C][C]0.026544[/C][C]0.3791[/C][C]0.352493[/C][/ROW]
[ROW][C]29[/C][C]-0.027519[/C][C]-0.3931[/C][C]0.347344[/C][/ROW]
[ROW][C]30[/C][C]-0.02042[/C][C]-0.2917[/C][C]0.385424[/C][/ROW]
[ROW][C]31[/C][C]0.044234[/C][C]0.6318[/C][C]0.264115[/C][/ROW]
[ROW][C]32[/C][C]0.026532[/C][C]0.3789[/C][C]0.352561[/C][/ROW]
[ROW][C]33[/C][C]0.050021[/C][C]0.7144[/C][C]0.237886[/C][/ROW]
[ROW][C]34[/C][C]0.040462[/C][C]0.5779[/C][C]0.281979[/C][/ROW]
[ROW][C]35[/C][C]-0.018556[/C][C]-0.265[/C][C]0.395628[/C][/ROW]
[ROW][C]36[/C][C]-0.021934[/C][C]-0.3133[/C][C]0.377196[/C][/ROW]
[ROW][C]37[/C][C]-0.17059[/C][C]-2.4365[/C][C]0.007844[/C][/ROW]
[ROW][C]38[/C][C]-0.086741[/C][C]-1.2389[/C][C]0.108402[/C][/ROW]
[ROW][C]39[/C][C]0.043243[/C][C]0.6176[/C][C]0.268755[/C][/ROW]
[ROW][C]40[/C][C]0.035028[/C][C]0.5003[/C][C]0.308703[/C][/ROW]
[ROW][C]41[/C][C]-0.016992[/C][C]-0.2427[/C][C]0.404241[/C][/ROW]
[ROW][C]42[/C][C]0.085242[/C][C]1.2175[/C][C]0.112411[/C][/ROW]
[ROW][C]43[/C][C]-0.013563[/C][C]-0.1937[/C][C]0.423295[/C][/ROW]
[ROW][C]44[/C][C]-0.101207[/C][C]-1.4455[/C][C]0.074922[/C][/ROW]
[ROW][C]45[/C][C]-0.046602[/C][C]-0.6656[/C][C]0.253208[/C][/ROW]
[ROW][C]46[/C][C]-0.055528[/C][C]-0.7931[/C][C]0.214319[/C][/ROW]
[ROW][C]47[/C][C]0.030679[/C][C]0.4382[/C][C]0.330859[/C][/ROW]
[ROW][C]48[/C][C]-0.030427[/C][C]-0.4346[/C][C]0.332159[/C][/ROW]
[/TABLE]
Source: https://freestatistics.org/blog/index.php?pk=293865&T=2

Globally Unique Identifier (entire table): ba.freestatistics.org/blog/index.php?pk=293865&T=2

As an alternative you can also use a QR Code:  

The GUIDs for individual cells are displayed in the table below:

Partial Autocorrelation Function
Time lag kPACF(k)T-STATP-value
10.87337312.47430
2-0.175495-2.50660.006486
3-0.118946-1.69890.045432
40.1776192.53690.005966
50.0459650.65650.256119
6-0.063082-0.9010.184329
70.0891521.27330.102172
80.1083461.54750.061648
90.1353371.9330.027311
100.3668195.23920
110.0241740.34530.365121
120.025190.35980.359688
13-0.62136-8.87480
14-0.041284-0.58960.27804
15-0.016225-0.23170.408487
160.000890.01270.494937
170.0082670.11810.453059
180.1325361.8930.029887
19-0.060725-0.86730.193392
200.0037360.05340.478748
21-0.053285-0.76110.223749
22-0.050051-0.71490.237753
230.0843751.20510.114776
240.0778481.11190.133746
25-0.21987-3.14040.000969
260.0160190.22880.409627
27-0.028551-0.40780.341926
280.0265440.37910.352493
29-0.027519-0.39310.347344
30-0.02042-0.29170.385424
310.0442340.63180.264115
320.0265320.37890.352561
330.0500210.71440.237886
340.0404620.57790.281979
35-0.018556-0.2650.395628
36-0.021934-0.31330.377196
37-0.17059-2.43650.007844
38-0.086741-1.23890.108402
390.0432430.61760.268755
400.0350280.50030.308703
41-0.016992-0.24270.404241
420.0852421.21750.112411
43-0.013563-0.19370.423295
44-0.101207-1.44550.074922
45-0.046602-0.66560.253208
46-0.055528-0.79310.214319
470.0306790.43820.330859
48-0.030427-0.43460.332159


Parameters (Session):
par1 = 48 ; par2 = 1 ; par3 = 0 ; par4 = 0 ; par5 = 12 ; par6 = White Noise ; par7 = 0.95 ;
Parameters (R input):
par1 = 48 ; par2 = 1 ; par3 = 0 ; par4 = 0 ; par5 = 12 ; par6 = White Noise ; par7 = 0.95 ; par8 = ;
R code (references can be found in the software module):
par8 <- ''
par7 <- '0.95'
par6 <- 'White Noise'
par5 <- '12'
par4 <- '0'
par3 <- '1'
par2 <- '1'
par1 <- '48'
if (par1 == 'Default') {
par1 = 10*log10(length(x))
} else {
par1 <- as.numeric(par1)
}
par2 <- as.numeric(par2)
par3 <- as.numeric(par3)
par4 <- as.numeric(par4)
par5 <- as.numeric(par5)
if (par6 == 'White Noise') par6 <- 'white' else par6 <- 'ma'
par7 <- as.numeric(par7)
if (par8 != '') par8 <- as.numeric(par8)
x <- na.omit(x)
ox <- x
if (par8 == '') {
if (par2 == 0) {
x <- log(x)
} else {
x <- (x ^ par2 - 1) / par2
}
} else {
x <- log(x,base=par8)
}
if (par3 > 0) x <- diff(x,lag=1,difference=par3)
if (par4 > 0) x <- diff(x,lag=par5,difference=par4)
bitmap(file='picts.png')
op <- par(mfrow=c(2,1))
plot(ox,type='l',main='Original Time Series',xlab='time',ylab='value')
if (par8=='') {
mytitle <- paste('Working Time Series (lambda=',par2,', d=',par3,', D=',par4,')',sep='')
mysub <- paste('(lambda=',par2,', d=',par3,', D=',par4,', CI=', par7, ', CI type=',par6,')',sep='')
} else {
mytitle <- paste('Working Time Series (base=',par8,', d=',par3,', D=',par4,')',sep='')
mysub <- paste('(base=',par8,', d=',par3,', D=',par4,', CI=', par7, ', CI type=',par6,')',sep='')
}
plot(x,type='l', main=mytitle,xlab='time',ylab='value')
par(op)
dev.off()
bitmap(file='pic1.png')
racf <- acf(x, par1, main='Autocorrelation', xlab='time lag', ylab='ACF', ci.type=par6, ci=par7, sub=mysub)
dev.off()
bitmap(file='pic2.png')
rpacf <- pacf(x,par1,main='Partial Autocorrelation',xlab='lags',ylab='PACF',sub=mysub)
dev.off()
(myacf <- c(racf$acf))
(mypacf <- c(rpacf$acf))
lengthx <- length(x)
sqrtn <- sqrt(lengthx)
load(file='createtable')
a<-table.start()
a<-table.row.start(a)
a<-table.element(a,'Autocorrelation Function',4,TRUE)
a<-table.row.end(a)
a<-table.row.start(a)
a<-table.element(a,'Time lag k',header=TRUE)
a<-table.element(a,hyperlink('basics.htm','ACF(k)','click here for more information about the Autocorrelation Function'),header=TRUE)
a<-table.element(a,'T-STAT',header=TRUE)
a<-table.element(a,'P-value',header=TRUE)
a<-table.row.end(a)
for (i in 2:(par1+1)) {
a<-table.row.start(a)
a<-table.element(a,i-1,header=TRUE)
a<-table.element(a,round(myacf[i],6))
mytstat <- myacf[i]*sqrtn
a<-table.element(a,round(mytstat,4))
a<-table.element(a,round(1-pt(abs(mytstat),lengthx),6))
a<-table.row.end(a)
}
a<-table.end(a)
table.save(a,file='mytable.tab')
a<-table.start()
a<-table.row.start(a)
a<-table.element(a,'Partial Autocorrelation Function',4,TRUE)
a<-table.row.end(a)
a<-table.row.start(a)
a<-table.element(a,'Time lag k',header=TRUE)
a<-table.element(a,hyperlink('basics.htm','PACF(k)','click here for more information about the Partial Autocorrelation Function'),header=TRUE)
a<-table.element(a,'T-STAT',header=TRUE)
a<-table.element(a,'P-value',header=TRUE)
a<-table.row.end(a)
for (i in 1:par1) {
a<-table.row.start(a)
a<-table.element(a,i,header=TRUE)
a<-table.element(a,round(mypacf[i],6))
mytstat <- mypacf[i]*sqrtn
a<-table.element(a,round(mytstat,4))
a<-table.element(a,round(1-pt(abs(mytstat),lengthx),6))
a<-table.row.end(a)
}
a<-table.end(a)
table.save(a,file='mytable1.tab')