Free Statistics

of Irreproducible Research!

Author's title

Author*Unverified author*
R Software Modulerwasp_autocorrelation.wasp
Title produced by software(Partial) Autocorrelation Function
Date of computationFri, 11 Mar 2016 14:05:11 +0000
Cite this page as followsStatistical Computations at FreeStatistics.org, Office for Research Development and Education, URL https://freestatistics.org/blog/index.php?v=date/2016/Mar/11/t14577051264fga68vih9732kf.htm/, Retrieved Sat, 18 May 2024 17:21:27 +0000
Statistical Computations at FreeStatistics.org, Office for Research Development and Education, URL https://freestatistics.org/blog/index.php?pk=293857, Retrieved Sat, 18 May 2024 17:21:27 +0000
QR Codes:

Original text written by user:
IsPrivate?No (this computation is public)
User-defined keywords
Estimated Impact169
Family? (F = Feedback message, R = changed R code, M = changed R Module, P = changed Parameters, D = changed Data)
-       [(Partial) Autocorrelation Function] [] [2016-03-11 14:05:11] [aeeb828bd20a6dc3c22e186b82add773] [Current]
Feedback Forum

Post a new message
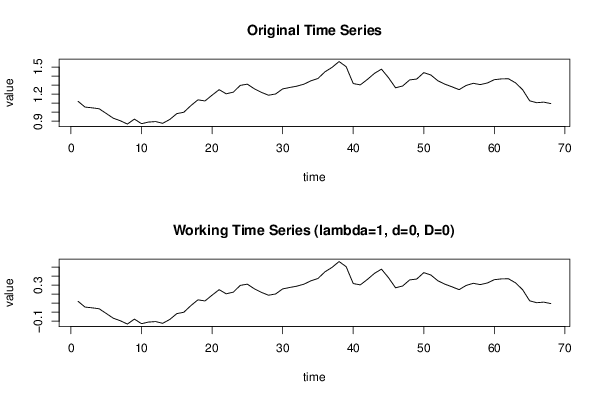
Dataseries X:
1,1216
1,0569
1,0486
1,038
0,9865
0,9332
0,9052
0,8683
0,9232
0,8725
0,8903
0,8959
0,8766
0,9188
0,9838
0,9994
1,0731
1,1372
1,1248
1,189
1,2497
1,2046
1,222
1,2977
1,3113
1,2594
1,2199
1,1884
1,2023
1,2582
1,2743
1,2887
1,3106
1,3481
1,3738
1,4486
1,4976
1,5622
1,505
1,318
1,3029
1,3632
1,4303
1,4779
1,3829
1,2708
1,291
1,3583
1,368
1,4391
1,4127
1,3482
1,3108
1,2814
1,2502
1,2967
1,3206
1,3062
1,3242
1,361
1,3696
1,3711
1,3256
1,2498
1,1261
1,1053
1,1117
1,0953


Summary of computational transaction
Raw Inputview raw input (R code)
Raw Outputview raw output of R engine
Computing time2 seconds
R Server'Gwilym Jenkins' @ jenkins.wessa.net

\begin{tabular}{lllllllll}
\hline
Summary of computational transaction \tabularnewline
Raw Input & view raw input (R code)  \tabularnewline
Raw Output & view raw output of R engine  \tabularnewline
Computing time & 2 seconds \tabularnewline
R Server & 'Gwilym Jenkins' @ jenkins.wessa.net \tabularnewline
\hline
\end{tabular}
%Source: https://freestatistics.org/blog/index.php?pk=293857&T=0

[TABLE]
[ROW][C]Summary of computational transaction[/C][/ROW]
[ROW][C]Raw Input[/C][C]view raw input (R code) [/C][/ROW]
[ROW][C]Raw Output[/C][C]view raw output of R engine [/C][/ROW]
[ROW][C]Computing time[/C][C]2 seconds[/C][/ROW]
[ROW][C]R Server[/C][C]'Gwilym Jenkins' @ jenkins.wessa.net[/C][/ROW]
[/TABLE]
Source: https://freestatistics.org/blog/index.php?pk=293857&T=0

Globally Unique Identifier (entire table): ba.freestatistics.org/blog/index.php?pk=293857&T=0

As an alternative you can also use a QR Code:  

The GUIDs for individual cells are displayed in the table below:

Summary of computational transaction
Raw Inputview raw input (R code)
Raw Outputview raw output of R engine
Computing time2 seconds
R Server'Gwilym Jenkins' @ jenkins.wessa.net


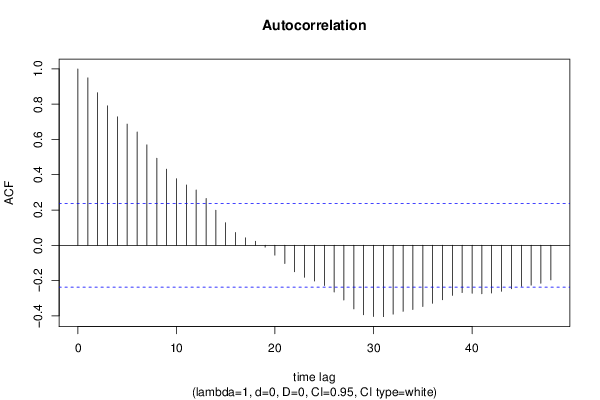
Autocorrelation Function
Time lag kACF(k)T-STATP-value
10.9494627.82950
20.8652147.13470
30.7905196.51880
40.7282996.00570
50.6870025.66520
60.6422685.29631e-06
70.56964.6977e-06
80.4931234.06646.3e-05
90.431733.56010.000341
100.377163.11010.001366
110.3420752.82080.003136
120.3139312.58870.005885
130.2651662.18660.016108
140.1985021.63690.053137
150.1282481.05760.147
160.072270.5960.276591
170.0421990.3480.364465
180.0227610.18770.425838
19-0.010815-0.08920.464598
20-0.055952-0.46140.322995
21-0.103608-0.85440.197949
22-0.150656-1.24230.109188
23-0.181374-1.49570.069686
24-0.202694-1.67150.049614
25-0.228545-1.88460.031877
26-0.264843-2.18390.016209
27-0.310576-2.56110.006329
28-0.360951-2.97650.002018
29-0.394146-3.25020.000897
30-0.404531-3.33590.00069
31-0.404858-3.33850.000685
32-0.390625-3.22120.00098
33-0.374785-3.09060.001447
34-0.364202-3.00330.001868
35-0.347592-2.86630.002761
36-0.329271-2.71520.004194
37-0.309357-2.5510.006498
38-0.284156-2.34320.011025
39-0.268441-2.21360.015106
40-0.272309-2.24550.013995
41-0.274705-2.26530.013343
42-0.271123-2.23570.014328
43-0.2612-2.15390.017397
44-0.246218-2.03040.023116
45-0.233388-1.92460.029235
46-0.22615-1.86490.033257
47-0.215682-1.77860.039891
48-0.196167-1.61760.055186

\begin{tabular}{lllllllll}
\hline
Autocorrelation Function \tabularnewline
Time lag k & ACF(k) & T-STAT & P-value \tabularnewline
1 & 0.949462 & 7.8295 & 0 \tabularnewline
2 & 0.865214 & 7.1347 & 0 \tabularnewline
3 & 0.790519 & 6.5188 & 0 \tabularnewline
4 & 0.728299 & 6.0057 & 0 \tabularnewline
5 & 0.687002 & 5.6652 & 0 \tabularnewline
6 & 0.642268 & 5.2963 & 1e-06 \tabularnewline
7 & 0.5696 & 4.697 & 7e-06 \tabularnewline
8 & 0.493123 & 4.0664 & 6.3e-05 \tabularnewline
9 & 0.43173 & 3.5601 & 0.000341 \tabularnewline
10 & 0.37716 & 3.1101 & 0.001366 \tabularnewline
11 & 0.342075 & 2.8208 & 0.003136 \tabularnewline
12 & 0.313931 & 2.5887 & 0.005885 \tabularnewline
13 & 0.265166 & 2.1866 & 0.016108 \tabularnewline
14 & 0.198502 & 1.6369 & 0.053137 \tabularnewline
15 & 0.128248 & 1.0576 & 0.147 \tabularnewline
16 & 0.07227 & 0.596 & 0.276591 \tabularnewline
17 & 0.042199 & 0.348 & 0.364465 \tabularnewline
18 & 0.022761 & 0.1877 & 0.425838 \tabularnewline
19 & -0.010815 & -0.0892 & 0.464598 \tabularnewline
20 & -0.055952 & -0.4614 & 0.322995 \tabularnewline
21 & -0.103608 & -0.8544 & 0.197949 \tabularnewline
22 & -0.150656 & -1.2423 & 0.109188 \tabularnewline
23 & -0.181374 & -1.4957 & 0.069686 \tabularnewline
24 & -0.202694 & -1.6715 & 0.049614 \tabularnewline
25 & -0.228545 & -1.8846 & 0.031877 \tabularnewline
26 & -0.264843 & -2.1839 & 0.016209 \tabularnewline
27 & -0.310576 & -2.5611 & 0.006329 \tabularnewline
28 & -0.360951 & -2.9765 & 0.002018 \tabularnewline
29 & -0.394146 & -3.2502 & 0.000897 \tabularnewline
30 & -0.404531 & -3.3359 & 0.00069 \tabularnewline
31 & -0.404858 & -3.3385 & 0.000685 \tabularnewline
32 & -0.390625 & -3.2212 & 0.00098 \tabularnewline
33 & -0.374785 & -3.0906 & 0.001447 \tabularnewline
34 & -0.364202 & -3.0033 & 0.001868 \tabularnewline
35 & -0.347592 & -2.8663 & 0.002761 \tabularnewline
36 & -0.329271 & -2.7152 & 0.004194 \tabularnewline
37 & -0.309357 & -2.551 & 0.006498 \tabularnewline
38 & -0.284156 & -2.3432 & 0.011025 \tabularnewline
39 & -0.268441 & -2.2136 & 0.015106 \tabularnewline
40 & -0.272309 & -2.2455 & 0.013995 \tabularnewline
41 & -0.274705 & -2.2653 & 0.013343 \tabularnewline
42 & -0.271123 & -2.2357 & 0.014328 \tabularnewline
43 & -0.2612 & -2.1539 & 0.017397 \tabularnewline
44 & -0.246218 & -2.0304 & 0.023116 \tabularnewline
45 & -0.233388 & -1.9246 & 0.029235 \tabularnewline
46 & -0.22615 & -1.8649 & 0.033257 \tabularnewline
47 & -0.215682 & -1.7786 & 0.039891 \tabularnewline
48 & -0.196167 & -1.6176 & 0.055186 \tabularnewline
\hline
\end{tabular}
%Source: https://freestatistics.org/blog/index.php?pk=293857&T=1

[TABLE]
[ROW][C]Autocorrelation Function[/C][/ROW]
[ROW][C]Time lag k[/C][C]ACF(k)[/C][C]T-STAT[/C][C]P-value[/C][/ROW]
[ROW][C]1[/C][C]0.949462[/C][C]7.8295[/C][C]0[/C][/ROW]
[ROW][C]2[/C][C]0.865214[/C][C]7.1347[/C][C]0[/C][/ROW]
[ROW][C]3[/C][C]0.790519[/C][C]6.5188[/C][C]0[/C][/ROW]
[ROW][C]4[/C][C]0.728299[/C][C]6.0057[/C][C]0[/C][/ROW]
[ROW][C]5[/C][C]0.687002[/C][C]5.6652[/C][C]0[/C][/ROW]
[ROW][C]6[/C][C]0.642268[/C][C]5.2963[/C][C]1e-06[/C][/ROW]
[ROW][C]7[/C][C]0.5696[/C][C]4.697[/C][C]7e-06[/C][/ROW]
[ROW][C]8[/C][C]0.493123[/C][C]4.0664[/C][C]6.3e-05[/C][/ROW]
[ROW][C]9[/C][C]0.43173[/C][C]3.5601[/C][C]0.000341[/C][/ROW]
[ROW][C]10[/C][C]0.37716[/C][C]3.1101[/C][C]0.001366[/C][/ROW]
[ROW][C]11[/C][C]0.342075[/C][C]2.8208[/C][C]0.003136[/C][/ROW]
[ROW][C]12[/C][C]0.313931[/C][C]2.5887[/C][C]0.005885[/C][/ROW]
[ROW][C]13[/C][C]0.265166[/C][C]2.1866[/C][C]0.016108[/C][/ROW]
[ROW][C]14[/C][C]0.198502[/C][C]1.6369[/C][C]0.053137[/C][/ROW]
[ROW][C]15[/C][C]0.128248[/C][C]1.0576[/C][C]0.147[/C][/ROW]
[ROW][C]16[/C][C]0.07227[/C][C]0.596[/C][C]0.276591[/C][/ROW]
[ROW][C]17[/C][C]0.042199[/C][C]0.348[/C][C]0.364465[/C][/ROW]
[ROW][C]18[/C][C]0.022761[/C][C]0.1877[/C][C]0.425838[/C][/ROW]
[ROW][C]19[/C][C]-0.010815[/C][C]-0.0892[/C][C]0.464598[/C][/ROW]
[ROW][C]20[/C][C]-0.055952[/C][C]-0.4614[/C][C]0.322995[/C][/ROW]
[ROW][C]21[/C][C]-0.103608[/C][C]-0.8544[/C][C]0.197949[/C][/ROW]
[ROW][C]22[/C][C]-0.150656[/C][C]-1.2423[/C][C]0.109188[/C][/ROW]
[ROW][C]23[/C][C]-0.181374[/C][C]-1.4957[/C][C]0.069686[/C][/ROW]
[ROW][C]24[/C][C]-0.202694[/C][C]-1.6715[/C][C]0.049614[/C][/ROW]
[ROW][C]25[/C][C]-0.228545[/C][C]-1.8846[/C][C]0.031877[/C][/ROW]
[ROW][C]26[/C][C]-0.264843[/C][C]-2.1839[/C][C]0.016209[/C][/ROW]
[ROW][C]27[/C][C]-0.310576[/C][C]-2.5611[/C][C]0.006329[/C][/ROW]
[ROW][C]28[/C][C]-0.360951[/C][C]-2.9765[/C][C]0.002018[/C][/ROW]
[ROW][C]29[/C][C]-0.394146[/C][C]-3.2502[/C][C]0.000897[/C][/ROW]
[ROW][C]30[/C][C]-0.404531[/C][C]-3.3359[/C][C]0.00069[/C][/ROW]
[ROW][C]31[/C][C]-0.404858[/C][C]-3.3385[/C][C]0.000685[/C][/ROW]
[ROW][C]32[/C][C]-0.390625[/C][C]-3.2212[/C][C]0.00098[/C][/ROW]
[ROW][C]33[/C][C]-0.374785[/C][C]-3.0906[/C][C]0.001447[/C][/ROW]
[ROW][C]34[/C][C]-0.364202[/C][C]-3.0033[/C][C]0.001868[/C][/ROW]
[ROW][C]35[/C][C]-0.347592[/C][C]-2.8663[/C][C]0.002761[/C][/ROW]
[ROW][C]36[/C][C]-0.329271[/C][C]-2.7152[/C][C]0.004194[/C][/ROW]
[ROW][C]37[/C][C]-0.309357[/C][C]-2.551[/C][C]0.006498[/C][/ROW]
[ROW][C]38[/C][C]-0.284156[/C][C]-2.3432[/C][C]0.011025[/C][/ROW]
[ROW][C]39[/C][C]-0.268441[/C][C]-2.2136[/C][C]0.015106[/C][/ROW]
[ROW][C]40[/C][C]-0.272309[/C][C]-2.2455[/C][C]0.013995[/C][/ROW]
[ROW][C]41[/C][C]-0.274705[/C][C]-2.2653[/C][C]0.013343[/C][/ROW]
[ROW][C]42[/C][C]-0.271123[/C][C]-2.2357[/C][C]0.014328[/C][/ROW]
[ROW][C]43[/C][C]-0.2612[/C][C]-2.1539[/C][C]0.017397[/C][/ROW]
[ROW][C]44[/C][C]-0.246218[/C][C]-2.0304[/C][C]0.023116[/C][/ROW]
[ROW][C]45[/C][C]-0.233388[/C][C]-1.9246[/C][C]0.029235[/C][/ROW]
[ROW][C]46[/C][C]-0.22615[/C][C]-1.8649[/C][C]0.033257[/C][/ROW]
[ROW][C]47[/C][C]-0.215682[/C][C]-1.7786[/C][C]0.039891[/C][/ROW]
[ROW][C]48[/C][C]-0.196167[/C][C]-1.6176[/C][C]0.055186[/C][/ROW]
[/TABLE]
Source: https://freestatistics.org/blog/index.php?pk=293857&T=1

Globally Unique Identifier (entire table): ba.freestatistics.org/blog/index.php?pk=293857&T=1

As an alternative you can also use a QR Code:  

The GUIDs for individual cells are displayed in the table below:

Autocorrelation Function
Time lag kACF(k)T-STATP-value
10.9494627.82950
20.8652147.13470
30.7905196.51880
40.7282996.00570
50.6870025.66520
60.6422685.29631e-06
70.56964.6977e-06
80.4931234.06646.3e-05
90.431733.56010.000341
100.377163.11010.001366
110.3420752.82080.003136
120.3139312.58870.005885
130.2651662.18660.016108
140.1985021.63690.053137
150.1282481.05760.147
160.072270.5960.276591
170.0421990.3480.364465
180.0227610.18770.425838
19-0.010815-0.08920.464598
20-0.055952-0.46140.322995
21-0.103608-0.85440.197949
22-0.150656-1.24230.109188
23-0.181374-1.49570.069686
24-0.202694-1.67150.049614
25-0.228545-1.88460.031877
26-0.264843-2.18390.016209
27-0.310576-2.56110.006329
28-0.360951-2.97650.002018
29-0.394146-3.25020.000897
30-0.404531-3.33590.00069
31-0.404858-3.33850.000685
32-0.390625-3.22120.00098
33-0.374785-3.09060.001447
34-0.364202-3.00330.001868
35-0.347592-2.86630.002761
36-0.329271-2.71520.004194
37-0.309357-2.5510.006498
38-0.284156-2.34320.011025
39-0.268441-2.21360.015106
40-0.272309-2.24550.013995
41-0.274705-2.26530.013343
42-0.271123-2.23570.014328
43-0.2612-2.15390.017397
44-0.246218-2.03040.023116
45-0.233388-1.92460.029235
46-0.22615-1.86490.033257
47-0.215682-1.77860.039891
48-0.196167-1.61760.055186


Partial Autocorrelation Function
Time lag kPACF(k)T-STATP-value
10.9494627.82950
2-0.368076-3.03520.001702
30.1894511.56230.061436
4-0.026245-0.21640.414655
50.1797731.48240.07142
6-0.228951-1.8880.031648
7-0.202938-1.67350.049415
80.1096790.90440.184478
90.0559750.46160.322926
10-0.114643-0.94540.173908
110.1545441.27440.103429
12-0.052827-0.43560.332244
13-0.152855-1.26050.105903
14-0.167947-1.38490.085301
150.0013450.01110.495592
160.144131.18850.11938
17-0.00765-0.06310.474943
18-0.084504-0.69680.244139
19-0.045487-0.37510.354379
200.0271590.2240.411732
21-0.07559-0.62330.267576
22-0.157221-1.29650.099597
230.0884390.72930.234164
24-0.023409-0.1930.423753
25-0.056913-0.46930.320172
26-0.149724-1.23470.110605
270.0215570.17780.42972
28-0.070503-0.58140.281452
290.0038590.03180.487354
30-0.014735-0.12150.451825
310.1216831.00340.159607
320.2184761.80160.038021
33-0.088831-0.73250.233184
34-0.0519-0.4280.33501
350.0418720.34530.365472
36-0.080522-0.6640.254467
37-0.015191-0.12530.450341
38-0.03871-0.31920.375271
39-0.004117-0.0340.486508
40-0.080087-0.66040.255609
410.0082440.0680.472999
42-0.04463-0.3680.356999
430.0059890.04940.480377
44-0.155009-1.27820.102756
450.112030.92380.179422
46-0.002823-0.02330.490749
470.0745710.61490.270327
480.0344160.28380.388713

\begin{tabular}{lllllllll}
\hline
Partial Autocorrelation Function \tabularnewline
Time lag k & PACF(k) & T-STAT & P-value \tabularnewline
1 & 0.949462 & 7.8295 & 0 \tabularnewline
2 & -0.368076 & -3.0352 & 0.001702 \tabularnewline
3 & 0.189451 & 1.5623 & 0.061436 \tabularnewline
4 & -0.026245 & -0.2164 & 0.414655 \tabularnewline
5 & 0.179773 & 1.4824 & 0.07142 \tabularnewline
6 & -0.228951 & -1.888 & 0.031648 \tabularnewline
7 & -0.202938 & -1.6735 & 0.049415 \tabularnewline
8 & 0.109679 & 0.9044 & 0.184478 \tabularnewline
9 & 0.055975 & 0.4616 & 0.322926 \tabularnewline
10 & -0.114643 & -0.9454 & 0.173908 \tabularnewline
11 & 0.154544 & 1.2744 & 0.103429 \tabularnewline
12 & -0.052827 & -0.4356 & 0.332244 \tabularnewline
13 & -0.152855 & -1.2605 & 0.105903 \tabularnewline
14 & -0.167947 & -1.3849 & 0.085301 \tabularnewline
15 & 0.001345 & 0.0111 & 0.495592 \tabularnewline
16 & 0.14413 & 1.1885 & 0.11938 \tabularnewline
17 & -0.00765 & -0.0631 & 0.474943 \tabularnewline
18 & -0.084504 & -0.6968 & 0.244139 \tabularnewline
19 & -0.045487 & -0.3751 & 0.354379 \tabularnewline
20 & 0.027159 & 0.224 & 0.411732 \tabularnewline
21 & -0.07559 & -0.6233 & 0.267576 \tabularnewline
22 & -0.157221 & -1.2965 & 0.099597 \tabularnewline
23 & 0.088439 & 0.7293 & 0.234164 \tabularnewline
24 & -0.023409 & -0.193 & 0.423753 \tabularnewline
25 & -0.056913 & -0.4693 & 0.320172 \tabularnewline
26 & -0.149724 & -1.2347 & 0.110605 \tabularnewline
27 & 0.021557 & 0.1778 & 0.42972 \tabularnewline
28 & -0.070503 & -0.5814 & 0.281452 \tabularnewline
29 & 0.003859 & 0.0318 & 0.487354 \tabularnewline
30 & -0.014735 & -0.1215 & 0.451825 \tabularnewline
31 & 0.121683 & 1.0034 & 0.159607 \tabularnewline
32 & 0.218476 & 1.8016 & 0.038021 \tabularnewline
33 & -0.088831 & -0.7325 & 0.233184 \tabularnewline
34 & -0.0519 & -0.428 & 0.33501 \tabularnewline
35 & 0.041872 & 0.3453 & 0.365472 \tabularnewline
36 & -0.080522 & -0.664 & 0.254467 \tabularnewline
37 & -0.015191 & -0.1253 & 0.450341 \tabularnewline
38 & -0.03871 & -0.3192 & 0.375271 \tabularnewline
39 & -0.004117 & -0.034 & 0.486508 \tabularnewline
40 & -0.080087 & -0.6604 & 0.255609 \tabularnewline
41 & 0.008244 & 0.068 & 0.472999 \tabularnewline
42 & -0.04463 & -0.368 & 0.356999 \tabularnewline
43 & 0.005989 & 0.0494 & 0.480377 \tabularnewline
44 & -0.155009 & -1.2782 & 0.102756 \tabularnewline
45 & 0.11203 & 0.9238 & 0.179422 \tabularnewline
46 & -0.002823 & -0.0233 & 0.490749 \tabularnewline
47 & 0.074571 & 0.6149 & 0.270327 \tabularnewline
48 & 0.034416 & 0.2838 & 0.388713 \tabularnewline
\hline
\end{tabular}
%Source: https://freestatistics.org/blog/index.php?pk=293857&T=2

[TABLE]
[ROW][C]Partial Autocorrelation Function[/C][/ROW]
[ROW][C]Time lag k[/C][C]PACF(k)[/C][C]T-STAT[/C][C]P-value[/C][/ROW]
[ROW][C]1[/C][C]0.949462[/C][C]7.8295[/C][C]0[/C][/ROW]
[ROW][C]2[/C][C]-0.368076[/C][C]-3.0352[/C][C]0.001702[/C][/ROW]
[ROW][C]3[/C][C]0.189451[/C][C]1.5623[/C][C]0.061436[/C][/ROW]
[ROW][C]4[/C][C]-0.026245[/C][C]-0.2164[/C][C]0.414655[/C][/ROW]
[ROW][C]5[/C][C]0.179773[/C][C]1.4824[/C][C]0.07142[/C][/ROW]
[ROW][C]6[/C][C]-0.228951[/C][C]-1.888[/C][C]0.031648[/C][/ROW]
[ROW][C]7[/C][C]-0.202938[/C][C]-1.6735[/C][C]0.049415[/C][/ROW]
[ROW][C]8[/C][C]0.109679[/C][C]0.9044[/C][C]0.184478[/C][/ROW]
[ROW][C]9[/C][C]0.055975[/C][C]0.4616[/C][C]0.322926[/C][/ROW]
[ROW][C]10[/C][C]-0.114643[/C][C]-0.9454[/C][C]0.173908[/C][/ROW]
[ROW][C]11[/C][C]0.154544[/C][C]1.2744[/C][C]0.103429[/C][/ROW]
[ROW][C]12[/C][C]-0.052827[/C][C]-0.4356[/C][C]0.332244[/C][/ROW]
[ROW][C]13[/C][C]-0.152855[/C][C]-1.2605[/C][C]0.105903[/C][/ROW]
[ROW][C]14[/C][C]-0.167947[/C][C]-1.3849[/C][C]0.085301[/C][/ROW]
[ROW][C]15[/C][C]0.001345[/C][C]0.0111[/C][C]0.495592[/C][/ROW]
[ROW][C]16[/C][C]0.14413[/C][C]1.1885[/C][C]0.11938[/C][/ROW]
[ROW][C]17[/C][C]-0.00765[/C][C]-0.0631[/C][C]0.474943[/C][/ROW]
[ROW][C]18[/C][C]-0.084504[/C][C]-0.6968[/C][C]0.244139[/C][/ROW]
[ROW][C]19[/C][C]-0.045487[/C][C]-0.3751[/C][C]0.354379[/C][/ROW]
[ROW][C]20[/C][C]0.027159[/C][C]0.224[/C][C]0.411732[/C][/ROW]
[ROW][C]21[/C][C]-0.07559[/C][C]-0.6233[/C][C]0.267576[/C][/ROW]
[ROW][C]22[/C][C]-0.157221[/C][C]-1.2965[/C][C]0.099597[/C][/ROW]
[ROW][C]23[/C][C]0.088439[/C][C]0.7293[/C][C]0.234164[/C][/ROW]
[ROW][C]24[/C][C]-0.023409[/C][C]-0.193[/C][C]0.423753[/C][/ROW]
[ROW][C]25[/C][C]-0.056913[/C][C]-0.4693[/C][C]0.320172[/C][/ROW]
[ROW][C]26[/C][C]-0.149724[/C][C]-1.2347[/C][C]0.110605[/C][/ROW]
[ROW][C]27[/C][C]0.021557[/C][C]0.1778[/C][C]0.42972[/C][/ROW]
[ROW][C]28[/C][C]-0.070503[/C][C]-0.5814[/C][C]0.281452[/C][/ROW]
[ROW][C]29[/C][C]0.003859[/C][C]0.0318[/C][C]0.487354[/C][/ROW]
[ROW][C]30[/C][C]-0.014735[/C][C]-0.1215[/C][C]0.451825[/C][/ROW]
[ROW][C]31[/C][C]0.121683[/C][C]1.0034[/C][C]0.159607[/C][/ROW]
[ROW][C]32[/C][C]0.218476[/C][C]1.8016[/C][C]0.038021[/C][/ROW]
[ROW][C]33[/C][C]-0.088831[/C][C]-0.7325[/C][C]0.233184[/C][/ROW]
[ROW][C]34[/C][C]-0.0519[/C][C]-0.428[/C][C]0.33501[/C][/ROW]
[ROW][C]35[/C][C]0.041872[/C][C]0.3453[/C][C]0.365472[/C][/ROW]
[ROW][C]36[/C][C]-0.080522[/C][C]-0.664[/C][C]0.254467[/C][/ROW]
[ROW][C]37[/C][C]-0.015191[/C][C]-0.1253[/C][C]0.450341[/C][/ROW]
[ROW][C]38[/C][C]-0.03871[/C][C]-0.3192[/C][C]0.375271[/C][/ROW]
[ROW][C]39[/C][C]-0.004117[/C][C]-0.034[/C][C]0.486508[/C][/ROW]
[ROW][C]40[/C][C]-0.080087[/C][C]-0.6604[/C][C]0.255609[/C][/ROW]
[ROW][C]41[/C][C]0.008244[/C][C]0.068[/C][C]0.472999[/C][/ROW]
[ROW][C]42[/C][C]-0.04463[/C][C]-0.368[/C][C]0.356999[/C][/ROW]
[ROW][C]43[/C][C]0.005989[/C][C]0.0494[/C][C]0.480377[/C][/ROW]
[ROW][C]44[/C][C]-0.155009[/C][C]-1.2782[/C][C]0.102756[/C][/ROW]
[ROW][C]45[/C][C]0.11203[/C][C]0.9238[/C][C]0.179422[/C][/ROW]
[ROW][C]46[/C][C]-0.002823[/C][C]-0.0233[/C][C]0.490749[/C][/ROW]
[ROW][C]47[/C][C]0.074571[/C][C]0.6149[/C][C]0.270327[/C][/ROW]
[ROW][C]48[/C][C]0.034416[/C][C]0.2838[/C][C]0.388713[/C][/ROW]
[/TABLE]
Source: https://freestatistics.org/blog/index.php?pk=293857&T=2

Globally Unique Identifier (entire table): ba.freestatistics.org/blog/index.php?pk=293857&T=2

As an alternative you can also use a QR Code:  

The GUIDs for individual cells are displayed in the table below:

Partial Autocorrelation Function
Time lag kPACF(k)T-STATP-value
10.9494627.82950
2-0.368076-3.03520.001702
30.1894511.56230.061436
4-0.026245-0.21640.414655
50.1797731.48240.07142
6-0.228951-1.8880.031648
7-0.202938-1.67350.049415
80.1096790.90440.184478
90.0559750.46160.322926
10-0.114643-0.94540.173908
110.1545441.27440.103429
12-0.052827-0.43560.332244
13-0.152855-1.26050.105903
14-0.167947-1.38490.085301
150.0013450.01110.495592
160.144131.18850.11938
17-0.00765-0.06310.474943
18-0.084504-0.69680.244139
19-0.045487-0.37510.354379
200.0271590.2240.411732
21-0.07559-0.62330.267576
22-0.157221-1.29650.099597
230.0884390.72930.234164
24-0.023409-0.1930.423753
25-0.056913-0.46930.320172
26-0.149724-1.23470.110605
270.0215570.17780.42972
28-0.070503-0.58140.281452
290.0038590.03180.487354
30-0.014735-0.12150.451825
310.1216831.00340.159607
320.2184761.80160.038021
33-0.088831-0.73250.233184
34-0.0519-0.4280.33501
350.0418720.34530.365472
36-0.080522-0.6640.254467
37-0.015191-0.12530.450341
38-0.03871-0.31920.375271
39-0.004117-0.0340.486508
40-0.080087-0.66040.255609
410.0082440.0680.472999
42-0.04463-0.3680.356999
430.0059890.04940.480377
44-0.155009-1.27820.102756
450.112030.92380.179422
46-0.002823-0.02330.490749
470.0745710.61490.270327
480.0344160.28380.388713


Parameters (Session):
par1 = 48 ; par2 = 1 ; par3 = 0 ; par4 = 0 ; par5 = 12 ; par6 = White Noise ; par7 = 0.95 ;
Parameters (R input):
par1 = 48 ; par2 = 1 ; par3 = 0 ; par4 = 0 ; par5 = 12 ; par6 = White Noise ; par7 = 0.95 ; par8 = ;
R code (references can be found in the software module):
if (par1 == 'Default') {
par1 = 10*log10(length(x))
} else {
par1 <- as.numeric(par1)
}
par2 <- as.numeric(par2)
par3 <- as.numeric(par3)
par4 <- as.numeric(par4)
par5 <- as.numeric(par5)
if (par6 == 'White Noise') par6 <- 'white' else par6 <- 'ma'
par7 <- as.numeric(par7)
if (par8 != '') par8 <- as.numeric(par8)
x <- na.omit(x)
ox <- x
if (par8 == '') {
if (par2 == 0) {
x <- log(x)
} else {
x <- (x ^ par2 - 1) / par2
}
} else {
x <- log(x,base=par8)
}
if (par3 > 0) x <- diff(x,lag=1,difference=par3)
if (par4 > 0) x <- diff(x,lag=par5,difference=par4)
bitmap(file='picts.png')
op <- par(mfrow=c(2,1))
plot(ox,type='l',main='Original Time Series',xlab='time',ylab='value')
if (par8=='') {
mytitle <- paste('Working Time Series (lambda=',par2,', d=',par3,', D=',par4,')',sep='')
mysub <- paste('(lambda=',par2,', d=',par3,', D=',par4,', CI=', par7, ', CI type=',par6,')',sep='')
} else {
mytitle <- paste('Working Time Series (base=',par8,', d=',par3,', D=',par4,')',sep='')
mysub <- paste('(base=',par8,', d=',par3,', D=',par4,', CI=', par7, ', CI type=',par6,')',sep='')
}
plot(x,type='l', main=mytitle,xlab='time',ylab='value')
par(op)
dev.off()
bitmap(file='pic1.png')
racf <- acf(x, par1, main='Autocorrelation', xlab='time lag', ylab='ACF', ci.type=par6, ci=par7, sub=mysub)
dev.off()
bitmap(file='pic2.png')
rpacf <- pacf(x,par1,main='Partial Autocorrelation',xlab='lags',ylab='PACF',sub=mysub)
dev.off()
(myacf <- c(racf$acf))
(mypacf <- c(rpacf$acf))
lengthx <- length(x)
sqrtn <- sqrt(lengthx)
load(file='createtable')
a<-table.start()
a<-table.row.start(a)
a<-table.element(a,'Autocorrelation Function',4,TRUE)
a<-table.row.end(a)
a<-table.row.start(a)
a<-table.element(a,'Time lag k',header=TRUE)
a<-table.element(a,hyperlink('basics.htm','ACF(k)','click here for more information about the Autocorrelation Function'),header=TRUE)
a<-table.element(a,'T-STAT',header=TRUE)
a<-table.element(a,'P-value',header=TRUE)
a<-table.row.end(a)
for (i in 2:(par1+1)) {
a<-table.row.start(a)
a<-table.element(a,i-1,header=TRUE)
a<-table.element(a,round(myacf[i],6))
mytstat <- myacf[i]*sqrtn
a<-table.element(a,round(mytstat,4))
a<-table.element(a,round(1-pt(abs(mytstat),lengthx),6))
a<-table.row.end(a)
}
a<-table.end(a)
table.save(a,file='mytable.tab')
a<-table.start()
a<-table.row.start(a)
a<-table.element(a,'Partial Autocorrelation Function',4,TRUE)
a<-table.row.end(a)
a<-table.row.start(a)
a<-table.element(a,'Time lag k',header=TRUE)
a<-table.element(a,hyperlink('basics.htm','PACF(k)','click here for more information about the Partial Autocorrelation Function'),header=TRUE)
a<-table.element(a,'T-STAT',header=TRUE)
a<-table.element(a,'P-value',header=TRUE)
a<-table.row.end(a)
for (i in 1:par1) {
a<-table.row.start(a)
a<-table.element(a,i,header=TRUE)
a<-table.element(a,round(mypacf[i],6))
mytstat <- mypacf[i]*sqrtn
a<-table.element(a,round(mytstat,4))
a<-table.element(a,round(1-pt(abs(mytstat),lengthx),6))
a<-table.row.end(a)
}
a<-table.end(a)
table.save(a,file='mytable1.tab')