Free Statistics

of Irreproducible Research!

Author's title

Author*Unverified author*
R Software Modulerwasp_autocorrelation.wasp
Title produced by software(Partial) Autocorrelation Function
Date of computationFri, 11 Mar 2016 13:37:59 +0000
Cite this page as followsStatistical Computations at FreeStatistics.org, Office for Research Development and Education, URL https://freestatistics.org/blog/index.php?v=date/2016/Mar/11/t14577035211bf2csiiioxdew2.htm/, Retrieved Sat, 18 May 2024 15:32:57 +0000
Statistical Computations at FreeStatistics.org, Office for Research Development and Education, URL https://freestatistics.org/blog/index.php?pk=293854, Retrieved Sat, 18 May 2024 15:32:57 +0000
QR Codes:

Original text written by user:
IsPrivate?No (this computation is public)
User-defined keywords
Estimated Impact165
Family? (F = Feedback message, R = changed R code, M = changed R Module, P = changed Parameters, D = changed Data)
-       [(Partial) Autocorrelation Function] [] [2016-03-11 13:37:59] [e5ae4b5dd737e4828f1ae85ef60fb5e4] [Current]
Feedback Forum

Post a new message
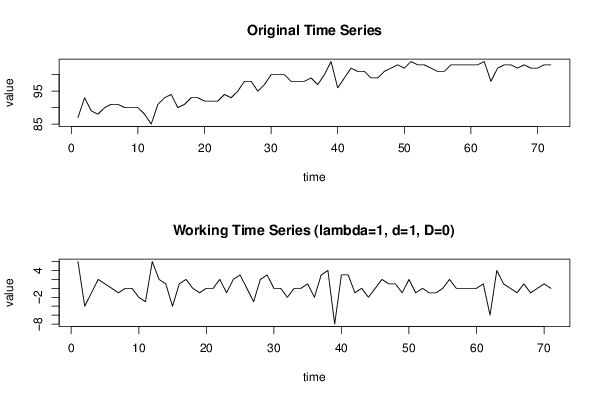
Dataseries X:
87
93
89
88
90
91
91
90
90
90
88
85
91
93
94
90
91
93
93
92
92
92
94
93
95
98
98
95
97
100
100
100
98
98
98
99
97
100
104
96
99
102
101
101
99
99
101
102
103
102
104
103
103
102
101
101
103
103
103
103
103
104
98
102
103
103
102
103
102
102
103
103


Summary of computational transaction
Raw Inputview raw input (R code)
Raw Outputview raw output of R engine
Computing time1 seconds
R Server'Sir Ronald Aylmer Fisher' @ fisher.wessa.net

\begin{tabular}{lllllllll}
\hline
Summary of computational transaction \tabularnewline
Raw Input & view raw input (R code)  \tabularnewline
Raw Output & view raw output of R engine  \tabularnewline
Computing time & 1 seconds \tabularnewline
R Server & 'Sir Ronald Aylmer Fisher' @ fisher.wessa.net \tabularnewline
\hline
\end{tabular}
%Source: https://freestatistics.org/blog/index.php?pk=293854&T=0

[TABLE]
[ROW][C]Summary of computational transaction[/C][/ROW]
[ROW][C]Raw Input[/C][C]view raw input (R code) [/C][/ROW]
[ROW][C]Raw Output[/C][C]view raw output of R engine [/C][/ROW]
[ROW][C]Computing time[/C][C]1 seconds[/C][/ROW]
[ROW][C]R Server[/C][C]'Sir Ronald Aylmer Fisher' @ fisher.wessa.net[/C][/ROW]
[/TABLE]
Source: https://freestatistics.org/blog/index.php?pk=293854&T=0

Globally Unique Identifier (entire table): ba.freestatistics.org/blog/index.php?pk=293854&T=0

As an alternative you can also use a QR Code:  

The GUIDs for individual cells are displayed in the table below:

Summary of computational transaction
Raw Inputview raw input (R code)
Raw Outputview raw output of R engine
Computing time1 seconds
R Server'Sir Ronald Aylmer Fisher' @ fisher.wessa.net


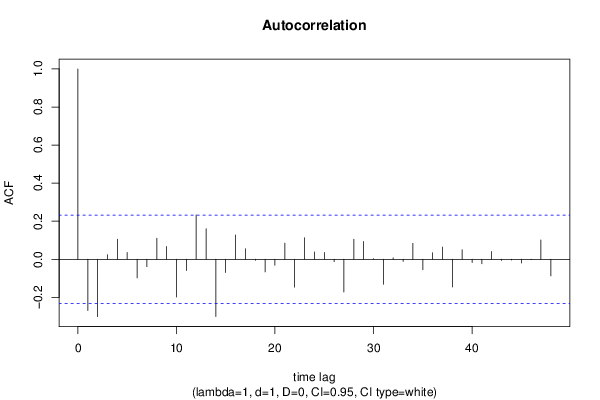
Autocorrelation Function
Time lag kACF(k)T-STATP-value
1-0.26956-2.27140.01308
2-0.301392-2.53960.006645
30.0235960.19880.421484
40.1055050.8890.188503
50.0360140.30350.381215
6-0.097746-0.82360.206457
7-0.038777-0.32670.372414
80.1109940.93530.176415
90.0671570.56590.286632
10-0.198465-1.67230.049434
11-0.058673-0.49440.311278
120.2325941.95990.026968
130.1603891.35150.090419
14-0.300599-2.53290.006762
15-0.069739-0.58760.279323
160.1274011.07350.14334
170.0551960.46510.321646
18-0.005272-0.04440.482345
19-0.066352-0.55910.288929
20-0.031202-0.26290.39669
210.0847710.71430.238693
22-0.146365-1.23330.110767
230.1128640.9510.172413
240.0385560.32490.373115
250.0354360.29860.383063
26-0.012339-0.1040.458742
27-0.171752-1.44720.07612
280.1049870.88460.189669
290.0931120.78460.217656
300.0027840.02350.490674
31-0.131242-1.10590.136258
320.007670.06460.474325
33-0.010934-0.09210.463427
340.0836680.7050.24156
35-0.055177-0.46490.321704
360.0345310.2910.385963
370.0639850.53910.295736
38-0.145436-1.22550.112225
390.0504050.42470.336164
40-0.016984-0.14310.443305
41-0.02343-0.19740.42203
420.0409680.34520.365481
43-0.006195-0.05220.479257
44-0.003619-0.03050.487881
45-0.019164-0.16150.436088
46-0.001792-0.01510.493999
470.1009530.85060.198912
48-0.087363-0.73610.232037

\begin{tabular}{lllllllll}
\hline
Autocorrelation Function \tabularnewline
Time lag k & ACF(k) & T-STAT & P-value \tabularnewline
1 & -0.26956 & -2.2714 & 0.01308 \tabularnewline
2 & -0.301392 & -2.5396 & 0.006645 \tabularnewline
3 & 0.023596 & 0.1988 & 0.421484 \tabularnewline
4 & 0.105505 & 0.889 & 0.188503 \tabularnewline
5 & 0.036014 & 0.3035 & 0.381215 \tabularnewline
6 & -0.097746 & -0.8236 & 0.206457 \tabularnewline
7 & -0.038777 & -0.3267 & 0.372414 \tabularnewline
8 & 0.110994 & 0.9353 & 0.176415 \tabularnewline
9 & 0.067157 & 0.5659 & 0.286632 \tabularnewline
10 & -0.198465 & -1.6723 & 0.049434 \tabularnewline
11 & -0.058673 & -0.4944 & 0.311278 \tabularnewline
12 & 0.232594 & 1.9599 & 0.026968 \tabularnewline
13 & 0.160389 & 1.3515 & 0.090419 \tabularnewline
14 & -0.300599 & -2.5329 & 0.006762 \tabularnewline
15 & -0.069739 & -0.5876 & 0.279323 \tabularnewline
16 & 0.127401 & 1.0735 & 0.14334 \tabularnewline
17 & 0.055196 & 0.4651 & 0.321646 \tabularnewline
18 & -0.005272 & -0.0444 & 0.482345 \tabularnewline
19 & -0.066352 & -0.5591 & 0.288929 \tabularnewline
20 & -0.031202 & -0.2629 & 0.39669 \tabularnewline
21 & 0.084771 & 0.7143 & 0.238693 \tabularnewline
22 & -0.146365 & -1.2333 & 0.110767 \tabularnewline
23 & 0.112864 & 0.951 & 0.172413 \tabularnewline
24 & 0.038556 & 0.3249 & 0.373115 \tabularnewline
25 & 0.035436 & 0.2986 & 0.383063 \tabularnewline
26 & -0.012339 & -0.104 & 0.458742 \tabularnewline
27 & -0.171752 & -1.4472 & 0.07612 \tabularnewline
28 & 0.104987 & 0.8846 & 0.189669 \tabularnewline
29 & 0.093112 & 0.7846 & 0.217656 \tabularnewline
30 & 0.002784 & 0.0235 & 0.490674 \tabularnewline
31 & -0.131242 & -1.1059 & 0.136258 \tabularnewline
32 & 0.00767 & 0.0646 & 0.474325 \tabularnewline
33 & -0.010934 & -0.0921 & 0.463427 \tabularnewline
34 & 0.083668 & 0.705 & 0.24156 \tabularnewline
35 & -0.055177 & -0.4649 & 0.321704 \tabularnewline
36 & 0.034531 & 0.291 & 0.385963 \tabularnewline
37 & 0.063985 & 0.5391 & 0.295736 \tabularnewline
38 & -0.145436 & -1.2255 & 0.112225 \tabularnewline
39 & 0.050405 & 0.4247 & 0.336164 \tabularnewline
40 & -0.016984 & -0.1431 & 0.443305 \tabularnewline
41 & -0.02343 & -0.1974 & 0.42203 \tabularnewline
42 & 0.040968 & 0.3452 & 0.365481 \tabularnewline
43 & -0.006195 & -0.0522 & 0.479257 \tabularnewline
44 & -0.003619 & -0.0305 & 0.487881 \tabularnewline
45 & -0.019164 & -0.1615 & 0.436088 \tabularnewline
46 & -0.001792 & -0.0151 & 0.493999 \tabularnewline
47 & 0.100953 & 0.8506 & 0.198912 \tabularnewline
48 & -0.087363 & -0.7361 & 0.232037 \tabularnewline
\hline
\end{tabular}
%Source: https://freestatistics.org/blog/index.php?pk=293854&T=1

[TABLE]
[ROW][C]Autocorrelation Function[/C][/ROW]
[ROW][C]Time lag k[/C][C]ACF(k)[/C][C]T-STAT[/C][C]P-value[/C][/ROW]
[ROW][C]1[/C][C]-0.26956[/C][C]-2.2714[/C][C]0.01308[/C][/ROW]
[ROW][C]2[/C][C]-0.301392[/C][C]-2.5396[/C][C]0.006645[/C][/ROW]
[ROW][C]3[/C][C]0.023596[/C][C]0.1988[/C][C]0.421484[/C][/ROW]
[ROW][C]4[/C][C]0.105505[/C][C]0.889[/C][C]0.188503[/C][/ROW]
[ROW][C]5[/C][C]0.036014[/C][C]0.3035[/C][C]0.381215[/C][/ROW]
[ROW][C]6[/C][C]-0.097746[/C][C]-0.8236[/C][C]0.206457[/C][/ROW]
[ROW][C]7[/C][C]-0.038777[/C][C]-0.3267[/C][C]0.372414[/C][/ROW]
[ROW][C]8[/C][C]0.110994[/C][C]0.9353[/C][C]0.176415[/C][/ROW]
[ROW][C]9[/C][C]0.067157[/C][C]0.5659[/C][C]0.286632[/C][/ROW]
[ROW][C]10[/C][C]-0.198465[/C][C]-1.6723[/C][C]0.049434[/C][/ROW]
[ROW][C]11[/C][C]-0.058673[/C][C]-0.4944[/C][C]0.311278[/C][/ROW]
[ROW][C]12[/C][C]0.232594[/C][C]1.9599[/C][C]0.026968[/C][/ROW]
[ROW][C]13[/C][C]0.160389[/C][C]1.3515[/C][C]0.090419[/C][/ROW]
[ROW][C]14[/C][C]-0.300599[/C][C]-2.5329[/C][C]0.006762[/C][/ROW]
[ROW][C]15[/C][C]-0.069739[/C][C]-0.5876[/C][C]0.279323[/C][/ROW]
[ROW][C]16[/C][C]0.127401[/C][C]1.0735[/C][C]0.14334[/C][/ROW]
[ROW][C]17[/C][C]0.055196[/C][C]0.4651[/C][C]0.321646[/C][/ROW]
[ROW][C]18[/C][C]-0.005272[/C][C]-0.0444[/C][C]0.482345[/C][/ROW]
[ROW][C]19[/C][C]-0.066352[/C][C]-0.5591[/C][C]0.288929[/C][/ROW]
[ROW][C]20[/C][C]-0.031202[/C][C]-0.2629[/C][C]0.39669[/C][/ROW]
[ROW][C]21[/C][C]0.084771[/C][C]0.7143[/C][C]0.238693[/C][/ROW]
[ROW][C]22[/C][C]-0.146365[/C][C]-1.2333[/C][C]0.110767[/C][/ROW]
[ROW][C]23[/C][C]0.112864[/C][C]0.951[/C][C]0.172413[/C][/ROW]
[ROW][C]24[/C][C]0.038556[/C][C]0.3249[/C][C]0.373115[/C][/ROW]
[ROW][C]25[/C][C]0.035436[/C][C]0.2986[/C][C]0.383063[/C][/ROW]
[ROW][C]26[/C][C]-0.012339[/C][C]-0.104[/C][C]0.458742[/C][/ROW]
[ROW][C]27[/C][C]-0.171752[/C][C]-1.4472[/C][C]0.07612[/C][/ROW]
[ROW][C]28[/C][C]0.104987[/C][C]0.8846[/C][C]0.189669[/C][/ROW]
[ROW][C]29[/C][C]0.093112[/C][C]0.7846[/C][C]0.217656[/C][/ROW]
[ROW][C]30[/C][C]0.002784[/C][C]0.0235[/C][C]0.490674[/C][/ROW]
[ROW][C]31[/C][C]-0.131242[/C][C]-1.1059[/C][C]0.136258[/C][/ROW]
[ROW][C]32[/C][C]0.00767[/C][C]0.0646[/C][C]0.474325[/C][/ROW]
[ROW][C]33[/C][C]-0.010934[/C][C]-0.0921[/C][C]0.463427[/C][/ROW]
[ROW][C]34[/C][C]0.083668[/C][C]0.705[/C][C]0.24156[/C][/ROW]
[ROW][C]35[/C][C]-0.055177[/C][C]-0.4649[/C][C]0.321704[/C][/ROW]
[ROW][C]36[/C][C]0.034531[/C][C]0.291[/C][C]0.385963[/C][/ROW]
[ROW][C]37[/C][C]0.063985[/C][C]0.5391[/C][C]0.295736[/C][/ROW]
[ROW][C]38[/C][C]-0.145436[/C][C]-1.2255[/C][C]0.112225[/C][/ROW]
[ROW][C]39[/C][C]0.050405[/C][C]0.4247[/C][C]0.336164[/C][/ROW]
[ROW][C]40[/C][C]-0.016984[/C][C]-0.1431[/C][C]0.443305[/C][/ROW]
[ROW][C]41[/C][C]-0.02343[/C][C]-0.1974[/C][C]0.42203[/C][/ROW]
[ROW][C]42[/C][C]0.040968[/C][C]0.3452[/C][C]0.365481[/C][/ROW]
[ROW][C]43[/C][C]-0.006195[/C][C]-0.0522[/C][C]0.479257[/C][/ROW]
[ROW][C]44[/C][C]-0.003619[/C][C]-0.0305[/C][C]0.487881[/C][/ROW]
[ROW][C]45[/C][C]-0.019164[/C][C]-0.1615[/C][C]0.436088[/C][/ROW]
[ROW][C]46[/C][C]-0.001792[/C][C]-0.0151[/C][C]0.493999[/C][/ROW]
[ROW][C]47[/C][C]0.100953[/C][C]0.8506[/C][C]0.198912[/C][/ROW]
[ROW][C]48[/C][C]-0.087363[/C][C]-0.7361[/C][C]0.232037[/C][/ROW]
[/TABLE]
Source: https://freestatistics.org/blog/index.php?pk=293854&T=1

Globally Unique Identifier (entire table): ba.freestatistics.org/blog/index.php?pk=293854&T=1

As an alternative you can also use a QR Code:  

The GUIDs for individual cells are displayed in the table below:

Autocorrelation Function
Time lag kACF(k)T-STATP-value
1-0.26956-2.27140.01308
2-0.301392-2.53960.006645
30.0235960.19880.421484
40.1055050.8890.188503
50.0360140.30350.381215
6-0.097746-0.82360.206457
7-0.038777-0.32670.372414
80.1109940.93530.176415
90.0671570.56590.286632
10-0.198465-1.67230.049434
11-0.058673-0.49440.311278
120.2325941.95990.026968
130.1603891.35150.090419
14-0.300599-2.53290.006762
15-0.069739-0.58760.279323
160.1274011.07350.14334
170.0551960.46510.321646
18-0.005272-0.04440.482345
19-0.066352-0.55910.288929
20-0.031202-0.26290.39669
210.0847710.71430.238693
22-0.146365-1.23330.110767
230.1128640.9510.172413
240.0385560.32490.373115
250.0354360.29860.383063
26-0.012339-0.1040.458742
27-0.171752-1.44720.07612
280.1049870.88460.189669
290.0931120.78460.217656
300.0027840.02350.490674
31-0.131242-1.10590.136258
320.007670.06460.474325
33-0.010934-0.09210.463427
340.0836680.7050.24156
35-0.055177-0.46490.321704
360.0345310.2910.385963
370.0639850.53910.295736
38-0.145436-1.22550.112225
390.0504050.42470.336164
40-0.016984-0.14310.443305
41-0.02343-0.19740.42203
420.0409680.34520.365481
43-0.006195-0.05220.479257
44-0.003619-0.03050.487881
45-0.019164-0.16150.436088
46-0.001792-0.01510.493999
470.1009530.85060.198912
48-0.087363-0.73610.232037


Partial Autocorrelation Function
Time lag kPACF(k)T-STATP-value
1-0.26956-2.27140.01308
2-0.403364-3.39880.000557
3-0.256483-2.16120.017028
4-0.142103-1.19740.117569
5-0.045122-0.38020.352465
6-0.099781-0.84080.201649
7-0.112618-0.94890.172937
8-0.002042-0.01720.493162
90.0855260.72070.236745
10-0.114948-0.96860.168024
11-0.163921-1.38120.085771
120.0428710.36120.359497
130.2607612.19720.015635
14-0.011106-0.09360.462851
15-0.031406-0.26460.396031
16-0.044649-0.37620.353939
17-0.037448-0.31550.376637
180.0542060.45670.324624
190.0628190.52930.299115
20-0.063407-0.53430.29741
21-0.053507-0.45090.326732
22-0.215261-1.81380.036965
230.1136290.95750.170792
240.012340.1040.458741
250.0288650.24320.404269
260.0890040.750.227877
27-0.027268-0.22980.409469
280.0677330.57070.284993
290.0923920.77850.219428
300.1279461.07810.14232
31-0.035178-0.29640.383888
32-0.036902-0.31090.378379
33-0.079198-0.66730.25336
340.0574520.48410.314902
35-0.03921-0.33040.371038
36-0.056342-0.47470.318212
370.0406560.34260.366466
38-0.159499-1.3440.09162
390.0425250.35830.360582
400.0154620.13030.448356
41-0.199089-1.67760.048916
42-0.185864-1.56610.060884
43-0.068382-0.57620.283153
440.0728710.6140.270581
450.0793450.66860.252968
46-0.066589-0.56110.288251
470.0635870.53580.296887
48-0.044892-0.37830.353181

\begin{tabular}{lllllllll}
\hline
Partial Autocorrelation Function \tabularnewline
Time lag k & PACF(k) & T-STAT & P-value \tabularnewline
1 & -0.26956 & -2.2714 & 0.01308 \tabularnewline
2 & -0.403364 & -3.3988 & 0.000557 \tabularnewline
3 & -0.256483 & -2.1612 & 0.017028 \tabularnewline
4 & -0.142103 & -1.1974 & 0.117569 \tabularnewline
5 & -0.045122 & -0.3802 & 0.352465 \tabularnewline
6 & -0.099781 & -0.8408 & 0.201649 \tabularnewline
7 & -0.112618 & -0.9489 & 0.172937 \tabularnewline
8 & -0.002042 & -0.0172 & 0.493162 \tabularnewline
9 & 0.085526 & 0.7207 & 0.236745 \tabularnewline
10 & -0.114948 & -0.9686 & 0.168024 \tabularnewline
11 & -0.163921 & -1.3812 & 0.085771 \tabularnewline
12 & 0.042871 & 0.3612 & 0.359497 \tabularnewline
13 & 0.260761 & 2.1972 & 0.015635 \tabularnewline
14 & -0.011106 & -0.0936 & 0.462851 \tabularnewline
15 & -0.031406 & -0.2646 & 0.396031 \tabularnewline
16 & -0.044649 & -0.3762 & 0.353939 \tabularnewline
17 & -0.037448 & -0.3155 & 0.376637 \tabularnewline
18 & 0.054206 & 0.4567 & 0.324624 \tabularnewline
19 & 0.062819 & 0.5293 & 0.299115 \tabularnewline
20 & -0.063407 & -0.5343 & 0.29741 \tabularnewline
21 & -0.053507 & -0.4509 & 0.326732 \tabularnewline
22 & -0.215261 & -1.8138 & 0.036965 \tabularnewline
23 & 0.113629 & 0.9575 & 0.170792 \tabularnewline
24 & 0.01234 & 0.104 & 0.458741 \tabularnewline
25 & 0.028865 & 0.2432 & 0.404269 \tabularnewline
26 & 0.089004 & 0.75 & 0.227877 \tabularnewline
27 & -0.027268 & -0.2298 & 0.409469 \tabularnewline
28 & 0.067733 & 0.5707 & 0.284993 \tabularnewline
29 & 0.092392 & 0.7785 & 0.219428 \tabularnewline
30 & 0.127946 & 1.0781 & 0.14232 \tabularnewline
31 & -0.035178 & -0.2964 & 0.383888 \tabularnewline
32 & -0.036902 & -0.3109 & 0.378379 \tabularnewline
33 & -0.079198 & -0.6673 & 0.25336 \tabularnewline
34 & 0.057452 & 0.4841 & 0.314902 \tabularnewline
35 & -0.03921 & -0.3304 & 0.371038 \tabularnewline
36 & -0.056342 & -0.4747 & 0.318212 \tabularnewline
37 & 0.040656 & 0.3426 & 0.366466 \tabularnewline
38 & -0.159499 & -1.344 & 0.09162 \tabularnewline
39 & 0.042525 & 0.3583 & 0.360582 \tabularnewline
40 & 0.015462 & 0.1303 & 0.448356 \tabularnewline
41 & -0.199089 & -1.6776 & 0.048916 \tabularnewline
42 & -0.185864 & -1.5661 & 0.060884 \tabularnewline
43 & -0.068382 & -0.5762 & 0.283153 \tabularnewline
44 & 0.072871 & 0.614 & 0.270581 \tabularnewline
45 & 0.079345 & 0.6686 & 0.252968 \tabularnewline
46 & -0.066589 & -0.5611 & 0.288251 \tabularnewline
47 & 0.063587 & 0.5358 & 0.296887 \tabularnewline
48 & -0.044892 & -0.3783 & 0.353181 \tabularnewline
\hline
\end{tabular}
%Source: https://freestatistics.org/blog/index.php?pk=293854&T=2

[TABLE]
[ROW][C]Partial Autocorrelation Function[/C][/ROW]
[ROW][C]Time lag k[/C][C]PACF(k)[/C][C]T-STAT[/C][C]P-value[/C][/ROW]
[ROW][C]1[/C][C]-0.26956[/C][C]-2.2714[/C][C]0.01308[/C][/ROW]
[ROW][C]2[/C][C]-0.403364[/C][C]-3.3988[/C][C]0.000557[/C][/ROW]
[ROW][C]3[/C][C]-0.256483[/C][C]-2.1612[/C][C]0.017028[/C][/ROW]
[ROW][C]4[/C][C]-0.142103[/C][C]-1.1974[/C][C]0.117569[/C][/ROW]
[ROW][C]5[/C][C]-0.045122[/C][C]-0.3802[/C][C]0.352465[/C][/ROW]
[ROW][C]6[/C][C]-0.099781[/C][C]-0.8408[/C][C]0.201649[/C][/ROW]
[ROW][C]7[/C][C]-0.112618[/C][C]-0.9489[/C][C]0.172937[/C][/ROW]
[ROW][C]8[/C][C]-0.002042[/C][C]-0.0172[/C][C]0.493162[/C][/ROW]
[ROW][C]9[/C][C]0.085526[/C][C]0.7207[/C][C]0.236745[/C][/ROW]
[ROW][C]10[/C][C]-0.114948[/C][C]-0.9686[/C][C]0.168024[/C][/ROW]
[ROW][C]11[/C][C]-0.163921[/C][C]-1.3812[/C][C]0.085771[/C][/ROW]
[ROW][C]12[/C][C]0.042871[/C][C]0.3612[/C][C]0.359497[/C][/ROW]
[ROW][C]13[/C][C]0.260761[/C][C]2.1972[/C][C]0.015635[/C][/ROW]
[ROW][C]14[/C][C]-0.011106[/C][C]-0.0936[/C][C]0.462851[/C][/ROW]
[ROW][C]15[/C][C]-0.031406[/C][C]-0.2646[/C][C]0.396031[/C][/ROW]
[ROW][C]16[/C][C]-0.044649[/C][C]-0.3762[/C][C]0.353939[/C][/ROW]
[ROW][C]17[/C][C]-0.037448[/C][C]-0.3155[/C][C]0.376637[/C][/ROW]
[ROW][C]18[/C][C]0.054206[/C][C]0.4567[/C][C]0.324624[/C][/ROW]
[ROW][C]19[/C][C]0.062819[/C][C]0.5293[/C][C]0.299115[/C][/ROW]
[ROW][C]20[/C][C]-0.063407[/C][C]-0.5343[/C][C]0.29741[/C][/ROW]
[ROW][C]21[/C][C]-0.053507[/C][C]-0.4509[/C][C]0.326732[/C][/ROW]
[ROW][C]22[/C][C]-0.215261[/C][C]-1.8138[/C][C]0.036965[/C][/ROW]
[ROW][C]23[/C][C]0.113629[/C][C]0.9575[/C][C]0.170792[/C][/ROW]
[ROW][C]24[/C][C]0.01234[/C][C]0.104[/C][C]0.458741[/C][/ROW]
[ROW][C]25[/C][C]0.028865[/C][C]0.2432[/C][C]0.404269[/C][/ROW]
[ROW][C]26[/C][C]0.089004[/C][C]0.75[/C][C]0.227877[/C][/ROW]
[ROW][C]27[/C][C]-0.027268[/C][C]-0.2298[/C][C]0.409469[/C][/ROW]
[ROW][C]28[/C][C]0.067733[/C][C]0.5707[/C][C]0.284993[/C][/ROW]
[ROW][C]29[/C][C]0.092392[/C][C]0.7785[/C][C]0.219428[/C][/ROW]
[ROW][C]30[/C][C]0.127946[/C][C]1.0781[/C][C]0.14232[/C][/ROW]
[ROW][C]31[/C][C]-0.035178[/C][C]-0.2964[/C][C]0.383888[/C][/ROW]
[ROW][C]32[/C][C]-0.036902[/C][C]-0.3109[/C][C]0.378379[/C][/ROW]
[ROW][C]33[/C][C]-0.079198[/C][C]-0.6673[/C][C]0.25336[/C][/ROW]
[ROW][C]34[/C][C]0.057452[/C][C]0.4841[/C][C]0.314902[/C][/ROW]
[ROW][C]35[/C][C]-0.03921[/C][C]-0.3304[/C][C]0.371038[/C][/ROW]
[ROW][C]36[/C][C]-0.056342[/C][C]-0.4747[/C][C]0.318212[/C][/ROW]
[ROW][C]37[/C][C]0.040656[/C][C]0.3426[/C][C]0.366466[/C][/ROW]
[ROW][C]38[/C][C]-0.159499[/C][C]-1.344[/C][C]0.09162[/C][/ROW]
[ROW][C]39[/C][C]0.042525[/C][C]0.3583[/C][C]0.360582[/C][/ROW]
[ROW][C]40[/C][C]0.015462[/C][C]0.1303[/C][C]0.448356[/C][/ROW]
[ROW][C]41[/C][C]-0.199089[/C][C]-1.6776[/C][C]0.048916[/C][/ROW]
[ROW][C]42[/C][C]-0.185864[/C][C]-1.5661[/C][C]0.060884[/C][/ROW]
[ROW][C]43[/C][C]-0.068382[/C][C]-0.5762[/C][C]0.283153[/C][/ROW]
[ROW][C]44[/C][C]0.072871[/C][C]0.614[/C][C]0.270581[/C][/ROW]
[ROW][C]45[/C][C]0.079345[/C][C]0.6686[/C][C]0.252968[/C][/ROW]
[ROW][C]46[/C][C]-0.066589[/C][C]-0.5611[/C][C]0.288251[/C][/ROW]
[ROW][C]47[/C][C]0.063587[/C][C]0.5358[/C][C]0.296887[/C][/ROW]
[ROW][C]48[/C][C]-0.044892[/C][C]-0.3783[/C][C]0.353181[/C][/ROW]
[/TABLE]
Source: https://freestatistics.org/blog/index.php?pk=293854&T=2

Globally Unique Identifier (entire table): ba.freestatistics.org/blog/index.php?pk=293854&T=2

As an alternative you can also use a QR Code:  

The GUIDs for individual cells are displayed in the table below:

Partial Autocorrelation Function
Time lag kPACF(k)T-STATP-value
1-0.26956-2.27140.01308
2-0.403364-3.39880.000557
3-0.256483-2.16120.017028
4-0.142103-1.19740.117569
5-0.045122-0.38020.352465
6-0.099781-0.84080.201649
7-0.112618-0.94890.172937
8-0.002042-0.01720.493162
90.0855260.72070.236745
10-0.114948-0.96860.168024
11-0.163921-1.38120.085771
120.0428710.36120.359497
130.2607612.19720.015635
14-0.011106-0.09360.462851
15-0.031406-0.26460.396031
16-0.044649-0.37620.353939
17-0.037448-0.31550.376637
180.0542060.45670.324624
190.0628190.52930.299115
20-0.063407-0.53430.29741
21-0.053507-0.45090.326732
22-0.215261-1.81380.036965
230.1136290.95750.170792
240.012340.1040.458741
250.0288650.24320.404269
260.0890040.750.227877
27-0.027268-0.22980.409469
280.0677330.57070.284993
290.0923920.77850.219428
300.1279461.07810.14232
31-0.035178-0.29640.383888
32-0.036902-0.31090.378379
33-0.079198-0.66730.25336
340.0574520.48410.314902
35-0.03921-0.33040.371038
36-0.056342-0.47470.318212
370.0406560.34260.366466
38-0.159499-1.3440.09162
390.0425250.35830.360582
400.0154620.13030.448356
41-0.199089-1.67760.048916
42-0.185864-1.56610.060884
43-0.068382-0.57620.283153
440.0728710.6140.270581
450.0793450.66860.252968
46-0.066589-0.56110.288251
470.0635870.53580.296887
48-0.044892-0.37830.353181


Parameters (Session):
par1 = 48 ; par2 = 1 ; par3 = 1 ; par4 = 0 ; par5 = 12 ; par6 = White Noise ; par7 = 0.95 ;
Parameters (R input):
par1 = 48 ; par2 = 1 ; par3 = 1 ; par4 = 0 ; par5 = 12 ; par6 = White Noise ; par7 = 0.95 ; par8 = ;
R code (references can be found in the software module):
par8 <- ''
par7 <- '0.95'
par6 <- 'White Noise'
par5 <- '12'
par4 <- '0'
par3 <- '0'
par2 <- '1'
par1 <- '48'
if (par1 == 'Default') {
par1 = 10*log10(length(x))
} else {
par1 <- as.numeric(par1)
}
par2 <- as.numeric(par2)
par3 <- as.numeric(par3)
par4 <- as.numeric(par4)
par5 <- as.numeric(par5)
if (par6 == 'White Noise') par6 <- 'white' else par6 <- 'ma'
par7 <- as.numeric(par7)
if (par8 != '') par8 <- as.numeric(par8)
x <- na.omit(x)
ox <- x
if (par8 == '') {
if (par2 == 0) {
x <- log(x)
} else {
x <- (x ^ par2 - 1) / par2
}
} else {
x <- log(x,base=par8)
}
if (par3 > 0) x <- diff(x,lag=1,difference=par3)
if (par4 > 0) x <- diff(x,lag=par5,difference=par4)
bitmap(file='picts.png')
op <- par(mfrow=c(2,1))
plot(ox,type='l',main='Original Time Series',xlab='time',ylab='value')
if (par8=='') {
mytitle <- paste('Working Time Series (lambda=',par2,', d=',par3,', D=',par4,')',sep='')
mysub <- paste('(lambda=',par2,', d=',par3,', D=',par4,', CI=', par7, ', CI type=',par6,')',sep='')
} else {
mytitle <- paste('Working Time Series (base=',par8,', d=',par3,', D=',par4,')',sep='')
mysub <- paste('(base=',par8,', d=',par3,', D=',par4,', CI=', par7, ', CI type=',par6,')',sep='')
}
plot(x,type='l', main=mytitle,xlab='time',ylab='value')
par(op)
dev.off()
bitmap(file='pic1.png')
racf <- acf(x, par1, main='Autocorrelation', xlab='time lag', ylab='ACF', ci.type=par6, ci=par7, sub=mysub)
dev.off()
bitmap(file='pic2.png')
rpacf <- pacf(x,par1,main='Partial Autocorrelation',xlab='lags',ylab='PACF',sub=mysub)
dev.off()
(myacf <- c(racf$acf))
(mypacf <- c(rpacf$acf))
lengthx <- length(x)
sqrtn <- sqrt(lengthx)
load(file='createtable')
a<-table.start()
a<-table.row.start(a)
a<-table.element(a,'Autocorrelation Function',4,TRUE)
a<-table.row.end(a)
a<-table.row.start(a)
a<-table.element(a,'Time lag k',header=TRUE)
a<-table.element(a,hyperlink('basics.htm','ACF(k)','click here for more information about the Autocorrelation Function'),header=TRUE)
a<-table.element(a,'T-STAT',header=TRUE)
a<-table.element(a,'P-value',header=TRUE)
a<-table.row.end(a)
for (i in 2:(par1+1)) {
a<-table.row.start(a)
a<-table.element(a,i-1,header=TRUE)
a<-table.element(a,round(myacf[i],6))
mytstat <- myacf[i]*sqrtn
a<-table.element(a,round(mytstat,4))
a<-table.element(a,round(1-pt(abs(mytstat),lengthx),6))
a<-table.row.end(a)
}
a<-table.end(a)
table.save(a,file='mytable.tab')
a<-table.start()
a<-table.row.start(a)
a<-table.element(a,'Partial Autocorrelation Function',4,TRUE)
a<-table.row.end(a)
a<-table.row.start(a)
a<-table.element(a,'Time lag k',header=TRUE)
a<-table.element(a,hyperlink('basics.htm','PACF(k)','click here for more information about the Partial Autocorrelation Function'),header=TRUE)
a<-table.element(a,'T-STAT',header=TRUE)
a<-table.element(a,'P-value',header=TRUE)
a<-table.row.end(a)
for (i in 1:par1) {
a<-table.row.start(a)
a<-table.element(a,i,header=TRUE)
a<-table.element(a,round(mypacf[i],6))
mytstat <- mypacf[i]*sqrtn
a<-table.element(a,round(mytstat,4))
a<-table.element(a,round(1-pt(abs(mytstat),lengthx),6))
a<-table.row.end(a)
}
a<-table.end(a)
table.save(a,file='mytable1.tab')