Free Statistics

of Irreproducible Research!

Author's title

Author*Unverified author*
R Software Modulerwasp_autocorrelation.wasp
Title produced by software(Partial) Autocorrelation Function
Date of computationFri, 11 Mar 2016 13:30:32 +0000
Cite this page as followsStatistical Computations at FreeStatistics.org, Office for Research Development and Education, URL https://freestatistics.org/blog/index.php?v=date/2016/Mar/11/t14577030663jhglv1kmpusmvs.htm/, Retrieved Sat, 25 May 2024 00:19:02 +0000
Statistical Computations at FreeStatistics.org, Office for Research Development and Education, URL https://freestatistics.org/blog/index.php?pk=293852, Retrieved Sat, 25 May 2024 00:19:02 +0000
QR Codes:

Original text written by user:
IsPrivate?No (this computation is public)
User-defined keywords
Estimated Impact157
Family? (F = Feedback message, R = changed R code, M = changed R Module, P = changed Parameters, D = changed Data)
-       [(Partial) Autocorrelation Function] [] [2016-03-11 13:30:32] [e5ae4b5dd737e4828f1ae85ef60fb5e4] [Current]
Feedback Forum

Post a new message
Dataseries X:
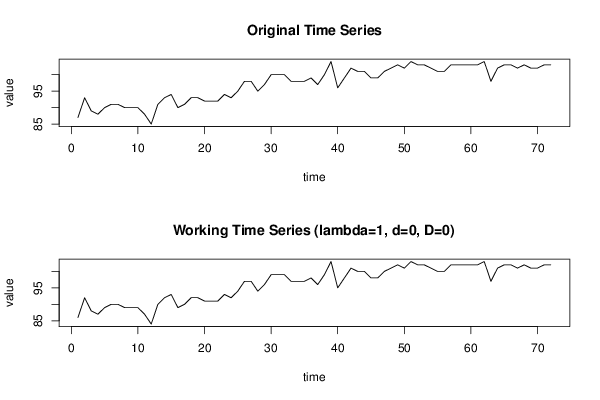
87
93
89
88
90
91
91
90
90
90
88
85
91
93
94
90
91
93
93
92
92
92
94
93
95
98
98
95
97
100
100
100
98
98
98
99
97
100
104
96
99
102
101
101
99
99
101
102
103
102
104
103
103
102
101
101
103
103
103
103
103
104
98
102
103
103
102
103
102
102
103
103


Summary of computational transaction
Raw Inputview raw input (R code)
Raw Outputview raw output of R engine
Computing time1 seconds
R Server'Gertrude Mary Cox' @ cox.wessa.net

\begin{tabular}{lllllllll}
\hline
Summary of computational transaction \tabularnewline
Raw Input & view raw input (R code)  \tabularnewline
Raw Output & view raw output of R engine  \tabularnewline
Computing time & 1 seconds \tabularnewline
R Server & 'Gertrude Mary Cox' @ cox.wessa.net \tabularnewline
\hline
\end{tabular}
%Source: https://freestatistics.org/blog/index.php?pk=293852&T=0

[TABLE]
[ROW][C]Summary of computational transaction[/C][/ROW]
[ROW][C]Raw Input[/C][C]view raw input (R code) [/C][/ROW]
[ROW][C]Raw Output[/C][C]view raw output of R engine [/C][/ROW]
[ROW][C]Computing time[/C][C]1 seconds[/C][/ROW]
[ROW][C]R Server[/C][C]'Gertrude Mary Cox' @ cox.wessa.net[/C][/ROW]
[/TABLE]
Source: https://freestatistics.org/blog/index.php?pk=293852&T=0

Globally Unique Identifier (entire table): ba.freestatistics.org/blog/index.php?pk=293852&T=0

As an alternative you can also use a QR Code:  

The GUIDs for individual cells are displayed in the table below:

Summary of computational transaction
Raw Inputview raw input (R code)
Raw Outputview raw output of R engine
Computing time1 seconds
R Server'Gertrude Mary Cox' @ cox.wessa.net


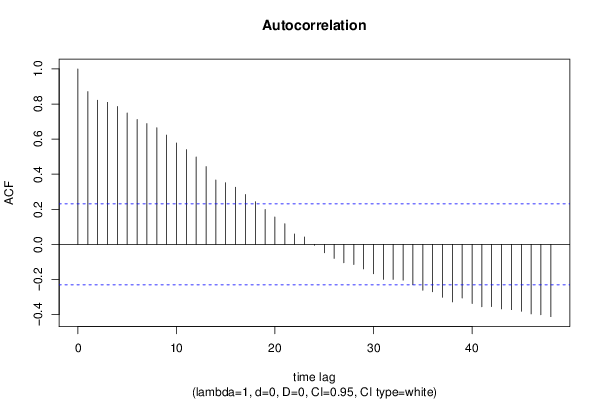
Autocorrelation Function
Time lag kACF(k)T-STATP-value
10.8707057.38820
20.8220596.97540
30.8096686.87030
40.7859416.66890
50.7487436.35330
60.7115466.03770
70.6882125.83970
80.6651585.6440
90.6226855.28371e-06
100.5777994.90283e-06
110.5403774.58539e-06
120.4985224.23013.4e-05
130.4433663.76210.00017
140.3674443.11790.001309
150.3513492.98130.001957
160.3252642.760.003663
170.2848122.41670.009099
180.2432932.06440.021291
190.1984631.6840.048255
200.1561591.32510.094671
210.1178961.00040.160239
220.0591470.50190.308641
230.0423230.35910.360277
24-0.005313-0.04510.482083
25-0.048178-0.40880.341947
26-0.079988-0.67870.249746
27-0.104669-0.88810.188709
28-0.114366-0.97040.167541
29-0.139834-1.18650.119657
30-0.167658-1.42260.079581
31-0.199804-1.69540.047161
32-0.199792-1.69530.047171
33-0.203932-1.73040.043919
34-0.230017-1.95180.027428
35-0.261546-2.21930.014809
36-0.269783-2.28920.012502
37-0.301761-2.56050.006274
38-0.327734-2.78090.003457
39-0.305833-2.59510.005727
40-0.336744-2.85740.00279
41-0.355421-3.01580.00177
42-0.354735-3.010.0018
43-0.367911-3.12180.001294
44-0.372164-3.15790.001161
45-0.381356-3.23590.000917
46-0.396441-3.36390.000617
47-0.401479-3.40670.00054
48-0.412018-3.49610.000406

\begin{tabular}{lllllllll}
\hline
Autocorrelation Function \tabularnewline
Time lag k & ACF(k) & T-STAT & P-value \tabularnewline
1 & 0.870705 & 7.3882 & 0 \tabularnewline
2 & 0.822059 & 6.9754 & 0 \tabularnewline
3 & 0.809668 & 6.8703 & 0 \tabularnewline
4 & 0.785941 & 6.6689 & 0 \tabularnewline
5 & 0.748743 & 6.3533 & 0 \tabularnewline
6 & 0.711546 & 6.0377 & 0 \tabularnewline
7 & 0.688212 & 5.8397 & 0 \tabularnewline
8 & 0.665158 & 5.644 & 0 \tabularnewline
9 & 0.622685 & 5.2837 & 1e-06 \tabularnewline
10 & 0.577799 & 4.9028 & 3e-06 \tabularnewline
11 & 0.540377 & 4.5853 & 9e-06 \tabularnewline
12 & 0.498522 & 4.2301 & 3.4e-05 \tabularnewline
13 & 0.443366 & 3.7621 & 0.00017 \tabularnewline
14 & 0.367444 & 3.1179 & 0.001309 \tabularnewline
15 & 0.351349 & 2.9813 & 0.001957 \tabularnewline
16 & 0.325264 & 2.76 & 0.003663 \tabularnewline
17 & 0.284812 & 2.4167 & 0.009099 \tabularnewline
18 & 0.243293 & 2.0644 & 0.021291 \tabularnewline
19 & 0.198463 & 1.684 & 0.048255 \tabularnewline
20 & 0.156159 & 1.3251 & 0.094671 \tabularnewline
21 & 0.117896 & 1.0004 & 0.160239 \tabularnewline
22 & 0.059147 & 0.5019 & 0.308641 \tabularnewline
23 & 0.042323 & 0.3591 & 0.360277 \tabularnewline
24 & -0.005313 & -0.0451 & 0.482083 \tabularnewline
25 & -0.048178 & -0.4088 & 0.341947 \tabularnewline
26 & -0.079988 & -0.6787 & 0.249746 \tabularnewline
27 & -0.104669 & -0.8881 & 0.188709 \tabularnewline
28 & -0.114366 & -0.9704 & 0.167541 \tabularnewline
29 & -0.139834 & -1.1865 & 0.119657 \tabularnewline
30 & -0.167658 & -1.4226 & 0.079581 \tabularnewline
31 & -0.199804 & -1.6954 & 0.047161 \tabularnewline
32 & -0.199792 & -1.6953 & 0.047171 \tabularnewline
33 & -0.203932 & -1.7304 & 0.043919 \tabularnewline
34 & -0.230017 & -1.9518 & 0.027428 \tabularnewline
35 & -0.261546 & -2.2193 & 0.014809 \tabularnewline
36 & -0.269783 & -2.2892 & 0.012502 \tabularnewline
37 & -0.301761 & -2.5605 & 0.006274 \tabularnewline
38 & -0.327734 & -2.7809 & 0.003457 \tabularnewline
39 & -0.305833 & -2.5951 & 0.005727 \tabularnewline
40 & -0.336744 & -2.8574 & 0.00279 \tabularnewline
41 & -0.355421 & -3.0158 & 0.00177 \tabularnewline
42 & -0.354735 & -3.01 & 0.0018 \tabularnewline
43 & -0.367911 & -3.1218 & 0.001294 \tabularnewline
44 & -0.372164 & -3.1579 & 0.001161 \tabularnewline
45 & -0.381356 & -3.2359 & 0.000917 \tabularnewline
46 & -0.396441 & -3.3639 & 0.000617 \tabularnewline
47 & -0.401479 & -3.4067 & 0.00054 \tabularnewline
48 & -0.412018 & -3.4961 & 0.000406 \tabularnewline
\hline
\end{tabular}
%Source: https://freestatistics.org/blog/index.php?pk=293852&T=1

[TABLE]
[ROW][C]Autocorrelation Function[/C][/ROW]
[ROW][C]Time lag k[/C][C]ACF(k)[/C][C]T-STAT[/C][C]P-value[/C][/ROW]
[ROW][C]1[/C][C]0.870705[/C][C]7.3882[/C][C]0[/C][/ROW]
[ROW][C]2[/C][C]0.822059[/C][C]6.9754[/C][C]0[/C][/ROW]
[ROW][C]3[/C][C]0.809668[/C][C]6.8703[/C][C]0[/C][/ROW]
[ROW][C]4[/C][C]0.785941[/C][C]6.6689[/C][C]0[/C][/ROW]
[ROW][C]5[/C][C]0.748743[/C][C]6.3533[/C][C]0[/C][/ROW]
[ROW][C]6[/C][C]0.711546[/C][C]6.0377[/C][C]0[/C][/ROW]
[ROW][C]7[/C][C]0.688212[/C][C]5.8397[/C][C]0[/C][/ROW]
[ROW][C]8[/C][C]0.665158[/C][C]5.644[/C][C]0[/C][/ROW]
[ROW][C]9[/C][C]0.622685[/C][C]5.2837[/C][C]1e-06[/C][/ROW]
[ROW][C]10[/C][C]0.577799[/C][C]4.9028[/C][C]3e-06[/C][/ROW]
[ROW][C]11[/C][C]0.540377[/C][C]4.5853[/C][C]9e-06[/C][/ROW]
[ROW][C]12[/C][C]0.498522[/C][C]4.2301[/C][C]3.4e-05[/C][/ROW]
[ROW][C]13[/C][C]0.443366[/C][C]3.7621[/C][C]0.00017[/C][/ROW]
[ROW][C]14[/C][C]0.367444[/C][C]3.1179[/C][C]0.001309[/C][/ROW]
[ROW][C]15[/C][C]0.351349[/C][C]2.9813[/C][C]0.001957[/C][/ROW]
[ROW][C]16[/C][C]0.325264[/C][C]2.76[/C][C]0.003663[/C][/ROW]
[ROW][C]17[/C][C]0.284812[/C][C]2.4167[/C][C]0.009099[/C][/ROW]
[ROW][C]18[/C][C]0.243293[/C][C]2.0644[/C][C]0.021291[/C][/ROW]
[ROW][C]19[/C][C]0.198463[/C][C]1.684[/C][C]0.048255[/C][/ROW]
[ROW][C]20[/C][C]0.156159[/C][C]1.3251[/C][C]0.094671[/C][/ROW]
[ROW][C]21[/C][C]0.117896[/C][C]1.0004[/C][C]0.160239[/C][/ROW]
[ROW][C]22[/C][C]0.059147[/C][C]0.5019[/C][C]0.308641[/C][/ROW]
[ROW][C]23[/C][C]0.042323[/C][C]0.3591[/C][C]0.360277[/C][/ROW]
[ROW][C]24[/C][C]-0.005313[/C][C]-0.0451[/C][C]0.482083[/C][/ROW]
[ROW][C]25[/C][C]-0.048178[/C][C]-0.4088[/C][C]0.341947[/C][/ROW]
[ROW][C]26[/C][C]-0.079988[/C][C]-0.6787[/C][C]0.249746[/C][/ROW]
[ROW][C]27[/C][C]-0.104669[/C][C]-0.8881[/C][C]0.188709[/C][/ROW]
[ROW][C]28[/C][C]-0.114366[/C][C]-0.9704[/C][C]0.167541[/C][/ROW]
[ROW][C]29[/C][C]-0.139834[/C][C]-1.1865[/C][C]0.119657[/C][/ROW]
[ROW][C]30[/C][C]-0.167658[/C][C]-1.4226[/C][C]0.079581[/C][/ROW]
[ROW][C]31[/C][C]-0.199804[/C][C]-1.6954[/C][C]0.047161[/C][/ROW]
[ROW][C]32[/C][C]-0.199792[/C][C]-1.6953[/C][C]0.047171[/C][/ROW]
[ROW][C]33[/C][C]-0.203932[/C][C]-1.7304[/C][C]0.043919[/C][/ROW]
[ROW][C]34[/C][C]-0.230017[/C][C]-1.9518[/C][C]0.027428[/C][/ROW]
[ROW][C]35[/C][C]-0.261546[/C][C]-2.2193[/C][C]0.014809[/C][/ROW]
[ROW][C]36[/C][C]-0.269783[/C][C]-2.2892[/C][C]0.012502[/C][/ROW]
[ROW][C]37[/C][C]-0.301761[/C][C]-2.5605[/C][C]0.006274[/C][/ROW]
[ROW][C]38[/C][C]-0.327734[/C][C]-2.7809[/C][C]0.003457[/C][/ROW]
[ROW][C]39[/C][C]-0.305833[/C][C]-2.5951[/C][C]0.005727[/C][/ROW]
[ROW][C]40[/C][C]-0.336744[/C][C]-2.8574[/C][C]0.00279[/C][/ROW]
[ROW][C]41[/C][C]-0.355421[/C][C]-3.0158[/C][C]0.00177[/C][/ROW]
[ROW][C]42[/C][C]-0.354735[/C][C]-3.01[/C][C]0.0018[/C][/ROW]
[ROW][C]43[/C][C]-0.367911[/C][C]-3.1218[/C][C]0.001294[/C][/ROW]
[ROW][C]44[/C][C]-0.372164[/C][C]-3.1579[/C][C]0.001161[/C][/ROW]
[ROW][C]45[/C][C]-0.381356[/C][C]-3.2359[/C][C]0.000917[/C][/ROW]
[ROW][C]46[/C][C]-0.396441[/C][C]-3.3639[/C][C]0.000617[/C][/ROW]
[ROW][C]47[/C][C]-0.401479[/C][C]-3.4067[/C][C]0.00054[/C][/ROW]
[ROW][C]48[/C][C]-0.412018[/C][C]-3.4961[/C][C]0.000406[/C][/ROW]
[/TABLE]
Source: https://freestatistics.org/blog/index.php?pk=293852&T=1

Globally Unique Identifier (entire table): ba.freestatistics.org/blog/index.php?pk=293852&T=1

As an alternative you can also use a QR Code:  

The GUIDs for individual cells are displayed in the table below:

Autocorrelation Function
Time lag kACF(k)T-STATP-value
10.8707057.38820
20.8220596.97540
30.8096686.87030
40.7859416.66890
50.7487436.35330
60.7115466.03770
70.6882125.83970
80.6651585.6440
90.6226855.28371e-06
100.5777994.90283e-06
110.5403774.58539e-06
120.4985224.23013.4e-05
130.4433663.76210.00017
140.3674443.11790.001309
150.3513492.98130.001957
160.3252642.760.003663
170.2848122.41670.009099
180.2432932.06440.021291
190.1984631.6840.048255
200.1561591.32510.094671
210.1178961.00040.160239
220.0591470.50190.308641
230.0423230.35910.360277
24-0.005313-0.04510.482083
25-0.048178-0.40880.341947
26-0.079988-0.67870.249746
27-0.104669-0.88810.188709
28-0.114366-0.97040.167541
29-0.139834-1.18650.119657
30-0.167658-1.42260.079581
31-0.199804-1.69540.047161
32-0.199792-1.69530.047171
33-0.203932-1.73040.043919
34-0.230017-1.95180.027428
35-0.261546-2.21930.014809
36-0.269783-2.28920.012502
37-0.301761-2.56050.006274
38-0.327734-2.78090.003457
39-0.305833-2.59510.005727
40-0.336744-2.85740.00279
41-0.355421-3.01580.00177
42-0.354735-3.010.0018
43-0.367911-3.12180.001294
44-0.372164-3.15790.001161
45-0.381356-3.23590.000917
46-0.396441-3.36390.000617
47-0.401479-3.40670.00054
48-0.412018-3.49610.000406


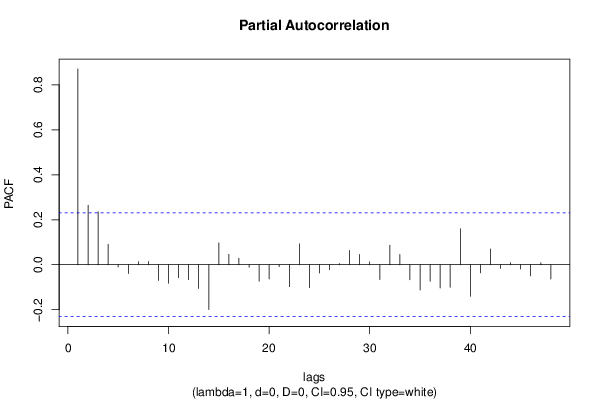
Partial Autocorrelation Function
Time lag kPACF(k)T-STATP-value
10.8707057.38820
20.2643192.24280.013994
30.2353391.99690.024807
40.0912480.77430.220654
5-0.009612-0.08160.46761
6-0.03905-0.33130.370673
70.0131140.11130.455855
80.0140310.11910.452781
9-0.070155-0.59530.27676
10-0.082477-0.69980.243141
11-0.05787-0.4910.312445
12-0.066415-0.56350.287406
13-0.105593-0.8960.186624
14-0.199226-1.69050.04763
150.0973650.82620.205718
160.0462060.39210.348083
170.0291450.24730.402688
18-0.011263-0.09560.462063
19-0.073048-0.61980.268662
20-0.063749-0.54090.295113
21-0.008553-0.07260.471172
22-0.097379-0.82630.205686
230.0926450.78610.217189
24-0.101832-0.86410.195209
25-0.03651-0.30980.378804
26-0.022322-0.18940.425153
270.0054930.04660.481477
280.0634840.53870.295885
290.0456940.38770.34968
300.0125870.10680.457622
31-0.065725-0.55770.289392
320.0867550.73610.232018
330.0451920.38350.351252
34-0.067199-0.57020.285158
35-0.112575-0.95520.171328
36-0.073743-0.62570.266736
37-0.103851-0.88120.190569
38-0.100232-0.85050.198934
390.161.35760.089408
40-0.140089-1.18870.119234
41-0.03617-0.30690.379898
420.0701850.59550.276675
43-0.016713-0.14180.44381
440.0092550.07850.468813
45-0.01909-0.1620.435887
46-0.049544-0.42040.337725
470.009110.07730.469299
48-0.063691-0.54040.295282

\begin{tabular}{lllllllll}
\hline
Partial Autocorrelation Function \tabularnewline
Time lag k & PACF(k) & T-STAT & P-value \tabularnewline
1 & 0.870705 & 7.3882 & 0 \tabularnewline
2 & 0.264319 & 2.2428 & 0.013994 \tabularnewline
3 & 0.235339 & 1.9969 & 0.024807 \tabularnewline
4 & 0.091248 & 0.7743 & 0.220654 \tabularnewline
5 & -0.009612 & -0.0816 & 0.46761 \tabularnewline
6 & -0.03905 & -0.3313 & 0.370673 \tabularnewline
7 & 0.013114 & 0.1113 & 0.455855 \tabularnewline
8 & 0.014031 & 0.1191 & 0.452781 \tabularnewline
9 & -0.070155 & -0.5953 & 0.27676 \tabularnewline
10 & -0.082477 & -0.6998 & 0.243141 \tabularnewline
11 & -0.05787 & -0.491 & 0.312445 \tabularnewline
12 & -0.066415 & -0.5635 & 0.287406 \tabularnewline
13 & -0.105593 & -0.896 & 0.186624 \tabularnewline
14 & -0.199226 & -1.6905 & 0.04763 \tabularnewline
15 & 0.097365 & 0.8262 & 0.205718 \tabularnewline
16 & 0.046206 & 0.3921 & 0.348083 \tabularnewline
17 & 0.029145 & 0.2473 & 0.402688 \tabularnewline
18 & -0.011263 & -0.0956 & 0.462063 \tabularnewline
19 & -0.073048 & -0.6198 & 0.268662 \tabularnewline
20 & -0.063749 & -0.5409 & 0.295113 \tabularnewline
21 & -0.008553 & -0.0726 & 0.471172 \tabularnewline
22 & -0.097379 & -0.8263 & 0.205686 \tabularnewline
23 & 0.092645 & 0.7861 & 0.217189 \tabularnewline
24 & -0.101832 & -0.8641 & 0.195209 \tabularnewline
25 & -0.03651 & -0.3098 & 0.378804 \tabularnewline
26 & -0.022322 & -0.1894 & 0.425153 \tabularnewline
27 & 0.005493 & 0.0466 & 0.481477 \tabularnewline
28 & 0.063484 & 0.5387 & 0.295885 \tabularnewline
29 & 0.045694 & 0.3877 & 0.34968 \tabularnewline
30 & 0.012587 & 0.1068 & 0.457622 \tabularnewline
31 & -0.065725 & -0.5577 & 0.289392 \tabularnewline
32 & 0.086755 & 0.7361 & 0.232018 \tabularnewline
33 & 0.045192 & 0.3835 & 0.351252 \tabularnewline
34 & -0.067199 & -0.5702 & 0.285158 \tabularnewline
35 & -0.112575 & -0.9552 & 0.171328 \tabularnewline
36 & -0.073743 & -0.6257 & 0.266736 \tabularnewline
37 & -0.103851 & -0.8812 & 0.190569 \tabularnewline
38 & -0.100232 & -0.8505 & 0.198934 \tabularnewline
39 & 0.16 & 1.3576 & 0.089408 \tabularnewline
40 & -0.140089 & -1.1887 & 0.119234 \tabularnewline
41 & -0.03617 & -0.3069 & 0.379898 \tabularnewline
42 & 0.070185 & 0.5955 & 0.276675 \tabularnewline
43 & -0.016713 & -0.1418 & 0.44381 \tabularnewline
44 & 0.009255 & 0.0785 & 0.468813 \tabularnewline
45 & -0.01909 & -0.162 & 0.435887 \tabularnewline
46 & -0.049544 & -0.4204 & 0.337725 \tabularnewline
47 & 0.00911 & 0.0773 & 0.469299 \tabularnewline
48 & -0.063691 & -0.5404 & 0.295282 \tabularnewline
\hline
\end{tabular}
%Source: https://freestatistics.org/blog/index.php?pk=293852&T=2

[TABLE]
[ROW][C]Partial Autocorrelation Function[/C][/ROW]
[ROW][C]Time lag k[/C][C]PACF(k)[/C][C]T-STAT[/C][C]P-value[/C][/ROW]
[ROW][C]1[/C][C]0.870705[/C][C]7.3882[/C][C]0[/C][/ROW]
[ROW][C]2[/C][C]0.264319[/C][C]2.2428[/C][C]0.013994[/C][/ROW]
[ROW][C]3[/C][C]0.235339[/C][C]1.9969[/C][C]0.024807[/C][/ROW]
[ROW][C]4[/C][C]0.091248[/C][C]0.7743[/C][C]0.220654[/C][/ROW]
[ROW][C]5[/C][C]-0.009612[/C][C]-0.0816[/C][C]0.46761[/C][/ROW]
[ROW][C]6[/C][C]-0.03905[/C][C]-0.3313[/C][C]0.370673[/C][/ROW]
[ROW][C]7[/C][C]0.013114[/C][C]0.1113[/C][C]0.455855[/C][/ROW]
[ROW][C]8[/C][C]0.014031[/C][C]0.1191[/C][C]0.452781[/C][/ROW]
[ROW][C]9[/C][C]-0.070155[/C][C]-0.5953[/C][C]0.27676[/C][/ROW]
[ROW][C]10[/C][C]-0.082477[/C][C]-0.6998[/C][C]0.243141[/C][/ROW]
[ROW][C]11[/C][C]-0.05787[/C][C]-0.491[/C][C]0.312445[/C][/ROW]
[ROW][C]12[/C][C]-0.066415[/C][C]-0.5635[/C][C]0.287406[/C][/ROW]
[ROW][C]13[/C][C]-0.105593[/C][C]-0.896[/C][C]0.186624[/C][/ROW]
[ROW][C]14[/C][C]-0.199226[/C][C]-1.6905[/C][C]0.04763[/C][/ROW]
[ROW][C]15[/C][C]0.097365[/C][C]0.8262[/C][C]0.205718[/C][/ROW]
[ROW][C]16[/C][C]0.046206[/C][C]0.3921[/C][C]0.348083[/C][/ROW]
[ROW][C]17[/C][C]0.029145[/C][C]0.2473[/C][C]0.402688[/C][/ROW]
[ROW][C]18[/C][C]-0.011263[/C][C]-0.0956[/C][C]0.462063[/C][/ROW]
[ROW][C]19[/C][C]-0.073048[/C][C]-0.6198[/C][C]0.268662[/C][/ROW]
[ROW][C]20[/C][C]-0.063749[/C][C]-0.5409[/C][C]0.295113[/C][/ROW]
[ROW][C]21[/C][C]-0.008553[/C][C]-0.0726[/C][C]0.471172[/C][/ROW]
[ROW][C]22[/C][C]-0.097379[/C][C]-0.8263[/C][C]0.205686[/C][/ROW]
[ROW][C]23[/C][C]0.092645[/C][C]0.7861[/C][C]0.217189[/C][/ROW]
[ROW][C]24[/C][C]-0.101832[/C][C]-0.8641[/C][C]0.195209[/C][/ROW]
[ROW][C]25[/C][C]-0.03651[/C][C]-0.3098[/C][C]0.378804[/C][/ROW]
[ROW][C]26[/C][C]-0.022322[/C][C]-0.1894[/C][C]0.425153[/C][/ROW]
[ROW][C]27[/C][C]0.005493[/C][C]0.0466[/C][C]0.481477[/C][/ROW]
[ROW][C]28[/C][C]0.063484[/C][C]0.5387[/C][C]0.295885[/C][/ROW]
[ROW][C]29[/C][C]0.045694[/C][C]0.3877[/C][C]0.34968[/C][/ROW]
[ROW][C]30[/C][C]0.012587[/C][C]0.1068[/C][C]0.457622[/C][/ROW]
[ROW][C]31[/C][C]-0.065725[/C][C]-0.5577[/C][C]0.289392[/C][/ROW]
[ROW][C]32[/C][C]0.086755[/C][C]0.7361[/C][C]0.232018[/C][/ROW]
[ROW][C]33[/C][C]0.045192[/C][C]0.3835[/C][C]0.351252[/C][/ROW]
[ROW][C]34[/C][C]-0.067199[/C][C]-0.5702[/C][C]0.285158[/C][/ROW]
[ROW][C]35[/C][C]-0.112575[/C][C]-0.9552[/C][C]0.171328[/C][/ROW]
[ROW][C]36[/C][C]-0.073743[/C][C]-0.6257[/C][C]0.266736[/C][/ROW]
[ROW][C]37[/C][C]-0.103851[/C][C]-0.8812[/C][C]0.190569[/C][/ROW]
[ROW][C]38[/C][C]-0.100232[/C][C]-0.8505[/C][C]0.198934[/C][/ROW]
[ROW][C]39[/C][C]0.16[/C][C]1.3576[/C][C]0.089408[/C][/ROW]
[ROW][C]40[/C][C]-0.140089[/C][C]-1.1887[/C][C]0.119234[/C][/ROW]
[ROW][C]41[/C][C]-0.03617[/C][C]-0.3069[/C][C]0.379898[/C][/ROW]
[ROW][C]42[/C][C]0.070185[/C][C]0.5955[/C][C]0.276675[/C][/ROW]
[ROW][C]43[/C][C]-0.016713[/C][C]-0.1418[/C][C]0.44381[/C][/ROW]
[ROW][C]44[/C][C]0.009255[/C][C]0.0785[/C][C]0.468813[/C][/ROW]
[ROW][C]45[/C][C]-0.01909[/C][C]-0.162[/C][C]0.435887[/C][/ROW]
[ROW][C]46[/C][C]-0.049544[/C][C]-0.4204[/C][C]0.337725[/C][/ROW]
[ROW][C]47[/C][C]0.00911[/C][C]0.0773[/C][C]0.469299[/C][/ROW]
[ROW][C]48[/C][C]-0.063691[/C][C]-0.5404[/C][C]0.295282[/C][/ROW]
[/TABLE]
Source: https://freestatistics.org/blog/index.php?pk=293852&T=2

Globally Unique Identifier (entire table): ba.freestatistics.org/blog/index.php?pk=293852&T=2

As an alternative you can also use a QR Code:  

The GUIDs for individual cells are displayed in the table below:

Partial Autocorrelation Function
Time lag kPACF(k)T-STATP-value
10.8707057.38820
20.2643192.24280.013994
30.2353391.99690.024807
40.0912480.77430.220654
5-0.009612-0.08160.46761
6-0.03905-0.33130.370673
70.0131140.11130.455855
80.0140310.11910.452781
9-0.070155-0.59530.27676
10-0.082477-0.69980.243141
11-0.05787-0.4910.312445
12-0.066415-0.56350.287406
13-0.105593-0.8960.186624
14-0.199226-1.69050.04763
150.0973650.82620.205718
160.0462060.39210.348083
170.0291450.24730.402688
18-0.011263-0.09560.462063
19-0.073048-0.61980.268662
20-0.063749-0.54090.295113
21-0.008553-0.07260.471172
22-0.097379-0.82630.205686
230.0926450.78610.217189
24-0.101832-0.86410.195209
25-0.03651-0.30980.378804
26-0.022322-0.18940.425153
270.0054930.04660.481477
280.0634840.53870.295885
290.0456940.38770.34968
300.0125870.10680.457622
31-0.065725-0.55770.289392
320.0867550.73610.232018
330.0451920.38350.351252
34-0.067199-0.57020.285158
35-0.112575-0.95520.171328
36-0.073743-0.62570.266736
37-0.103851-0.88120.190569
38-0.100232-0.85050.198934
390.161.35760.089408
40-0.140089-1.18870.119234
41-0.03617-0.30690.379898
420.0701850.59550.276675
43-0.016713-0.14180.44381
440.0092550.07850.468813
45-0.01909-0.1620.435887
46-0.049544-0.42040.337725
470.009110.07730.469299
48-0.063691-0.54040.295282


Parameters (Session):
par1 = 48 ; par2 = 1 ; par3 = 0 ; par4 = 0 ; par5 = 12 ; par6 = White Noise ; par7 = 0.95 ;
Parameters (R input):
par1 = 48 ; par2 = 1 ; par3 = 0 ; par4 = 0 ; par5 = 12 ; par6 = White Noise ; par7 = 0.95 ; par8 = ;
R code (references can be found in the software module):
if (par1 == 'Default') {
par1 = 10*log10(length(x))
} else {
par1 <- as.numeric(par1)
}
par2 <- as.numeric(par2)
par3 <- as.numeric(par3)
par4 <- as.numeric(par4)
par5 <- as.numeric(par5)
if (par6 == 'White Noise') par6 <- 'white' else par6 <- 'ma'
par7 <- as.numeric(par7)
if (par8 != '') par8 <- as.numeric(par8)
x <- na.omit(x)
ox <- x
if (par8 == '') {
if (par2 == 0) {
x <- log(x)
} else {
x <- (x ^ par2 - 1) / par2
}
} else {
x <- log(x,base=par8)
}
if (par3 > 0) x <- diff(x,lag=1,difference=par3)
if (par4 > 0) x <- diff(x,lag=par5,difference=par4)
bitmap(file='picts.png')
op <- par(mfrow=c(2,1))
plot(ox,type='l',main='Original Time Series',xlab='time',ylab='value')
if (par8=='') {
mytitle <- paste('Working Time Series (lambda=',par2,', d=',par3,', D=',par4,')',sep='')
mysub <- paste('(lambda=',par2,', d=',par3,', D=',par4,', CI=', par7, ', CI type=',par6,')',sep='')
} else {
mytitle <- paste('Working Time Series (base=',par8,', d=',par3,', D=',par4,')',sep='')
mysub <- paste('(base=',par8,', d=',par3,', D=',par4,', CI=', par7, ', CI type=',par6,')',sep='')
}
plot(x,type='l', main=mytitle,xlab='time',ylab='value')
par(op)
dev.off()
bitmap(file='pic1.png')
racf <- acf(x, par1, main='Autocorrelation', xlab='time lag', ylab='ACF', ci.type=par6, ci=par7, sub=mysub)
dev.off()
bitmap(file='pic2.png')
rpacf <- pacf(x,par1,main='Partial Autocorrelation',xlab='lags',ylab='PACF',sub=mysub)
dev.off()
(myacf <- c(racf$acf))
(mypacf <- c(rpacf$acf))
lengthx <- length(x)
sqrtn <- sqrt(lengthx)
load(file='createtable')
a<-table.start()
a<-table.row.start(a)
a<-table.element(a,'Autocorrelation Function',4,TRUE)
a<-table.row.end(a)
a<-table.row.start(a)
a<-table.element(a,'Time lag k',header=TRUE)
a<-table.element(a,hyperlink('basics.htm','ACF(k)','click here for more information about the Autocorrelation Function'),header=TRUE)
a<-table.element(a,'T-STAT',header=TRUE)
a<-table.element(a,'P-value',header=TRUE)
a<-table.row.end(a)
for (i in 2:(par1+1)) {
a<-table.row.start(a)
a<-table.element(a,i-1,header=TRUE)
a<-table.element(a,round(myacf[i],6))
mytstat <- myacf[i]*sqrtn
a<-table.element(a,round(mytstat,4))
a<-table.element(a,round(1-pt(abs(mytstat),lengthx),6))
a<-table.row.end(a)
}
a<-table.end(a)
table.save(a,file='mytable.tab')
a<-table.start()
a<-table.row.start(a)
a<-table.element(a,'Partial Autocorrelation Function',4,TRUE)
a<-table.row.end(a)
a<-table.row.start(a)
a<-table.element(a,'Time lag k',header=TRUE)
a<-table.element(a,hyperlink('basics.htm','PACF(k)','click here for more information about the Partial Autocorrelation Function'),header=TRUE)
a<-table.element(a,'T-STAT',header=TRUE)
a<-table.element(a,'P-value',header=TRUE)
a<-table.row.end(a)
for (i in 1:par1) {
a<-table.row.start(a)
a<-table.element(a,i,header=TRUE)
a<-table.element(a,round(mypacf[i],6))
mytstat <- mypacf[i]*sqrtn
a<-table.element(a,round(mytstat,4))
a<-table.element(a,round(1-pt(abs(mytstat),lengthx),6))
a<-table.row.end(a)
}
a<-table.end(a)
table.save(a,file='mytable1.tab')