Free Statistics

of Irreproducible Research!

Author's title

Author*Unverified author*
R Software Modulerwasp_autocorrelation.wasp
Title produced by software(Partial) Autocorrelation Function
Date of computationFri, 11 Mar 2016 10:20:03 +0000
Cite this page as followsStatistical Computations at FreeStatistics.org, Office for Research Development and Education, URL https://freestatistics.org/blog/index.php?v=date/2016/Mar/11/t1457691682vehny2jrql8i106.htm/, Retrieved Sat, 18 May 2024 14:49:35 +0000
Statistical Computations at FreeStatistics.org, Office for Research Development and Education, URL https://freestatistics.org/blog/index.php?pk=293846, Retrieved Sat, 18 May 2024 14:49:35 +0000
QR Codes:

Original text written by user:
IsPrivate?No (this computation is public)
User-defined keywords
Estimated Impact168
Family? (F = Feedback message, R = changed R code, M = changed R Module, P = changed Parameters, D = changed Data)
-       [(Partial) Autocorrelation Function] [] [2016-03-11 10:20:03] [4c0c83f68a39c2484f611b00ec7d20d3] [Current]
Feedback Forum

Post a new message
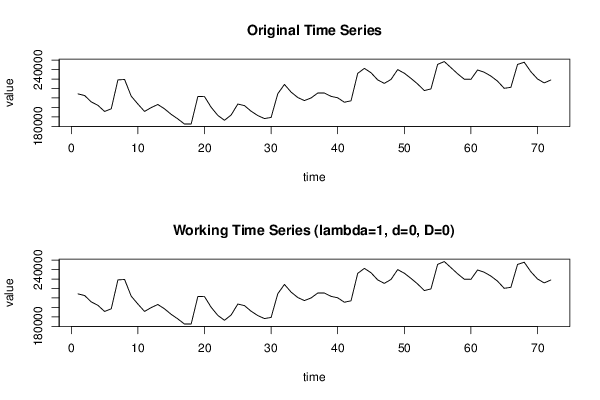
Dataseries X:
214320
212588
205816
202196
195722
198563
229139
229527
211868
203555
195770
199834
203089
198480
192684
187827
182414
182510
211524
211451
200140
191568
186424
191987
203583
201920
195978
191395
188222
189422
214419
224325
216222
210506
207221
210027
215191
215177
211701
210176
205491
206996
235980
241292
236675
229127
225436
229570
239973
236168
230703
224790
217811
219576
245472
248511
242084
235572
229827
229697
239567
237201
233164
227755
220189
221270
245413
247826
237736
230079
225939
228987


Summary of computational transaction
Raw Inputview raw input (R code)
Raw Outputview raw output of R engine
Computing time1 seconds
R Server'Sir Ronald Aylmer Fisher' @ fisher.wessa.net

\begin{tabular}{lllllllll}
\hline
Summary of computational transaction \tabularnewline
Raw Input & view raw input (R code)  \tabularnewline
Raw Output & view raw output of R engine  \tabularnewline
Computing time & 1 seconds \tabularnewline
R Server & 'Sir Ronald Aylmer Fisher' @ fisher.wessa.net \tabularnewline
\hline
\end{tabular}
%Source: https://freestatistics.org/blog/index.php?pk=293846&T=0

[TABLE]
[ROW][C]Summary of computational transaction[/C][/ROW]
[ROW][C]Raw Input[/C][C]view raw input (R code) [/C][/ROW]
[ROW][C]Raw Output[/C][C]view raw output of R engine [/C][/ROW]
[ROW][C]Computing time[/C][C]1 seconds[/C][/ROW]
[ROW][C]R Server[/C][C]'Sir Ronald Aylmer Fisher' @ fisher.wessa.net[/C][/ROW]
[/TABLE]
Source: https://freestatistics.org/blog/index.php?pk=293846&T=0

Globally Unique Identifier (entire table): ba.freestatistics.org/blog/index.php?pk=293846&T=0

As an alternative you can also use a QR Code:  

The GUIDs for individual cells are displayed in the table below:

Summary of computational transaction
Raw Inputview raw input (R code)
Raw Outputview raw output of R engine
Computing time1 seconds
R Server'Sir Ronald Aylmer Fisher' @ fisher.wessa.net


Autocorrelation Function
Time lag kACF(k)T-STATP-value
10.8463757.18170
20.6259695.31151e-06
30.5219264.42871.7e-05
40.5385644.56991e-05
50.6308115.35260
60.677795.75120
70.5917695.02132e-06
80.4607713.90980.000103
90.3910863.31850.000711
100.4235383.59380.000296
110.5573154.7295e-06
120.6399815.43040
130.4960434.20913.7e-05
140.2883652.44690.008426
150.1663141.41120.081244
160.1445921.22690.111928
170.194241.64820.051837
180.2127881.80560.037583

\begin{tabular}{lllllllll}
\hline
Autocorrelation Function \tabularnewline
Time lag k & ACF(k) & T-STAT & P-value \tabularnewline
1 & 0.846375 & 7.1817 & 0 \tabularnewline
2 & 0.625969 & 5.3115 & 1e-06 \tabularnewline
3 & 0.521926 & 4.4287 & 1.7e-05 \tabularnewline
4 & 0.538564 & 4.5699 & 1e-05 \tabularnewline
5 & 0.630811 & 5.3526 & 0 \tabularnewline
6 & 0.67779 & 5.7512 & 0 \tabularnewline
7 & 0.591769 & 5.0213 & 2e-06 \tabularnewline
8 & 0.460771 & 3.9098 & 0.000103 \tabularnewline
9 & 0.391086 & 3.3185 & 0.000711 \tabularnewline
10 & 0.423538 & 3.5938 & 0.000296 \tabularnewline
11 & 0.557315 & 4.729 & 5e-06 \tabularnewline
12 & 0.639981 & 5.4304 & 0 \tabularnewline
13 & 0.496043 & 4.2091 & 3.7e-05 \tabularnewline
14 & 0.288365 & 2.4469 & 0.008426 \tabularnewline
15 & 0.166314 & 1.4112 & 0.081244 \tabularnewline
16 & 0.144592 & 1.2269 & 0.111928 \tabularnewline
17 & 0.19424 & 1.6482 & 0.051837 \tabularnewline
18 & 0.212788 & 1.8056 & 0.037583 \tabularnewline
\hline
\end{tabular}
%Source: https://freestatistics.org/blog/index.php?pk=293846&T=1

[TABLE]
[ROW][C]Autocorrelation Function[/C][/ROW]
[ROW][C]Time lag k[/C][C]ACF(k)[/C][C]T-STAT[/C][C]P-value[/C][/ROW]
[ROW][C]1[/C][C]0.846375[/C][C]7.1817[/C][C]0[/C][/ROW]
[ROW][C]2[/C][C]0.625969[/C][C]5.3115[/C][C]1e-06[/C][/ROW]
[ROW][C]3[/C][C]0.521926[/C][C]4.4287[/C][C]1.7e-05[/C][/ROW]
[ROW][C]4[/C][C]0.538564[/C][C]4.5699[/C][C]1e-05[/C][/ROW]
[ROW][C]5[/C][C]0.630811[/C][C]5.3526[/C][C]0[/C][/ROW]
[ROW][C]6[/C][C]0.67779[/C][C]5.7512[/C][C]0[/C][/ROW]
[ROW][C]7[/C][C]0.591769[/C][C]5.0213[/C][C]2e-06[/C][/ROW]
[ROW][C]8[/C][C]0.460771[/C][C]3.9098[/C][C]0.000103[/C][/ROW]
[ROW][C]9[/C][C]0.391086[/C][C]3.3185[/C][C]0.000711[/C][/ROW]
[ROW][C]10[/C][C]0.423538[/C][C]3.5938[/C][C]0.000296[/C][/ROW]
[ROW][C]11[/C][C]0.557315[/C][C]4.729[/C][C]5e-06[/C][/ROW]
[ROW][C]12[/C][C]0.639981[/C][C]5.4304[/C][C]0[/C][/ROW]
[ROW][C]13[/C][C]0.496043[/C][C]4.2091[/C][C]3.7e-05[/C][/ROW]
[ROW][C]14[/C][C]0.288365[/C][C]2.4469[/C][C]0.008426[/C][/ROW]
[ROW][C]15[/C][C]0.166314[/C][C]1.4112[/C][C]0.081244[/C][/ROW]
[ROW][C]16[/C][C]0.144592[/C][C]1.2269[/C][C]0.111928[/C][/ROW]
[ROW][C]17[/C][C]0.19424[/C][C]1.6482[/C][C]0.051837[/C][/ROW]
[ROW][C]18[/C][C]0.212788[/C][C]1.8056[/C][C]0.037583[/C][/ROW]
[/TABLE]
Source: https://freestatistics.org/blog/index.php?pk=293846&T=1

Globally Unique Identifier (entire table): ba.freestatistics.org/blog/index.php?pk=293846&T=1

As an alternative you can also use a QR Code:  

The GUIDs for individual cells are displayed in the table below:

Autocorrelation Function
Time lag kACF(k)T-STATP-value
10.8463757.18170
20.6259695.31151e-06
30.5219264.42871.7e-05
40.5385644.56991e-05
50.6308115.35260
60.677795.75120
70.5917695.02132e-06
80.4607713.90980.000103
90.3910863.31850.000711
100.4235383.59380.000296
110.5573154.7295e-06
120.6399815.43040
130.4960434.20913.7e-05
140.2883652.44690.008426
150.1663141.41120.081244
160.1445921.22690.111928
170.194241.64820.051837
180.2127881.80560.037583


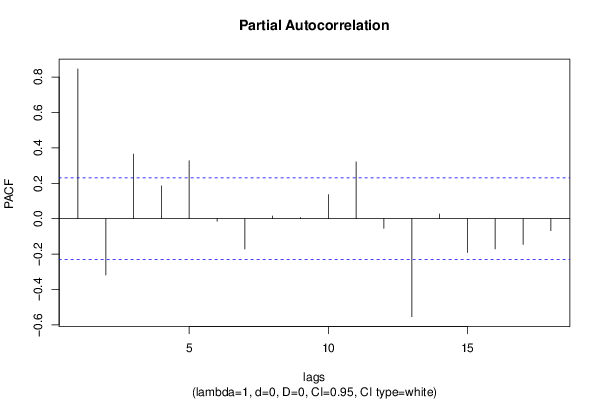
Partial Autocorrelation Function
Time lag kPACF(k)T-STATP-value
10.8463757.18170
2-0.31864-2.70380.004274
30.3648953.09620.001396
40.1852311.57170.060198
50.3276712.78040.003462
6-0.015007-0.12730.449514
7-0.171242-1.4530.075279
80.0156330.13260.447421
90.0063710.05410.478517
100.1361721.15550.125862
110.3211232.72480.004035
12-0.05374-0.4560.324882
13-0.55389-4.69996e-06
140.0262420.22270.412213
15-0.191113-1.62160.054625
16-0.170671-1.44820.075952
17-0.145583-1.23530.110366
18-0.067755-0.57490.28357

\begin{tabular}{lllllllll}
\hline
Partial Autocorrelation Function \tabularnewline
Time lag k & PACF(k) & T-STAT & P-value \tabularnewline
1 & 0.846375 & 7.1817 & 0 \tabularnewline
2 & -0.31864 & -2.7038 & 0.004274 \tabularnewline
3 & 0.364895 & 3.0962 & 0.001396 \tabularnewline
4 & 0.185231 & 1.5717 & 0.060198 \tabularnewline
5 & 0.327671 & 2.7804 & 0.003462 \tabularnewline
6 & -0.015007 & -0.1273 & 0.449514 \tabularnewline
7 & -0.171242 & -1.453 & 0.075279 \tabularnewline
8 & 0.015633 & 0.1326 & 0.447421 \tabularnewline
9 & 0.006371 & 0.0541 & 0.478517 \tabularnewline
10 & 0.136172 & 1.1555 & 0.125862 \tabularnewline
11 & 0.321123 & 2.7248 & 0.004035 \tabularnewline
12 & -0.05374 & -0.456 & 0.324882 \tabularnewline
13 & -0.55389 & -4.6999 & 6e-06 \tabularnewline
14 & 0.026242 & 0.2227 & 0.412213 \tabularnewline
15 & -0.191113 & -1.6216 & 0.054625 \tabularnewline
16 & -0.170671 & -1.4482 & 0.075952 \tabularnewline
17 & -0.145583 & -1.2353 & 0.110366 \tabularnewline
18 & -0.067755 & -0.5749 & 0.28357 \tabularnewline
\hline
\end{tabular}
%Source: https://freestatistics.org/blog/index.php?pk=293846&T=2

[TABLE]
[ROW][C]Partial Autocorrelation Function[/C][/ROW]
[ROW][C]Time lag k[/C][C]PACF(k)[/C][C]T-STAT[/C][C]P-value[/C][/ROW]
[ROW][C]1[/C][C]0.846375[/C][C]7.1817[/C][C]0[/C][/ROW]
[ROW][C]2[/C][C]-0.31864[/C][C]-2.7038[/C][C]0.004274[/C][/ROW]
[ROW][C]3[/C][C]0.364895[/C][C]3.0962[/C][C]0.001396[/C][/ROW]
[ROW][C]4[/C][C]0.185231[/C][C]1.5717[/C][C]0.060198[/C][/ROW]
[ROW][C]5[/C][C]0.327671[/C][C]2.7804[/C][C]0.003462[/C][/ROW]
[ROW][C]6[/C][C]-0.015007[/C][C]-0.1273[/C][C]0.449514[/C][/ROW]
[ROW][C]7[/C][C]-0.171242[/C][C]-1.453[/C][C]0.075279[/C][/ROW]
[ROW][C]8[/C][C]0.015633[/C][C]0.1326[/C][C]0.447421[/C][/ROW]
[ROW][C]9[/C][C]0.006371[/C][C]0.0541[/C][C]0.478517[/C][/ROW]
[ROW][C]10[/C][C]0.136172[/C][C]1.1555[/C][C]0.125862[/C][/ROW]
[ROW][C]11[/C][C]0.321123[/C][C]2.7248[/C][C]0.004035[/C][/ROW]
[ROW][C]12[/C][C]-0.05374[/C][C]-0.456[/C][C]0.324882[/C][/ROW]
[ROW][C]13[/C][C]-0.55389[/C][C]-4.6999[/C][C]6e-06[/C][/ROW]
[ROW][C]14[/C][C]0.026242[/C][C]0.2227[/C][C]0.412213[/C][/ROW]
[ROW][C]15[/C][C]-0.191113[/C][C]-1.6216[/C][C]0.054625[/C][/ROW]
[ROW][C]16[/C][C]-0.170671[/C][C]-1.4482[/C][C]0.075952[/C][/ROW]
[ROW][C]17[/C][C]-0.145583[/C][C]-1.2353[/C][C]0.110366[/C][/ROW]
[ROW][C]18[/C][C]-0.067755[/C][C]-0.5749[/C][C]0.28357[/C][/ROW]
[/TABLE]
Source: https://freestatistics.org/blog/index.php?pk=293846&T=2

Globally Unique Identifier (entire table): ba.freestatistics.org/blog/index.php?pk=293846&T=2

As an alternative you can also use a QR Code:  

The GUIDs for individual cells are displayed in the table below:

Partial Autocorrelation Function
Time lag kPACF(k)T-STATP-value
10.8463757.18170
2-0.31864-2.70380.004274
30.3648953.09620.001396
40.1852311.57170.060198
50.3276712.78040.003462
6-0.015007-0.12730.449514
7-0.171242-1.4530.075279
80.0156330.13260.447421
90.0063710.05410.478517
100.1361721.15550.125862
110.3211232.72480.004035
12-0.05374-0.4560.324882
13-0.55389-4.69996e-06
140.0262420.22270.412213
15-0.191113-1.62160.054625
16-0.170671-1.44820.075952
17-0.145583-1.23530.110366
18-0.067755-0.57490.28357


Parameters (Session):
par1 = Default ; par2 = 1 ; par3 = 0 ; par4 = 0 ; par5 = 12 ; par6 = White Noise ; par7 = 0.95 ;
Parameters (R input):
par1 = Default ; par2 = 1 ; par3 = 0 ; par4 = 0 ; par5 = 12 ; par6 = White Noise ; par7 = 0.95 ; par8 = ;
R code (references can be found in the software module):
if (par1 == 'Default') {
par1 = 10*log10(length(x))
} else {
par1 <- as.numeric(par1)
}
par2 <- as.numeric(par2)
par3 <- as.numeric(par3)
par4 <- as.numeric(par4)
par5 <- as.numeric(par5)
if (par6 == 'White Noise') par6 <- 'white' else par6 <- 'ma'
par7 <- as.numeric(par7)
if (par8 != '') par8 <- as.numeric(par8)
x <- na.omit(x)
ox <- x
if (par8 == '') {
if (par2 == 0) {
x <- log(x)
} else {
x <- (x ^ par2 - 1) / par2
}
} else {
x <- log(x,base=par8)
}
if (par3 > 0) x <- diff(x,lag=1,difference=par3)
if (par4 > 0) x <- diff(x,lag=par5,difference=par4)
bitmap(file='picts.png')
op <- par(mfrow=c(2,1))
plot(ox,type='l',main='Original Time Series',xlab='time',ylab='value')
if (par8=='') {
mytitle <- paste('Working Time Series (lambda=',par2,', d=',par3,', D=',par4,')',sep='')
mysub <- paste('(lambda=',par2,', d=',par3,', D=',par4,', CI=', par7, ', CI type=',par6,')',sep='')
} else {
mytitle <- paste('Working Time Series (base=',par8,', d=',par3,', D=',par4,')',sep='')
mysub <- paste('(base=',par8,', d=',par3,', D=',par4,', CI=', par7, ', CI type=',par6,')',sep='')
}
plot(x,type='l', main=mytitle,xlab='time',ylab='value')
par(op)
dev.off()
bitmap(file='pic1.png')
racf <- acf(x, par1, main='Autocorrelation', xlab='time lag', ylab='ACF', ci.type=par6, ci=par7, sub=mysub)
dev.off()
bitmap(file='pic2.png')
rpacf <- pacf(x,par1,main='Partial Autocorrelation',xlab='lags',ylab='PACF',sub=mysub)
dev.off()
(myacf <- c(racf$acf))
(mypacf <- c(rpacf$acf))
lengthx <- length(x)
sqrtn <- sqrt(lengthx)
load(file='createtable')
a<-table.start()
a<-table.row.start(a)
a<-table.element(a,'Autocorrelation Function',4,TRUE)
a<-table.row.end(a)
a<-table.row.start(a)
a<-table.element(a,'Time lag k',header=TRUE)
a<-table.element(a,hyperlink('basics.htm','ACF(k)','click here for more information about the Autocorrelation Function'),header=TRUE)
a<-table.element(a,'T-STAT',header=TRUE)
a<-table.element(a,'P-value',header=TRUE)
a<-table.row.end(a)
for (i in 2:(par1+1)) {
a<-table.row.start(a)
a<-table.element(a,i-1,header=TRUE)
a<-table.element(a,round(myacf[i],6))
mytstat <- myacf[i]*sqrtn
a<-table.element(a,round(mytstat,4))
a<-table.element(a,round(1-pt(abs(mytstat),lengthx),6))
a<-table.row.end(a)
}
a<-table.end(a)
table.save(a,file='mytable.tab')
a<-table.start()
a<-table.row.start(a)
a<-table.element(a,'Partial Autocorrelation Function',4,TRUE)
a<-table.row.end(a)
a<-table.row.start(a)
a<-table.element(a,'Time lag k',header=TRUE)
a<-table.element(a,hyperlink('basics.htm','PACF(k)','click here for more information about the Partial Autocorrelation Function'),header=TRUE)
a<-table.element(a,'T-STAT',header=TRUE)
a<-table.element(a,'P-value',header=TRUE)
a<-table.row.end(a)
for (i in 1:par1) {
a<-table.row.start(a)
a<-table.element(a,i,header=TRUE)
a<-table.element(a,round(mypacf[i],6))
mytstat <- mypacf[i]*sqrtn
a<-table.element(a,round(mytstat,4))
a<-table.element(a,round(1-pt(abs(mytstat),lengthx),6))
a<-table.row.end(a)
}
a<-table.end(a)
table.save(a,file='mytable1.tab')