Free Statistics

of Irreproducible Research!

Author's title

Author*Unverified author*
R Software Modulerwasp_centraltendency.wasp
Title produced by softwareCentral Tendency
Date of computationFri, 04 Mar 2016 10:46:04 +0000
Cite this page as followsStatistical Computations at FreeStatistics.org, Office for Research Development and Education, URL https://freestatistics.org/blog/index.php?v=date/2016/Mar/04/t1457088514zlw5zwpdyibfezw.htm/, Retrieved Sat, 18 May 2024 15:31:06 +0000
Statistical Computations at FreeStatistics.org, Office for Research Development and Education, URL https://freestatistics.org/blog/index.php?pk=293361, Retrieved Sat, 18 May 2024 15:31:06 +0000
QR Codes:

Original text written by user:
IsPrivate?No (this computation is public)
User-defined keywords
Estimated Impact95
Family? (F = Feedback message, R = changed R code, M = changed R Module, P = changed Parameters, D = changed Data)
-       [Central Tendency] [] [2016-03-04 10:46:04] [4c0c83f68a39c2484f611b00ec7d20d3] [Current]
Feedback Forum

Post a new message
Dataseries X:
214320
212588
205816
202196
195722
198563
229139
229527
211868
203555
195770
199834
203089
198480
192684
187827
182414
182510
211524
211451
200140
191568
186424
191987
203583
201920
195978
191395
188222
189422
214419
224325
216222
210506
207221
210027
215191
215177
211701
210176
205491
206996
235980
241292
236675
229127
225436
229570
239973
236168
230703
224790
217811
219576
245472
248511
242084
235572
229827
229697
239567
237201
233164
227755
220189
221270
245413
247826
237736
230079
225939
228987


Summary of computational transaction
Raw Inputview raw input (R code)
Raw Outputview raw output of R engine
Computing time1 seconds
R Server'Herman Ole Andreas Wold' @ wold.wessa.net

\begin{tabular}{lllllllll}
\hline
Summary of computational transaction \tabularnewline
Raw Input & view raw input (R code)  \tabularnewline
Raw Output & view raw output of R engine  \tabularnewline
Computing time & 1 seconds \tabularnewline
R Server & 'Herman Ole Andreas Wold' @ wold.wessa.net \tabularnewline
\hline
\end{tabular}
%Source: https://freestatistics.org/blog/index.php?pk=293361&T=0

[TABLE]
[ROW][C]Summary of computational transaction[/C][/ROW]
[ROW][C]Raw Input[/C][C]view raw input (R code) [/C][/ROW]
[ROW][C]Raw Output[/C][C]view raw output of R engine [/C][/ROW]
[ROW][C]Computing time[/C][C]1 seconds[/C][/ROW]
[ROW][C]R Server[/C][C]'Herman Ole Andreas Wold' @ wold.wessa.net[/C][/ROW]
[/TABLE]
Source: https://freestatistics.org/blog/index.php?pk=293361&T=0

Globally Unique Identifier (entire table): ba.freestatistics.org/blog/index.php?pk=293361&T=0

As an alternative you can also use a QR Code:  

The GUIDs for individual cells are displayed in the table below:

Summary of computational transaction
Raw Inputview raw input (R code)
Raw Outputview raw output of R engine
Computing time1 seconds
R Server'Herman Ole Andreas Wold' @ wold.wessa.net


Central Tendency - Ungrouped Data
MeasureValueS.E.Value/S.E.
Arithmetic Mean215977.1944444442111.41749641009102.290141486303
Geometric Mean215239.34277564
Harmonic Mean214497.748656751
Quadratic Mean216708.727265488
Winsorized Mean ( 1 / 24 )215969.0138888892109.0749028451102.399878542745
Winsorized Mean ( 2 / 24 )216012.3472222222072.48203600836104.228815241393
Winsorized Mean ( 3 / 24 )216068.3472222222060.46869726524104.863688300142
Winsorized Mean ( 4 / 24 )215905.3472222222020.79595136614106.841735839911
Winsorized Mean ( 5 / 24 )215933.6805555561995.01480768293108.236630487143
Winsorized Mean ( 6 / 24 )215988.1805555561945.59757871775111.013800036647
Winsorized Mean ( 7 / 24 )215965.5277777781935.79154550725111.564454488402
Winsorized Mean ( 8 / 24 )215808.6388888891893.46561369483113.975472978233
Winsorized Mean ( 9 / 24 )215828.8888888891867.29616686454115.583640516596
Winsorized Mean ( 10 / 24 )216177.7777777781784.54474696519121.138894468974
Winsorized Mean ( 11 / 24 )216107.6527777781770.91495080178122.031638323418
Winsorized Mean ( 12 / 24 )216110.9861111111760.32895869995122.767386767707
Winsorized Mean ( 13 / 24 )216489.0694444441677.99212481509129.016737470267
Winsorized Mean ( 14 / 24 )216036.9861111111602.74733228526134.791667881348
Winsorized Mean ( 15 / 24 )215789.0694444441487.53191577212145.065169463901
Winsorized Mean ( 16 / 24 )215718.4027777781457.86675106922147.968531842548
Winsorized Mean ( 17 / 24 )216079.1805555561387.72872345736155.707075095498
Winsorized Mean ( 18 / 24 )216115.6805555561373.31470739033157.367921127295
Winsorized Mean ( 19 / 24 )216317.8194444441335.37254862947161.990614279481
Winsorized Mean ( 20 / 24 )216435.3194444441315.74572190266164.496312502893
Winsorized Mean ( 21 / 24 )216330.3194444441298.82890489422166.557980523279
Winsorized Mean ( 22 / 24 )216909.6527777781219.52074002536177.864669011916
Winsorized Mean ( 23 / 24 )216968.751199.56664151902180.872610566471
Winsorized Mean ( 24 / 24 )216951.4166666671090.88061901443198.877322490772
Trimmed Mean ( 1 / 24 )215991.92065.42938393466104.574817071951
Trimmed Mean ( 2 / 24 )216016.1323529412013.46899399362107.285551949069
Trimmed Mean ( 3 / 24 )216018.1969696971974.60230278952109.398331332101
Trimmed Mean ( 4 / 24 )215999.3906251933.16669048045111.733453555067
Trimmed Mean ( 5 / 24 )216026.6935483871897.42830140102113.852361846231
Trimmed Mean ( 6 / 24 )216049.0166666671861.740138932116.046816711276
Trimmed Mean ( 7 / 24 )216061.6034482761831.50848705009117.969206790996
Trimmed Mean ( 8 / 24 )216079.251796.21407776171120.297047370467
Trimmed Mean ( 9 / 24 )216124.3518518521762.21945934417122.643267106064
Trimmed Mean ( 10 / 24 )216169.8076923081725.28027190374125.295472980617
Trimmed Mean ( 11 / 24 )216168.661696.97765083596127.384506150397
Trimmed Mean ( 12 / 24 )216176.9791666671663.01869727636129.990708775983
Trimmed Mean ( 13 / 24 )216185.5869565221620.98290650003133.366975117154
Trimmed Mean ( 14 / 24 )216147.3863636361584.43091210655136.419571665805
Trimmed Mean ( 15 / 24 )216160.9047619051552.58835056369139.226153979208
Trimmed Mean ( 16 / 24 )216205.5251534.39491080089140.906049334555
Trimmed Mean ( 17 / 24 )216263.2105263161513.83210534833142.858121295132
Trimmed Mean ( 18 / 24 )216284.8611111111499.30986195225144.25627857172
Trimmed Mean ( 19 / 24 )216304.7647058821478.90602848966146.25997902435
Trimmed Mean ( 20 / 24 )216303.218751456.13757750624148.545866881917
Trimmed Mean ( 21 / 24 )216287.3666666671424.73265932118151.80908870982
Trimmed Mean ( 22 / 24 )216282.1071428571379.85063348859156.743129940119
Trimmed Mean ( 23 / 24 )216203.1153846151334.63521760923161.994163297973
Trimmed Mean ( 24 / 24 )216103.251267.09615418455170.550000713304
Median214798
Midrange215462.5
Midmean - Weighted Average at Xnp215896.621621622
Midmean - Weighted Average at X(n+1)p216284.861111111
Midmean - Empirical Distribution Function215896.621621622
Midmean - Empirical Distribution Function - Averaging216284.861111111
Midmean - Empirical Distribution Function - Interpolation216284.861111111
Midmean - Closest Observation215896.621621622
Midmean - True Basic - Statistics Graphics Toolkit216284.861111111
Midmean - MS Excel (old versions)216263.210526316
Number of observations72

\begin{tabular}{lllllllll}
\hline
Central Tendency - Ungrouped Data \tabularnewline
Measure & Value & S.E. & Value/S.E. \tabularnewline
Arithmetic Mean & 215977.194444444 & 2111.41749641009 & 102.290141486303 \tabularnewline
Geometric Mean & 215239.34277564 &  &  \tabularnewline
Harmonic Mean & 214497.748656751 &  &  \tabularnewline
Quadratic Mean & 216708.727265488 &  &  \tabularnewline
Winsorized Mean ( 1 / 24 ) & 215969.013888889 & 2109.0749028451 & 102.399878542745 \tabularnewline
Winsorized Mean ( 2 / 24 ) & 216012.347222222 & 2072.48203600836 & 104.228815241393 \tabularnewline
Winsorized Mean ( 3 / 24 ) & 216068.347222222 & 2060.46869726524 & 104.863688300142 \tabularnewline
Winsorized Mean ( 4 / 24 ) & 215905.347222222 & 2020.79595136614 & 106.841735839911 \tabularnewline
Winsorized Mean ( 5 / 24 ) & 215933.680555556 & 1995.01480768293 & 108.236630487143 \tabularnewline
Winsorized Mean ( 6 / 24 ) & 215988.180555556 & 1945.59757871775 & 111.013800036647 \tabularnewline
Winsorized Mean ( 7 / 24 ) & 215965.527777778 & 1935.79154550725 & 111.564454488402 \tabularnewline
Winsorized Mean ( 8 / 24 ) & 215808.638888889 & 1893.46561369483 & 113.975472978233 \tabularnewline
Winsorized Mean ( 9 / 24 ) & 215828.888888889 & 1867.29616686454 & 115.583640516596 \tabularnewline
Winsorized Mean ( 10 / 24 ) & 216177.777777778 & 1784.54474696519 & 121.138894468974 \tabularnewline
Winsorized Mean ( 11 / 24 ) & 216107.652777778 & 1770.91495080178 & 122.031638323418 \tabularnewline
Winsorized Mean ( 12 / 24 ) & 216110.986111111 & 1760.32895869995 & 122.767386767707 \tabularnewline
Winsorized Mean ( 13 / 24 ) & 216489.069444444 & 1677.99212481509 & 129.016737470267 \tabularnewline
Winsorized Mean ( 14 / 24 ) & 216036.986111111 & 1602.74733228526 & 134.791667881348 \tabularnewline
Winsorized Mean ( 15 / 24 ) & 215789.069444444 & 1487.53191577212 & 145.065169463901 \tabularnewline
Winsorized Mean ( 16 / 24 ) & 215718.402777778 & 1457.86675106922 & 147.968531842548 \tabularnewline
Winsorized Mean ( 17 / 24 ) & 216079.180555556 & 1387.72872345736 & 155.707075095498 \tabularnewline
Winsorized Mean ( 18 / 24 ) & 216115.680555556 & 1373.31470739033 & 157.367921127295 \tabularnewline
Winsorized Mean ( 19 / 24 ) & 216317.819444444 & 1335.37254862947 & 161.990614279481 \tabularnewline
Winsorized Mean ( 20 / 24 ) & 216435.319444444 & 1315.74572190266 & 164.496312502893 \tabularnewline
Winsorized Mean ( 21 / 24 ) & 216330.319444444 & 1298.82890489422 & 166.557980523279 \tabularnewline
Winsorized Mean ( 22 / 24 ) & 216909.652777778 & 1219.52074002536 & 177.864669011916 \tabularnewline
Winsorized Mean ( 23 / 24 ) & 216968.75 & 1199.56664151902 & 180.872610566471 \tabularnewline
Winsorized Mean ( 24 / 24 ) & 216951.416666667 & 1090.88061901443 & 198.877322490772 \tabularnewline
Trimmed Mean ( 1 / 24 ) & 215991.9 & 2065.42938393466 & 104.574817071951 \tabularnewline
Trimmed Mean ( 2 / 24 ) & 216016.132352941 & 2013.46899399362 & 107.285551949069 \tabularnewline
Trimmed Mean ( 3 / 24 ) & 216018.196969697 & 1974.60230278952 & 109.398331332101 \tabularnewline
Trimmed Mean ( 4 / 24 ) & 215999.390625 & 1933.16669048045 & 111.733453555067 \tabularnewline
Trimmed Mean ( 5 / 24 ) & 216026.693548387 & 1897.42830140102 & 113.852361846231 \tabularnewline
Trimmed Mean ( 6 / 24 ) & 216049.016666667 & 1861.740138932 & 116.046816711276 \tabularnewline
Trimmed Mean ( 7 / 24 ) & 216061.603448276 & 1831.50848705009 & 117.969206790996 \tabularnewline
Trimmed Mean ( 8 / 24 ) & 216079.25 & 1796.21407776171 & 120.297047370467 \tabularnewline
Trimmed Mean ( 9 / 24 ) & 216124.351851852 & 1762.21945934417 & 122.643267106064 \tabularnewline
Trimmed Mean ( 10 / 24 ) & 216169.807692308 & 1725.28027190374 & 125.295472980617 \tabularnewline
Trimmed Mean ( 11 / 24 ) & 216168.66 & 1696.97765083596 & 127.384506150397 \tabularnewline
Trimmed Mean ( 12 / 24 ) & 216176.979166667 & 1663.01869727636 & 129.990708775983 \tabularnewline
Trimmed Mean ( 13 / 24 ) & 216185.586956522 & 1620.98290650003 & 133.366975117154 \tabularnewline
Trimmed Mean ( 14 / 24 ) & 216147.386363636 & 1584.43091210655 & 136.419571665805 \tabularnewline
Trimmed Mean ( 15 / 24 ) & 216160.904761905 & 1552.58835056369 & 139.226153979208 \tabularnewline
Trimmed Mean ( 16 / 24 ) & 216205.525 & 1534.39491080089 & 140.906049334555 \tabularnewline
Trimmed Mean ( 17 / 24 ) & 216263.210526316 & 1513.83210534833 & 142.858121295132 \tabularnewline
Trimmed Mean ( 18 / 24 ) & 216284.861111111 & 1499.30986195225 & 144.25627857172 \tabularnewline
Trimmed Mean ( 19 / 24 ) & 216304.764705882 & 1478.90602848966 & 146.25997902435 \tabularnewline
Trimmed Mean ( 20 / 24 ) & 216303.21875 & 1456.13757750624 & 148.545866881917 \tabularnewline
Trimmed Mean ( 21 / 24 ) & 216287.366666667 & 1424.73265932118 & 151.80908870982 \tabularnewline
Trimmed Mean ( 22 / 24 ) & 216282.107142857 & 1379.85063348859 & 156.743129940119 \tabularnewline
Trimmed Mean ( 23 / 24 ) & 216203.115384615 & 1334.63521760923 & 161.994163297973 \tabularnewline
Trimmed Mean ( 24 / 24 ) & 216103.25 & 1267.09615418455 & 170.550000713304 \tabularnewline
Median & 214798 &  &  \tabularnewline
Midrange & 215462.5 &  &  \tabularnewline
Midmean - Weighted Average at Xnp & 215896.621621622 &  &  \tabularnewline
Midmean - Weighted Average at X(n+1)p & 216284.861111111 &  &  \tabularnewline
Midmean - Empirical Distribution Function & 215896.621621622 &  &  \tabularnewline
Midmean - Empirical Distribution Function - Averaging & 216284.861111111 &  &  \tabularnewline
Midmean - Empirical Distribution Function - Interpolation & 216284.861111111 &  &  \tabularnewline
Midmean - Closest Observation & 215896.621621622 &  &  \tabularnewline
Midmean - True Basic - Statistics Graphics Toolkit & 216284.861111111 &  &  \tabularnewline
Midmean - MS Excel (old versions) & 216263.210526316 &  &  \tabularnewline
Number of observations & 72 &  &  \tabularnewline
\hline
\end{tabular}
%Source: https://freestatistics.org/blog/index.php?pk=293361&T=1

[TABLE]
[ROW][C]Central Tendency - Ungrouped Data[/C][/ROW]
[ROW][C]Measure[/C][C]Value[/C][C]S.E.[/C][C]Value/S.E.[/C][/ROW]
[ROW][C]Arithmetic Mean[/C][C]215977.194444444[/C][C]2111.41749641009[/C][C]102.290141486303[/C][/ROW]
[ROW][C]Geometric Mean[/C][C]215239.34277564[/C][C][/C][C][/C][/ROW]
[ROW][C]Harmonic Mean[/C][C]214497.748656751[/C][C][/C][C][/C][/ROW]
[ROW][C]Quadratic Mean[/C][C]216708.727265488[/C][C][/C][C][/C][/ROW]
[ROW][C]Winsorized Mean ( 1 / 24 )[/C][C]215969.013888889[/C][C]2109.0749028451[/C][C]102.399878542745[/C][/ROW]
[ROW][C]Winsorized Mean ( 2 / 24 )[/C][C]216012.347222222[/C][C]2072.48203600836[/C][C]104.228815241393[/C][/ROW]
[ROW][C]Winsorized Mean ( 3 / 24 )[/C][C]216068.347222222[/C][C]2060.46869726524[/C][C]104.863688300142[/C][/ROW]
[ROW][C]Winsorized Mean ( 4 / 24 )[/C][C]215905.347222222[/C][C]2020.79595136614[/C][C]106.841735839911[/C][/ROW]
[ROW][C]Winsorized Mean ( 5 / 24 )[/C][C]215933.680555556[/C][C]1995.01480768293[/C][C]108.236630487143[/C][/ROW]
[ROW][C]Winsorized Mean ( 6 / 24 )[/C][C]215988.180555556[/C][C]1945.59757871775[/C][C]111.013800036647[/C][/ROW]
[ROW][C]Winsorized Mean ( 7 / 24 )[/C][C]215965.527777778[/C][C]1935.79154550725[/C][C]111.564454488402[/C][/ROW]
[ROW][C]Winsorized Mean ( 8 / 24 )[/C][C]215808.638888889[/C][C]1893.46561369483[/C][C]113.975472978233[/C][/ROW]
[ROW][C]Winsorized Mean ( 9 / 24 )[/C][C]215828.888888889[/C][C]1867.29616686454[/C][C]115.583640516596[/C][/ROW]
[ROW][C]Winsorized Mean ( 10 / 24 )[/C][C]216177.777777778[/C][C]1784.54474696519[/C][C]121.138894468974[/C][/ROW]
[ROW][C]Winsorized Mean ( 11 / 24 )[/C][C]216107.652777778[/C][C]1770.91495080178[/C][C]122.031638323418[/C][/ROW]
[ROW][C]Winsorized Mean ( 12 / 24 )[/C][C]216110.986111111[/C][C]1760.32895869995[/C][C]122.767386767707[/C][/ROW]
[ROW][C]Winsorized Mean ( 13 / 24 )[/C][C]216489.069444444[/C][C]1677.99212481509[/C][C]129.016737470267[/C][/ROW]
[ROW][C]Winsorized Mean ( 14 / 24 )[/C][C]216036.986111111[/C][C]1602.74733228526[/C][C]134.791667881348[/C][/ROW]
[ROW][C]Winsorized Mean ( 15 / 24 )[/C][C]215789.069444444[/C][C]1487.53191577212[/C][C]145.065169463901[/C][/ROW]
[ROW][C]Winsorized Mean ( 16 / 24 )[/C][C]215718.402777778[/C][C]1457.86675106922[/C][C]147.968531842548[/C][/ROW]
[ROW][C]Winsorized Mean ( 17 / 24 )[/C][C]216079.180555556[/C][C]1387.72872345736[/C][C]155.707075095498[/C][/ROW]
[ROW][C]Winsorized Mean ( 18 / 24 )[/C][C]216115.680555556[/C][C]1373.31470739033[/C][C]157.367921127295[/C][/ROW]
[ROW][C]Winsorized Mean ( 19 / 24 )[/C][C]216317.819444444[/C][C]1335.37254862947[/C][C]161.990614279481[/C][/ROW]
[ROW][C]Winsorized Mean ( 20 / 24 )[/C][C]216435.319444444[/C][C]1315.74572190266[/C][C]164.496312502893[/C][/ROW]
[ROW][C]Winsorized Mean ( 21 / 24 )[/C][C]216330.319444444[/C][C]1298.82890489422[/C][C]166.557980523279[/C][/ROW]
[ROW][C]Winsorized Mean ( 22 / 24 )[/C][C]216909.652777778[/C][C]1219.52074002536[/C][C]177.864669011916[/C][/ROW]
[ROW][C]Winsorized Mean ( 23 / 24 )[/C][C]216968.75[/C][C]1199.56664151902[/C][C]180.872610566471[/C][/ROW]
[ROW][C]Winsorized Mean ( 24 / 24 )[/C][C]216951.416666667[/C][C]1090.88061901443[/C][C]198.877322490772[/C][/ROW]
[ROW][C]Trimmed Mean ( 1 / 24 )[/C][C]215991.9[/C][C]2065.42938393466[/C][C]104.574817071951[/C][/ROW]
[ROW][C]Trimmed Mean ( 2 / 24 )[/C][C]216016.132352941[/C][C]2013.46899399362[/C][C]107.285551949069[/C][/ROW]
[ROW][C]Trimmed Mean ( 3 / 24 )[/C][C]216018.196969697[/C][C]1974.60230278952[/C][C]109.398331332101[/C][/ROW]
[ROW][C]Trimmed Mean ( 4 / 24 )[/C][C]215999.390625[/C][C]1933.16669048045[/C][C]111.733453555067[/C][/ROW]
[ROW][C]Trimmed Mean ( 5 / 24 )[/C][C]216026.693548387[/C][C]1897.42830140102[/C][C]113.852361846231[/C][/ROW]
[ROW][C]Trimmed Mean ( 6 / 24 )[/C][C]216049.016666667[/C][C]1861.740138932[/C][C]116.046816711276[/C][/ROW]
[ROW][C]Trimmed Mean ( 7 / 24 )[/C][C]216061.603448276[/C][C]1831.50848705009[/C][C]117.969206790996[/C][/ROW]
[ROW][C]Trimmed Mean ( 8 / 24 )[/C][C]216079.25[/C][C]1796.21407776171[/C][C]120.297047370467[/C][/ROW]
[ROW][C]Trimmed Mean ( 9 / 24 )[/C][C]216124.351851852[/C][C]1762.21945934417[/C][C]122.643267106064[/C][/ROW]
[ROW][C]Trimmed Mean ( 10 / 24 )[/C][C]216169.807692308[/C][C]1725.28027190374[/C][C]125.295472980617[/C][/ROW]
[ROW][C]Trimmed Mean ( 11 / 24 )[/C][C]216168.66[/C][C]1696.97765083596[/C][C]127.384506150397[/C][/ROW]
[ROW][C]Trimmed Mean ( 12 / 24 )[/C][C]216176.979166667[/C][C]1663.01869727636[/C][C]129.990708775983[/C][/ROW]
[ROW][C]Trimmed Mean ( 13 / 24 )[/C][C]216185.586956522[/C][C]1620.98290650003[/C][C]133.366975117154[/C][/ROW]
[ROW][C]Trimmed Mean ( 14 / 24 )[/C][C]216147.386363636[/C][C]1584.43091210655[/C][C]136.419571665805[/C][/ROW]
[ROW][C]Trimmed Mean ( 15 / 24 )[/C][C]216160.904761905[/C][C]1552.58835056369[/C][C]139.226153979208[/C][/ROW]
[ROW][C]Trimmed Mean ( 16 / 24 )[/C][C]216205.525[/C][C]1534.39491080089[/C][C]140.906049334555[/C][/ROW]
[ROW][C]Trimmed Mean ( 17 / 24 )[/C][C]216263.210526316[/C][C]1513.83210534833[/C][C]142.858121295132[/C][/ROW]
[ROW][C]Trimmed Mean ( 18 / 24 )[/C][C]216284.861111111[/C][C]1499.30986195225[/C][C]144.25627857172[/C][/ROW]
[ROW][C]Trimmed Mean ( 19 / 24 )[/C][C]216304.764705882[/C][C]1478.90602848966[/C][C]146.25997902435[/C][/ROW]
[ROW][C]Trimmed Mean ( 20 / 24 )[/C][C]216303.21875[/C][C]1456.13757750624[/C][C]148.545866881917[/C][/ROW]
[ROW][C]Trimmed Mean ( 21 / 24 )[/C][C]216287.366666667[/C][C]1424.73265932118[/C][C]151.80908870982[/C][/ROW]
[ROW][C]Trimmed Mean ( 22 / 24 )[/C][C]216282.107142857[/C][C]1379.85063348859[/C][C]156.743129940119[/C][/ROW]
[ROW][C]Trimmed Mean ( 23 / 24 )[/C][C]216203.115384615[/C][C]1334.63521760923[/C][C]161.994163297973[/C][/ROW]
[ROW][C]Trimmed Mean ( 24 / 24 )[/C][C]216103.25[/C][C]1267.09615418455[/C][C]170.550000713304[/C][/ROW]
[ROW][C]Median[/C][C]214798[/C][C][/C][C][/C][/ROW]
[ROW][C]Midrange[/C][C]215462.5[/C][C][/C][C][/C][/ROW]
[ROW][C]Midmean - Weighted Average at Xnp[/C][C]215896.621621622[/C][C][/C][C][/C][/ROW]
[ROW][C]Midmean - Weighted Average at X(n+1)p[/C][C]216284.861111111[/C][C][/C][C][/C][/ROW]
[ROW][C]Midmean - Empirical Distribution Function[/C][C]215896.621621622[/C][C][/C][C][/C][/ROW]
[ROW][C]Midmean - Empirical Distribution Function - Averaging[/C][C]216284.861111111[/C][C][/C][C][/C][/ROW]
[ROW][C]Midmean - Empirical Distribution Function - Interpolation[/C][C]216284.861111111[/C][C][/C][C][/C][/ROW]
[ROW][C]Midmean - Closest Observation[/C][C]215896.621621622[/C][C][/C][C][/C][/ROW]
[ROW][C]Midmean - True Basic - Statistics Graphics Toolkit[/C][C]216284.861111111[/C][C][/C][C][/C][/ROW]
[ROW][C]Midmean - MS Excel (old versions)[/C][C]216263.210526316[/C][C][/C][C][/C][/ROW]
[ROW][C]Number of observations[/C][C]72[/C][C][/C][C][/C][/ROW]
[/TABLE]
Source: https://freestatistics.org/blog/index.php?pk=293361&T=1

Globally Unique Identifier (entire table): ba.freestatistics.org/blog/index.php?pk=293361&T=1

As an alternative you can also use a QR Code:  

The GUIDs for individual cells are displayed in the table below:

Central Tendency - Ungrouped Data
MeasureValueS.E.Value/S.E.
Arithmetic Mean215977.1944444442111.41749641009102.290141486303
Geometric Mean215239.34277564
Harmonic Mean214497.748656751
Quadratic Mean216708.727265488
Winsorized Mean ( 1 / 24 )215969.0138888892109.0749028451102.399878542745
Winsorized Mean ( 2 / 24 )216012.3472222222072.48203600836104.228815241393
Winsorized Mean ( 3 / 24 )216068.3472222222060.46869726524104.863688300142
Winsorized Mean ( 4 / 24 )215905.3472222222020.79595136614106.841735839911
Winsorized Mean ( 5 / 24 )215933.6805555561995.01480768293108.236630487143
Winsorized Mean ( 6 / 24 )215988.1805555561945.59757871775111.013800036647
Winsorized Mean ( 7 / 24 )215965.5277777781935.79154550725111.564454488402
Winsorized Mean ( 8 / 24 )215808.6388888891893.46561369483113.975472978233
Winsorized Mean ( 9 / 24 )215828.8888888891867.29616686454115.583640516596
Winsorized Mean ( 10 / 24 )216177.7777777781784.54474696519121.138894468974
Winsorized Mean ( 11 / 24 )216107.6527777781770.91495080178122.031638323418
Winsorized Mean ( 12 / 24 )216110.9861111111760.32895869995122.767386767707
Winsorized Mean ( 13 / 24 )216489.0694444441677.99212481509129.016737470267
Winsorized Mean ( 14 / 24 )216036.9861111111602.74733228526134.791667881348
Winsorized Mean ( 15 / 24 )215789.0694444441487.53191577212145.065169463901
Winsorized Mean ( 16 / 24 )215718.4027777781457.86675106922147.968531842548
Winsorized Mean ( 17 / 24 )216079.1805555561387.72872345736155.707075095498
Winsorized Mean ( 18 / 24 )216115.6805555561373.31470739033157.367921127295
Winsorized Mean ( 19 / 24 )216317.8194444441335.37254862947161.990614279481
Winsorized Mean ( 20 / 24 )216435.3194444441315.74572190266164.496312502893
Winsorized Mean ( 21 / 24 )216330.3194444441298.82890489422166.557980523279
Winsorized Mean ( 22 / 24 )216909.6527777781219.52074002536177.864669011916
Winsorized Mean ( 23 / 24 )216968.751199.56664151902180.872610566471
Winsorized Mean ( 24 / 24 )216951.4166666671090.88061901443198.877322490772
Trimmed Mean ( 1 / 24 )215991.92065.42938393466104.574817071951
Trimmed Mean ( 2 / 24 )216016.1323529412013.46899399362107.285551949069
Trimmed Mean ( 3 / 24 )216018.1969696971974.60230278952109.398331332101
Trimmed Mean ( 4 / 24 )215999.3906251933.16669048045111.733453555067
Trimmed Mean ( 5 / 24 )216026.6935483871897.42830140102113.852361846231
Trimmed Mean ( 6 / 24 )216049.0166666671861.740138932116.046816711276
Trimmed Mean ( 7 / 24 )216061.6034482761831.50848705009117.969206790996
Trimmed Mean ( 8 / 24 )216079.251796.21407776171120.297047370467
Trimmed Mean ( 9 / 24 )216124.3518518521762.21945934417122.643267106064
Trimmed Mean ( 10 / 24 )216169.8076923081725.28027190374125.295472980617
Trimmed Mean ( 11 / 24 )216168.661696.97765083596127.384506150397
Trimmed Mean ( 12 / 24 )216176.9791666671663.01869727636129.990708775983
Trimmed Mean ( 13 / 24 )216185.5869565221620.98290650003133.366975117154
Trimmed Mean ( 14 / 24 )216147.3863636361584.43091210655136.419571665805
Trimmed Mean ( 15 / 24 )216160.9047619051552.58835056369139.226153979208
Trimmed Mean ( 16 / 24 )216205.5251534.39491080089140.906049334555
Trimmed Mean ( 17 / 24 )216263.2105263161513.83210534833142.858121295132
Trimmed Mean ( 18 / 24 )216284.8611111111499.30986195225144.25627857172
Trimmed Mean ( 19 / 24 )216304.7647058821478.90602848966146.25997902435
Trimmed Mean ( 20 / 24 )216303.218751456.13757750624148.545866881917
Trimmed Mean ( 21 / 24 )216287.3666666671424.73265932118151.80908870982
Trimmed Mean ( 22 / 24 )216282.1071428571379.85063348859156.743129940119
Trimmed Mean ( 23 / 24 )216203.1153846151334.63521760923161.994163297973
Trimmed Mean ( 24 / 24 )216103.251267.09615418455170.550000713304
Median214798
Midrange215462.5
Midmean - Weighted Average at Xnp215896.621621622
Midmean - Weighted Average at X(n+1)p216284.861111111
Midmean - Empirical Distribution Function215896.621621622
Midmean - Empirical Distribution Function - Averaging216284.861111111
Midmean - Empirical Distribution Function - Interpolation216284.861111111
Midmean - Closest Observation215896.621621622
Midmean - True Basic - Statistics Graphics Toolkit216284.861111111
Midmean - MS Excel (old versions)216263.210526316
Number of observations72


Parameters (Session):
Parameters (R input):
R code (references can be found in the software module):
geomean <- function(x) {
return(exp(mean(log(x))))
}
harmean <- function(x) {
return(1/mean(1/x))
}
quamean <- function(x) {
return(sqrt(mean(x*x)))
}
winmean <- function(x) {
x <-sort(x[!is.na(x)])
n<-length(x)
denom <- 3
nodenom <- n/denom
if (nodenom>40) denom <- n/40
sqrtn = sqrt(n)
roundnodenom = floor(nodenom)
win <- array(NA,dim=c(roundnodenom,2))
for (j in 1:roundnodenom) {
win[j,1] <- (j*x[j+1]+sum(x[(j+1):(n-j)])+j*x[n-j])/n
win[j,2] <- sd(c(rep(x[j+1],j),x[(j+1):(n-j)],rep(x[n-j],j)))/sqrtn
}
return(win)
}
trimean <- function(x) {
x <-sort(x[!is.na(x)])
n<-length(x)
denom <- 3
nodenom <- n/denom
if (nodenom>40) denom <- n/40
sqrtn = sqrt(n)
roundnodenom = floor(nodenom)
tri <- array(NA,dim=c(roundnodenom,2))
for (j in 1:roundnodenom) {
tri[j,1] <- mean(x,trim=j/n)
tri[j,2] <- sd(x[(j+1):(n-j)]) / sqrt(n-j*2)
}
return(tri)
}
midrange <- function(x) {
return((max(x)+min(x))/2)
}
q1 <- function(data,n,p,i,f) {
np <- n*p;
i <<- floor(np)
f <<- np - i
qvalue <- (1-f)*data[i] + f*data[i+1]
}
q2 <- function(data,n,p,i,f) {
np <- (n+1)*p
i <<- floor(np)
f <<- np - i
qvalue <- (1-f)*data[i] + f*data[i+1]
}
q3 <- function(data,n,p,i,f) {
np <- n*p
i <<- floor(np)
f <<- np - i
if (f==0) {
qvalue <- data[i]
} else {
qvalue <- data[i+1]
}
}
q4 <- function(data,n,p,i,f) {
np <- n*p
i <<- floor(np)
f <<- np - i
if (f==0) {
qvalue <- (data[i]+data[i+1])/2
} else {
qvalue <- data[i+1]
}
}
q5 <- function(data,n,p,i,f) {
np <- (n-1)*p
i <<- floor(np)
f <<- np - i
if (f==0) {
qvalue <- data[i+1]
} else {
qvalue <- data[i+1] + f*(data[i+2]-data[i+1])
}
}
q6 <- function(data,n,p,i,f) {
np <- n*p+0.5
i <<- floor(np)
f <<- np - i
qvalue <- data[i]
}
q7 <- function(data,n,p,i,f) {
np <- (n+1)*p
i <<- floor(np)
f <<- np - i
if (f==0) {
qvalue <- data[i]
} else {
qvalue <- f*data[i] + (1-f)*data[i+1]
}
}
q8 <- function(data,n,p,i,f) {
np <- (n+1)*p
i <<- floor(np)
f <<- np - i
if (f==0) {
qvalue <- data[i]
} else {
if (f == 0.5) {
qvalue <- (data[i]+data[i+1])/2
} else {
if (f < 0.5) {
qvalue <- data[i]
} else {
qvalue <- data[i+1]
}
}
}
}
midmean <- function(x,def) {
x <-sort(x[!is.na(x)])
n<-length(x)
if (def==1) {
qvalue1 <- q1(x,n,0.25,i,f)
qvalue3 <- q1(x,n,0.75,i,f)
}
if (def==2) {
qvalue1 <- q2(x,n,0.25,i,f)
qvalue3 <- q2(x,n,0.75,i,f)
}
if (def==3) {
qvalue1 <- q3(x,n,0.25,i,f)
qvalue3 <- q3(x,n,0.75,i,f)
}
if (def==4) {
qvalue1 <- q4(x,n,0.25,i,f)
qvalue3 <- q4(x,n,0.75,i,f)
}
if (def==5) {
qvalue1 <- q5(x,n,0.25,i,f)
qvalue3 <- q5(x,n,0.75,i,f)
}
if (def==6) {
qvalue1 <- q6(x,n,0.25,i,f)
qvalue3 <- q6(x,n,0.75,i,f)
}
if (def==7) {
qvalue1 <- q7(x,n,0.25,i,f)
qvalue3 <- q7(x,n,0.75,i,f)
}
if (def==8) {
qvalue1 <- q8(x,n,0.25,i,f)
qvalue3 <- q8(x,n,0.75,i,f)
}
midm <- 0
myn <- 0
roundno4 <- round(n/4)
round3no4 <- round(3*n/4)
for (i in 1:n) {
if ((x[i]>=qvalue1) & (x[i]<=qvalue3)){
midm = midm + x[i]
myn = myn + 1
}
}
midm = midm / myn
return(midm)
}
(arm <- mean(x))
sqrtn <- sqrt(length(x))
(armse <- sd(x) / sqrtn)
(armose <- arm / armse)
(geo <- geomean(x))
(har <- harmean(x))
(qua <- quamean(x))
(win <- winmean(x))
(tri <- trimean(x))
(midr <- midrange(x))
midm <- array(NA,dim=8)
for (j in 1:8) midm[j] <- midmean(x,j)
midm
bitmap(file='test1.png')
lb <- win[,1] - 2*win[,2]
ub <- win[,1] + 2*win[,2]
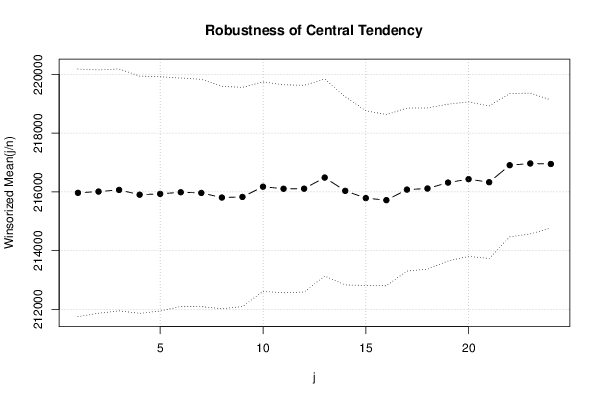
if ((ylimmin == '') | (ylimmax == '')) plot(win[,1],type='b',main=main, xlab='j', pch=19, ylab='Winsorized Mean(j/n)', ylim=c(min(lb),max(ub))) else plot(win[,1],type='l',main=main, xlab='j', pch=19, ylab='Winsorized Mean(j/n)', ylim=c(ylimmin,ylimmax))
lines(ub,lty=3)
lines(lb,lty=3)
grid()
dev.off()
bitmap(file='test2.png')
lb <- tri[,1] - 2*tri[,2]
ub <- tri[,1] + 2*tri[,2]
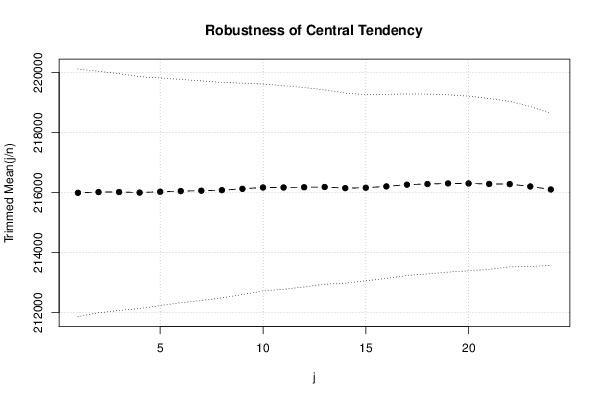
if ((ylimmin == '') | (ylimmax == '')) plot(tri[,1],type='b',main=main, xlab='j', pch=19, ylab='Trimmed Mean(j/n)', ylim=c(min(lb),max(ub))) else plot(tri[,1],type='l',main=main, xlab='j', pch=19, ylab='Trimmed Mean(j/n)', ylim=c(ylimmin,ylimmax))
lines(ub,lty=3)
lines(lb,lty=3)
grid()
dev.off()
load(file='createtable')
a<-table.start()
a<-table.row.start(a)
a<-table.element(a,'Central Tendency - Ungrouped Data',4,TRUE)
a<-table.row.end(a)
a<-table.row.start(a)
a<-table.element(a,'Measure',header=TRUE)
a<-table.element(a,'Value',header=TRUE)
a<-table.element(a,'S.E.',header=TRUE)
a<-table.element(a,'Value/S.E.',header=TRUE)
a<-table.row.end(a)
a<-table.row.start(a)
a<-table.element(a,hyperlink('arithmetic_mean.htm', 'Arithmetic Mean', 'click to view the definition of the Arithmetic Mean'),header=TRUE)
a<-table.element(a,arm)
a<-table.element(a,hyperlink('arithmetic_mean_standard_error.htm', armse, 'click to view the definition of the Standard Error of the Arithmetic Mean'))
a<-table.element(a,armose)
a<-table.row.end(a)
a<-table.row.start(a)
a<-table.element(a,hyperlink('geometric_mean.htm', 'Geometric Mean', 'click to view the definition of the Geometric Mean'),header=TRUE)
a<-table.element(a,geo)
a<-table.element(a,'')
a<-table.row.end(a)
a<-table.row.start(a)
a<-table.element(a,hyperlink('harmonic_mean.htm', 'Harmonic Mean', 'click to view the definition of the Harmonic Mean'),header=TRUE)
a<-table.element(a,har)
a<-table.element(a,'')
a<-table.row.end(a)
a<-table.row.start(a)
a<-table.element(a,hyperlink('quadratic_mean.htm', 'Quadratic Mean', 'click to view the definition of the Quadratic Mean'),header=TRUE)
a<-table.element(a,qua)
a<-table.element(a,'')
a<-table.row.end(a)
for (j in 1:length(win[,1])) {
a<-table.row.start(a)
mylabel <- paste('Winsorized Mean (',j)
mylabel <- paste(mylabel,'/')
mylabel <- paste(mylabel,length(win[,1]))
mylabel <- paste(mylabel,')')
a<-table.element(a,hyperlink('winsorized_mean.htm', mylabel, 'click to view the definition of the Winsorized Mean'),header=TRUE)
a<-table.element(a,win[j,1])
a<-table.element(a,win[j,2])
a<-table.element(a,win[j,1]/win[j,2])
a<-table.row.end(a)
}
for (j in 1:length(tri[,1])) {
a<-table.row.start(a)
mylabel <- paste('Trimmed Mean (',j)
mylabel <- paste(mylabel,'/')
mylabel <- paste(mylabel,length(tri[,1]))
mylabel <- paste(mylabel,')')
a<-table.element(a,hyperlink('arithmetic_mean.htm', mylabel, 'click to view the definition of the Trimmed Mean'),header=TRUE)
a<-table.element(a,tri[j,1])
a<-table.element(a,tri[j,2])
a<-table.element(a,tri[j,1]/tri[j,2])
a<-table.row.end(a)
}
a<-table.row.start(a)
a<-table.element(a,hyperlink('median_1.htm', 'Median', 'click to view the definition of the Median'),header=TRUE)
a<-table.element(a,median(x))
a<-table.element(a,'')
a<-table.row.end(a)
a<-table.row.start(a)
a<-table.element(a,hyperlink('midrange.htm', 'Midrange', 'click to view the definition of the Midrange'),header=TRUE)
a<-table.element(a,midr)
a<-table.element(a,'')
a<-table.row.end(a)
a<-table.row.start(a)
mymid <- hyperlink('midmean.htm', 'Midmean', 'click to view the definition of the Midmean')
mylabel <- paste(mymid,hyperlink('method_1.htm','Weighted Average at Xnp',''),sep=' - ')
a<-table.element(a,mylabel,header=TRUE)
a<-table.element(a,midm[1])
a<-table.element(a,'')
a<-table.row.end(a)
a<-table.row.start(a)
mymid <- hyperlink('midmean.htm', 'Midmean', 'click to view the definition of the Midmean')
mylabel <- paste(mymid,hyperlink('method_2.htm','Weighted Average at X(n+1)p',''),sep=' - ')
a<-table.element(a,mylabel,header=TRUE)
a<-table.element(a,midm[2])
a<-table.element(a,'')
a<-table.row.end(a)
a<-table.row.start(a)
mymid <- hyperlink('midmean.htm', 'Midmean', 'click to view the definition of the Midmean')
mylabel <- paste(mymid,hyperlink('method_3.htm','Empirical Distribution Function',''),sep=' - ')
a<-table.element(a,mylabel,header=TRUE)
a<-table.element(a,midm[3])
a<-table.element(a,'')
a<-table.row.end(a)
a<-table.row.start(a)
mymid <- hyperlink('midmean.htm', 'Midmean', 'click to view the definition of the Midmean')
mylabel <- paste(mymid,hyperlink('method_4.htm','Empirical Distribution Function - Averaging',''),sep=' - ')
a<-table.element(a,mylabel,header=TRUE)
a<-table.element(a,midm[4])
a<-table.element(a,'')
a<-table.row.end(a)
a<-table.row.start(a)
mymid <- hyperlink('midmean.htm', 'Midmean', 'click to view the definition of the Midmean')
mylabel <- paste(mymid,hyperlink('method_5.htm','Empirical Distribution Function - Interpolation',''),sep=' - ')
a<-table.element(a,mylabel,header=TRUE)
a<-table.element(a,midm[5])
a<-table.element(a,'')
a<-table.row.end(a)
a<-table.row.start(a)
mymid <- hyperlink('midmean.htm', 'Midmean', 'click to view the definition of the Midmean')
mylabel <- paste(mymid,hyperlink('method_6.htm','Closest Observation',''),sep=' - ')
a<-table.element(a,mylabel,header=TRUE)
a<-table.element(a,midm[6])
a<-table.element(a,'')
a<-table.row.end(a)
a<-table.row.start(a)
mymid <- hyperlink('midmean.htm', 'Midmean', 'click to view the definition of the Midmean')
mylabel <- paste(mymid,hyperlink('method_7.htm','True Basic - Statistics Graphics Toolkit',''),sep=' - ')
a<-table.element(a,mylabel,header=TRUE)
a<-table.element(a,midm[7])
a<-table.element(a,'')
a<-table.row.end(a)
a<-table.row.start(a)
mymid <- hyperlink('midmean.htm', 'Midmean', 'click to view the definition of the Midmean')
mylabel <- paste(mymid,hyperlink('method_8.htm','MS Excel (old versions)',''),sep=' - ')
a<-table.element(a,mylabel,header=TRUE)
a<-table.element(a,midm[8])
a<-table.element(a,'')
a<-table.row.end(a)
a<-table.row.start(a)
a<-table.element(a,'Number of observations',header=TRUE)
a<-table.element(a,length(x))
a<-table.element(a,'')
a<-table.row.end(a)
a<-table.end(a)
table.save(a,file='mytable.tab')