Free Statistics

of Irreproducible Research!

Author's title

Author*The author of this computation has been verified*
R Software Modulerwasp_arimabackwardselection.wasp
Title produced by softwareARIMA Backward Selection
Date of computationFri, 22 Jan 2016 08:56:54 +0000
Cite this page as followsStatistical Computations at FreeStatistics.org, Office for Research Development and Education, URL https://freestatistics.org/blog/index.php?v=date/2016/Jan/22/t1453453036u5m5ilgk8vc4nmj.htm/, Retrieved Fri, 17 May 2024 04:57:25 +0000
Statistical Computations at FreeStatistics.org, Office for Research Development and Education, URL https://freestatistics.org/blog/index.php?pk=290549, Retrieved Fri, 17 May 2024 04:57:25 +0000
QR Codes:

Original text written by user:
IsPrivate?No (this computation is public)
User-defined keywords
Estimated Impact76
Family? (F = Feedback message, R = changed R code, M = changed R Module, P = changed Parameters, D = changed Data)
-       [ARIMA Backward Selection] [Vraag 11 Examen] [2016-01-22 08:56:54] [3a4cd207302ddc21a2854e230526b249] [Current]
Feedback Forum

Post a new message
Dataseries X:
3035
2552
2704
2554
2014
1655
1721
1524
1596
2074
2199
2512
2933
2889
2938
2497
1870
1726
1607
1545
1396
1787
2076
2837
2787
3891
3179
2011
1636
1580
1489
1300
1356
1653
2013
2823
3102
2294
2385
2444
1748
1554
1498
1361
1346
1564
1640
2293
2815
3137
2679
1969
1870
1633
1529
1366
1357
1570
1535
2491
3084
2605
2573
2143
1693
1504
1461
1354
1333
1492
1781
1915


Summary of computational transaction
Raw Inputview raw input (R code)
Raw Outputview raw output of R engine
Computing time4 seconds
R Server'Sir Ronald Aylmer Fisher' @ fisher.wessa.net

\begin{tabular}{lllllllll}
\hline
Summary of computational transaction \tabularnewline
Raw Input & view raw input (R code)  \tabularnewline
Raw Output & view raw output of R engine  \tabularnewline
Computing time & 4 seconds \tabularnewline
R Server & 'Sir Ronald Aylmer Fisher' @ fisher.wessa.net \tabularnewline
\hline
\end{tabular}
%Source: https://freestatistics.org/blog/index.php?pk=290549&T=0

[TABLE]
[ROW][C]Summary of computational transaction[/C][/ROW]
[ROW][C]Raw Input[/C][C]view raw input (R code) [/C][/ROW]
[ROW][C]Raw Output[/C][C]view raw output of R engine [/C][/ROW]
[ROW][C]Computing time[/C][C]4 seconds[/C][/ROW]
[ROW][C]R Server[/C][C]'Sir Ronald Aylmer Fisher' @ fisher.wessa.net[/C][/ROW]
[/TABLE]
Source: https://freestatistics.org/blog/index.php?pk=290549&T=0

Globally Unique Identifier (entire table): ba.freestatistics.org/blog/index.php?pk=290549&T=0

As an alternative you can also use a QR Code:  

The GUIDs for individual cells are displayed in the table below:

Summary of computational transaction
Raw Inputview raw input (R code)
Raw Outputview raw output of R engine
Computing time4 seconds
R Server'Sir Ronald Aylmer Fisher' @ fisher.wessa.net


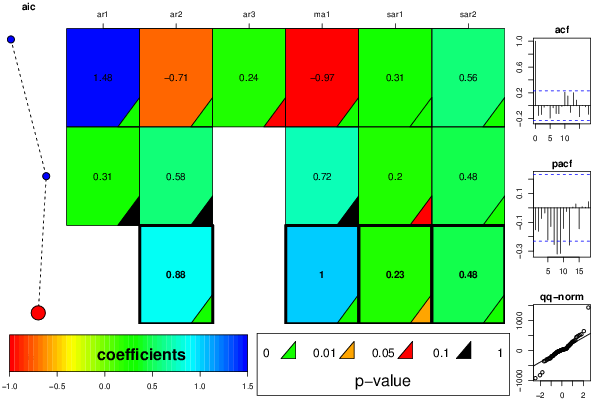
ARIMA Parameter Estimation and Backward Selection
Iterationar1ar2ar3ma1sar1sar2
Estimates ( 1 )1.4775-0.71430.2362-0.97090.30670.5573
(p-val)(0 )(0.0027 )(0.093 )(0 )(0.0025 )(0 )
Estimates ( 2 )0.30950.581900.72470.20490.4786
(p-val)(0.5782 )(0.2635 )(NA )(0.1341 )(0.0512 )(0 )
Estimates ( 3 )00.8773010.23220.4795
(p-val)(NA )(0 )(NA )(0 )(0.0166 )(0 )
Estimates ( 4 )NANANANANANA
(p-val)(NA )(NA )(NA )(NA )(NA )(NA )
Estimates ( 5 )NANANANANANA
(p-val)(NA )(NA )(NA )(NA )(NA )(NA )
Estimates ( 6 )NANANANANANA
(p-val)(NA )(NA )(NA )(NA )(NA )(NA )
Estimates ( 7 )NANANANANANA
(p-val)(NA )(NA )(NA )(NA )(NA )(NA )
Estimates ( 8 )NANANANANANA
(p-val)(NA )(NA )(NA )(NA )(NA )(NA )
Estimates ( 9 )NANANANANANA
(p-val)(NA )(NA )(NA )(NA )(NA )(NA )
Estimates ( 10 )NANANANANANA
(p-val)(NA )(NA )(NA )(NA )(NA )(NA )
Estimates ( 11 )NANANANANANA
(p-val)(NA )(NA )(NA )(NA )(NA )(NA )

\begin{tabular}{lllllllll}
\hline
ARIMA Parameter Estimation and Backward Selection \tabularnewline
Iteration & ar1 & ar2 & ar3 & ma1 & sar1 & sar2 \tabularnewline
Estimates ( 1 ) & 1.4775 & -0.7143 & 0.2362 & -0.9709 & 0.3067 & 0.5573 \tabularnewline
(p-val) & (0 ) & (0.0027 ) & (0.093 ) & (0 ) & (0.0025 ) & (0 ) \tabularnewline
Estimates ( 2 ) & 0.3095 & 0.5819 & 0 & 0.7247 & 0.2049 & 0.4786 \tabularnewline
(p-val) & (0.5782 ) & (0.2635 ) & (NA ) & (0.1341 ) & (0.0512 ) & (0 ) \tabularnewline
Estimates ( 3 ) & 0 & 0.8773 & 0 & 1 & 0.2322 & 0.4795 \tabularnewline
(p-val) & (NA ) & (0 ) & (NA ) & (0 ) & (0.0166 ) & (0 ) \tabularnewline
Estimates ( 4 ) & NA & NA & NA & NA & NA & NA \tabularnewline
(p-val) & (NA ) & (NA ) & (NA ) & (NA ) & (NA ) & (NA ) \tabularnewline
Estimates ( 5 ) & NA & NA & NA & NA & NA & NA \tabularnewline
(p-val) & (NA ) & (NA ) & (NA ) & (NA ) & (NA ) & (NA ) \tabularnewline
Estimates ( 6 ) & NA & NA & NA & NA & NA & NA \tabularnewline
(p-val) & (NA ) & (NA ) & (NA ) & (NA ) & (NA ) & (NA ) \tabularnewline
Estimates ( 7 ) & NA & NA & NA & NA & NA & NA \tabularnewline
(p-val) & (NA ) & (NA ) & (NA ) & (NA ) & (NA ) & (NA ) \tabularnewline
Estimates ( 8 ) & NA & NA & NA & NA & NA & NA \tabularnewline
(p-val) & (NA ) & (NA ) & (NA ) & (NA ) & (NA ) & (NA ) \tabularnewline
Estimates ( 9 ) & NA & NA & NA & NA & NA & NA \tabularnewline
(p-val) & (NA ) & (NA ) & (NA ) & (NA ) & (NA ) & (NA ) \tabularnewline
Estimates ( 10 ) & NA & NA & NA & NA & NA & NA \tabularnewline
(p-val) & (NA ) & (NA ) & (NA ) & (NA ) & (NA ) & (NA ) \tabularnewline
Estimates ( 11 ) & NA & NA & NA & NA & NA & NA \tabularnewline
(p-val) & (NA ) & (NA ) & (NA ) & (NA ) & (NA ) & (NA ) \tabularnewline
\hline
\end{tabular}
%Source: https://freestatistics.org/blog/index.php?pk=290549&T=1

[TABLE]
[ROW][C]ARIMA Parameter Estimation and Backward Selection[/C][/ROW]
[ROW][C]Iteration[/C][C]ar1[/C][C]ar2[/C][C]ar3[/C][C]ma1[/C][C]sar1[/C][C]sar2[/C][/ROW]
[ROW][C]Estimates ( 1 )[/C][C]1.4775[/C][C]-0.7143[/C][C]0.2362[/C][C]-0.9709[/C][C]0.3067[/C][C]0.5573[/C][/ROW]
[ROW][C](p-val)[/C][C](0 )[/C][C](0.0027 )[/C][C](0.093 )[/C][C](0 )[/C][C](0.0025 )[/C][C](0 )[/C][/ROW]
[ROW][C]Estimates ( 2 )[/C][C]0.3095[/C][C]0.5819[/C][C]0[/C][C]0.7247[/C][C]0.2049[/C][C]0.4786[/C][/ROW]
[ROW][C](p-val)[/C][C](0.5782 )[/C][C](0.2635 )[/C][C](NA )[/C][C](0.1341 )[/C][C](0.0512 )[/C][C](0 )[/C][/ROW]
[ROW][C]Estimates ( 3 )[/C][C]0[/C][C]0.8773[/C][C]0[/C][C]1[/C][C]0.2322[/C][C]0.4795[/C][/ROW]
[ROW][C](p-val)[/C][C](NA )[/C][C](0 )[/C][C](NA )[/C][C](0 )[/C][C](0.0166 )[/C][C](0 )[/C][/ROW]
[ROW][C]Estimates ( 4 )[/C][C]NA[/C][C]NA[/C][C]NA[/C][C]NA[/C][C]NA[/C][C]NA[/C][/ROW]
[ROW][C](p-val)[/C][C](NA )[/C][C](NA )[/C][C](NA )[/C][C](NA )[/C][C](NA )[/C][C](NA )[/C][/ROW]
[ROW][C]Estimates ( 5 )[/C][C]NA[/C][C]NA[/C][C]NA[/C][C]NA[/C][C]NA[/C][C]NA[/C][/ROW]
[ROW][C](p-val)[/C][C](NA )[/C][C](NA )[/C][C](NA )[/C][C](NA )[/C][C](NA )[/C][C](NA )[/C][/ROW]
[ROW][C]Estimates ( 6 )[/C][C]NA[/C][C]NA[/C][C]NA[/C][C]NA[/C][C]NA[/C][C]NA[/C][/ROW]
[ROW][C](p-val)[/C][C](NA )[/C][C](NA )[/C][C](NA )[/C][C](NA )[/C][C](NA )[/C][C](NA )[/C][/ROW]
[ROW][C]Estimates ( 7 )[/C][C]NA[/C][C]NA[/C][C]NA[/C][C]NA[/C][C]NA[/C][C]NA[/C][/ROW]
[ROW][C](p-val)[/C][C](NA )[/C][C](NA )[/C][C](NA )[/C][C](NA )[/C][C](NA )[/C][C](NA )[/C][/ROW]
[ROW][C]Estimates ( 8 )[/C][C]NA[/C][C]NA[/C][C]NA[/C][C]NA[/C][C]NA[/C][C]NA[/C][/ROW]
[ROW][C](p-val)[/C][C](NA )[/C][C](NA )[/C][C](NA )[/C][C](NA )[/C][C](NA )[/C][C](NA )[/C][/ROW]
[ROW][C]Estimates ( 9 )[/C][C]NA[/C][C]NA[/C][C]NA[/C][C]NA[/C][C]NA[/C][C]NA[/C][/ROW]
[ROW][C](p-val)[/C][C](NA )[/C][C](NA )[/C][C](NA )[/C][C](NA )[/C][C](NA )[/C][C](NA )[/C][/ROW]
[ROW][C]Estimates ( 10 )[/C][C]NA[/C][C]NA[/C][C]NA[/C][C]NA[/C][C]NA[/C][C]NA[/C][/ROW]
[ROW][C](p-val)[/C][C](NA )[/C][C](NA )[/C][C](NA )[/C][C](NA )[/C][C](NA )[/C][C](NA )[/C][/ROW]
[ROW][C]Estimates ( 11 )[/C][C]NA[/C][C]NA[/C][C]NA[/C][C]NA[/C][C]NA[/C][C]NA[/C][/ROW]
[ROW][C](p-val)[/C][C](NA )[/C][C](NA )[/C][C](NA )[/C][C](NA )[/C][C](NA )[/C][C](NA )[/C][/ROW]
[/TABLE]
Source: https://freestatistics.org/blog/index.php?pk=290549&T=1

Globally Unique Identifier (entire table): ba.freestatistics.org/blog/index.php?pk=290549&T=1

As an alternative you can also use a QR Code:  

The GUIDs for individual cells are displayed in the table below:

ARIMA Parameter Estimation and Backward Selection
Iterationar1ar2ar3ma1sar1sar2
Estimates ( 1 )1.4775-0.71430.2362-0.97090.30670.5573
(p-val)(0 )(0.0027 )(0.093 )(0 )(0.0025 )(0 )
Estimates ( 2 )0.30950.581900.72470.20490.4786
(p-val)(0.5782 )(0.2635 )(NA )(0.1341 )(0.0512 )(0 )
Estimates ( 3 )00.8773010.23220.4795
(p-val)(NA )(0 )(NA )(0 )(0.0166 )(0 )
Estimates ( 4 )NANANANANANA
(p-val)(NA )(NA )(NA )(NA )(NA )(NA )
Estimates ( 5 )NANANANANANA
(p-val)(NA )(NA )(NA )(NA )(NA )(NA )
Estimates ( 6 )NANANANANANA
(p-val)(NA )(NA )(NA )(NA )(NA )(NA )
Estimates ( 7 )NANANANANANA
(p-val)(NA )(NA )(NA )(NA )(NA )(NA )
Estimates ( 8 )NANANANANANA
(p-val)(NA )(NA )(NA )(NA )(NA )(NA )
Estimates ( 9 )NANANANANANA
(p-val)(NA )(NA )(NA )(NA )(NA )(NA )
Estimates ( 10 )NANANANANANA
(p-val)(NA )(NA )(NA )(NA )(NA )(NA )
Estimates ( 11 )NANANANANANA
(p-val)(NA )(NA )(NA )(NA )(NA )(NA )


Estimated ARIMA Residuals
Value
648.532001139026
-302.028093080209
219.460068879039
-95.9216969634532
-349.103311425507
-268.550937010232
54.6741880665198
-204.164207751421
46.5951345587332
310.058373947363
70.5872397761177
225.126641379274
340.064489038712
171.45599705878
52.9236275844564
-273.81080086068
-300.579883576349
13.6513645215052
-135.698227066481
15.7648732446527
-186.042885062147
162.828016995543
160.797280833935
543.141646578285
-191.107450149131
1439.33260269266
-827.319258012477
-729.776740514736
-14.7999150346233
194.288361034753
-107.266057315606
-24.9507461020583
50.0042616568939
15.4483122790332
254.834495784517
517.982588508638
118.724944878402
-925.685143427341
307.082487397562
446.546806178279
-255.469120846201
-57.9640152028238
39.3696422844093
-39.725562015111
72.2636008460322
-12.8054653140919
-104.029204946206
144.502391098888
494.313033545829
-22.7964291351503
-55.7575882723366
-129.170093990988
276.644801027725
-162.011608698714
29.8588984172965
-39.3152750928317
20.357207153204
39.3375894647931
-186.337918542332
465.519769327773
340.850415286882
-89.103528908554
84.5815999519871
-267.621710784922
-22.8422957382349
-35.9030111290754
49.6362557691956
5.72737834298367
25.0885369005195
30.4845373619605
289.926513328847
-359.268334377734

\begin{tabular}{lllllllll}
\hline
Estimated ARIMA Residuals \tabularnewline
Value \tabularnewline
 \tabularnewline
648.532001139026 \tabularnewline
-302.028093080209 \tabularnewline
219.460068879039 \tabularnewline
-95.9216969634532 \tabularnewline
-349.103311425507 \tabularnewline
-268.550937010232 \tabularnewline
54.6741880665198 \tabularnewline
-204.164207751421 \tabularnewline
46.5951345587332 \tabularnewline
310.058373947363 \tabularnewline
70.5872397761177 \tabularnewline
225.126641379274 \tabularnewline
340.064489038712 \tabularnewline
171.45599705878 \tabularnewline
52.9236275844564 \tabularnewline
-273.81080086068 \tabularnewline
-300.579883576349 \tabularnewline
13.6513645215052 \tabularnewline
-135.698227066481 \tabularnewline
15.7648732446527 \tabularnewline
-186.042885062147 \tabularnewline
162.828016995543 \tabularnewline
160.797280833935 \tabularnewline
543.141646578285 \tabularnewline
-191.107450149131 \tabularnewline
1439.33260269266 \tabularnewline
-827.319258012477 \tabularnewline
-729.776740514736 \tabularnewline
-14.7999150346233 \tabularnewline
194.288361034753 \tabularnewline
-107.266057315606 \tabularnewline
-24.9507461020583 \tabularnewline
50.0042616568939 \tabularnewline
15.4483122790332 \tabularnewline
254.834495784517 \tabularnewline
517.982588508638 \tabularnewline
118.724944878402 \tabularnewline
-925.685143427341 \tabularnewline
307.082487397562 \tabularnewline
446.546806178279 \tabularnewline
-255.469120846201 \tabularnewline
-57.9640152028238 \tabularnewline
39.3696422844093 \tabularnewline
-39.725562015111 \tabularnewline
72.2636008460322 \tabularnewline
-12.8054653140919 \tabularnewline
-104.029204946206 \tabularnewline
144.502391098888 \tabularnewline
494.313033545829 \tabularnewline
-22.7964291351503 \tabularnewline
-55.7575882723366 \tabularnewline
-129.170093990988 \tabularnewline
276.644801027725 \tabularnewline
-162.011608698714 \tabularnewline
29.8588984172965 \tabularnewline
-39.3152750928317 \tabularnewline
20.357207153204 \tabularnewline
39.3375894647931 \tabularnewline
-186.337918542332 \tabularnewline
465.519769327773 \tabularnewline
340.850415286882 \tabularnewline
-89.103528908554 \tabularnewline
84.5815999519871 \tabularnewline
-267.621710784922 \tabularnewline
-22.8422957382349 \tabularnewline
-35.9030111290754 \tabularnewline
49.6362557691956 \tabularnewline
5.72737834298367 \tabularnewline
25.0885369005195 \tabularnewline
30.4845373619605 \tabularnewline
289.926513328847 \tabularnewline
-359.268334377734 \tabularnewline
\hline
\end{tabular}
%Source: https://freestatistics.org/blog/index.php?pk=290549&T=2

[TABLE]
[ROW][C]Estimated ARIMA Residuals[/C][/ROW]
[ROW][C]Value[/C][/ROW]
[ROW][C][/C][/ROW]
[ROW][C]648.532001139026[/C][/ROW]
[ROW][C]-302.028093080209[/C][/ROW]
[ROW][C]219.460068879039[/C][/ROW]
[ROW][C]-95.9216969634532[/C][/ROW]
[ROW][C]-349.103311425507[/C][/ROW]
[ROW][C]-268.550937010232[/C][/ROW]
[ROW][C]54.6741880665198[/C][/ROW]
[ROW][C]-204.164207751421[/C][/ROW]
[ROW][C]46.5951345587332[/C][/ROW]
[ROW][C]310.058373947363[/C][/ROW]
[ROW][C]70.5872397761177[/C][/ROW]
[ROW][C]225.126641379274[/C][/ROW]
[ROW][C]340.064489038712[/C][/ROW]
[ROW][C]171.45599705878[/C][/ROW]
[ROW][C]52.9236275844564[/C][/ROW]
[ROW][C]-273.81080086068[/C][/ROW]
[ROW][C]-300.579883576349[/C][/ROW]
[ROW][C]13.6513645215052[/C][/ROW]
[ROW][C]-135.698227066481[/C][/ROW]
[ROW][C]15.7648732446527[/C][/ROW]
[ROW][C]-186.042885062147[/C][/ROW]
[ROW][C]162.828016995543[/C][/ROW]
[ROW][C]160.797280833935[/C][/ROW]
[ROW][C]543.141646578285[/C][/ROW]
[ROW][C]-191.107450149131[/C][/ROW]
[ROW][C]1439.33260269266[/C][/ROW]
[ROW][C]-827.319258012477[/C][/ROW]
[ROW][C]-729.776740514736[/C][/ROW]
[ROW][C]-14.7999150346233[/C][/ROW]
[ROW][C]194.288361034753[/C][/ROW]
[ROW][C]-107.266057315606[/C][/ROW]
[ROW][C]-24.9507461020583[/C][/ROW]
[ROW][C]50.0042616568939[/C][/ROW]
[ROW][C]15.4483122790332[/C][/ROW]
[ROW][C]254.834495784517[/C][/ROW]
[ROW][C]517.982588508638[/C][/ROW]
[ROW][C]118.724944878402[/C][/ROW]
[ROW][C]-925.685143427341[/C][/ROW]
[ROW][C]307.082487397562[/C][/ROW]
[ROW][C]446.546806178279[/C][/ROW]
[ROW][C]-255.469120846201[/C][/ROW]
[ROW][C]-57.9640152028238[/C][/ROW]
[ROW][C]39.3696422844093[/C][/ROW]
[ROW][C]-39.725562015111[/C][/ROW]
[ROW][C]72.2636008460322[/C][/ROW]
[ROW][C]-12.8054653140919[/C][/ROW]
[ROW][C]-104.029204946206[/C][/ROW]
[ROW][C]144.502391098888[/C][/ROW]
[ROW][C]494.313033545829[/C][/ROW]
[ROW][C]-22.7964291351503[/C][/ROW]
[ROW][C]-55.7575882723366[/C][/ROW]
[ROW][C]-129.170093990988[/C][/ROW]
[ROW][C]276.644801027725[/C][/ROW]
[ROW][C]-162.011608698714[/C][/ROW]
[ROW][C]29.8588984172965[/C][/ROW]
[ROW][C]-39.3152750928317[/C][/ROW]
[ROW][C]20.357207153204[/C][/ROW]
[ROW][C]39.3375894647931[/C][/ROW]
[ROW][C]-186.337918542332[/C][/ROW]
[ROW][C]465.519769327773[/C][/ROW]
[ROW][C]340.850415286882[/C][/ROW]
[ROW][C]-89.103528908554[/C][/ROW]
[ROW][C]84.5815999519871[/C][/ROW]
[ROW][C]-267.621710784922[/C][/ROW]
[ROW][C]-22.8422957382349[/C][/ROW]
[ROW][C]-35.9030111290754[/C][/ROW]
[ROW][C]49.6362557691956[/C][/ROW]
[ROW][C]5.72737834298367[/C][/ROW]
[ROW][C]25.0885369005195[/C][/ROW]
[ROW][C]30.4845373619605[/C][/ROW]
[ROW][C]289.926513328847[/C][/ROW]
[ROW][C]-359.268334377734[/C][/ROW]
[/TABLE]
Source: https://freestatistics.org/blog/index.php?pk=290549&T=2

Globally Unique Identifier (entire table): ba.freestatistics.org/blog/index.php?pk=290549&T=2

As an alternative you can also use a QR Code:  

The GUIDs for individual cells are displayed in the table below:

Estimated ARIMA Residuals
Value
648.532001139026
-302.028093080209
219.460068879039
-95.9216969634532
-349.103311425507
-268.550937010232
54.6741880665198
-204.164207751421
46.5951345587332
310.058373947363
70.5872397761177
225.126641379274
340.064489038712
171.45599705878
52.9236275844564
-273.81080086068
-300.579883576349
13.6513645215052
-135.698227066481
15.7648732446527
-186.042885062147
162.828016995543
160.797280833935
543.141646578285
-191.107450149131
1439.33260269266
-827.319258012477
-729.776740514736
-14.7999150346233
194.288361034753
-107.266057315606
-24.9507461020583
50.0042616568939
15.4483122790332
254.834495784517
517.982588508638
118.724944878402
-925.685143427341
307.082487397562
446.546806178279
-255.469120846201
-57.9640152028238
39.3696422844093
-39.725562015111
72.2636008460322
-12.8054653140919
-104.029204946206
144.502391098888
494.313033545829
-22.7964291351503
-55.7575882723366
-129.170093990988
276.644801027725
-162.011608698714
29.8588984172965
-39.3152750928317
20.357207153204
39.3375894647931
-186.337918542332
465.519769327773
340.850415286882
-89.103528908554
84.5815999519871
-267.621710784922
-22.8422957382349
-35.9030111290754
49.6362557691956
5.72737834298367
25.0885369005195
30.4845373619605
289.926513328847
-359.268334377734


Parameters (Session):
par1 = 1 ; par2 = 2 ; par3 = 3 ; par4 = TRUE ;
Parameters (R input):
par1 = TRUE ; par2 = 1 ; par3 = 0 ; par4 = 0 ; par5 = 12 ; par6 = 3 ; par7 = 1 ; par8 = 2 ; par9 = 0 ;
R code (references can be found in the software module):
par9 <- '0'
par8 <- '0'
par7 <- '0'
par6 <- '0'
par5 <- '1'
par4 <- '0'
par3 <- '0'
par2 <- '1'
par1 <- 'TRUE'
library(lattice)
if (par1 == 'TRUE') par1 <- TRUE
if (par1 == 'FALSE') par1 <- FALSE
par2 <- as.numeric(par2) #Box-Cox lambda transformation parameter
par3 <- as.numeric(par3) #degree of non-seasonal differencing
par4 <- as.numeric(par4) #degree of seasonal differencing
par5 <- as.numeric(par5) #seasonal period
par6 <- as.numeric(par6) #degree (p) of the non-seasonal AR(p) polynomial
par7 <- as.numeric(par7) #degree (q) of the non-seasonal MA(q) polynomial
par8 <- as.numeric(par8) #degree (P) of the seasonal AR(P) polynomial
par9 <- as.numeric(par9) #degree (Q) of the seasonal MA(Q) polynomial
armaGR <- function(arima.out, names, n){
try1 <- arima.out$coef
try2 <- sqrt(diag(arima.out$var.coef))
try.data.frame <- data.frame(matrix(NA,ncol=4,nrow=length(names)))
dimnames(try.data.frame) <- list(names,c('coef','std','tstat','pv'))
try.data.frame[,1] <- try1
for(i in 1:length(try2)) try.data.frame[which(rownames(try.data.frame)==names(try2)[i]),2] <- try2[i]
try.data.frame[,3] <- try.data.frame[,1] / try.data.frame[,2]
try.data.frame[,4] <- round((1-pt(abs(try.data.frame[,3]),df=n-(length(try2)+1)))*2,5)
vector <- rep(NA,length(names))
vector[is.na(try.data.frame[,4])] <- 0
maxi <- which.max(try.data.frame[,4])
continue <- max(try.data.frame[,4],na.rm=TRUE) > .05
vector[maxi] <- 0
list(summary=try.data.frame,next.vector=vector,continue=continue)
}
arimaSelect <- function(series, order=c(13,0,0), seasonal=list(order=c(2,0,0),period=12), include.mean=F){
nrc <- order[1]+order[3]+seasonal$order[1]+seasonal$order[3]
coeff <- matrix(NA, nrow=nrc*2, ncol=nrc)
pval <- matrix(NA, nrow=nrc*2, ncol=nrc)
mylist <- rep(list(NULL), nrc)
names <- NULL
if(order[1] > 0) names <- paste('ar',1:order[1],sep='')
if(order[3] > 0) names <- c( names , paste('ma',1:order[3],sep='') )
if(seasonal$order[1] > 0) names <- c(names, paste('sar',1:seasonal$order[1],sep=''))
if(seasonal$order[3] > 0) names <- c(names, paste('sma',1:seasonal$order[3],sep=''))
arima.out <- arima(series, order=order, seasonal=seasonal, include.mean=include.mean, method='ML')
mylist[[1]] <- arima.out
last.arma <- armaGR(arima.out, names, length(series))
mystop <- FALSE
i <- 1
coeff[i,] <- last.arma[[1]][,1]
pval [i,] <- last.arma[[1]][,4]
i <- 2
aic <- arima.out$aic
while(!mystop){
mylist[[i]] <- arima.out
arima.out <- arima(series, order=order, seasonal=seasonal, include.mean=include.mean, method='ML', fixed=last.arma$next.vector)
aic <- c(aic, arima.out$aic)
last.arma <- armaGR(arima.out, names, length(series))
mystop <- !last.arma$continue
coeff[i,] <- last.arma[[1]][,1]
pval [i,] <- last.arma[[1]][,4]
i <- i+1
}
list(coeff, pval, mylist, aic=aic)
}
arimaSelectplot <- function(arimaSelect.out,noms,choix){
noms <- names(arimaSelect.out[[3]][[1]]$coef)
coeff <- arimaSelect.out[[1]]
k <- min(which(is.na(coeff[,1])))-1
coeff <- coeff[1:k,]
pval <- arimaSelect.out[[2]][1:k,]
aic <- arimaSelect.out$aic[1:k]
coeff[coeff==0] <- NA
n <- ncol(coeff)
if(missing(choix)) choix <- k
layout(matrix(c(1,1,1,2,
3,3,3,2,
3,3,3,4,
5,6,7,7),nr=4),
widths=c(10,35,45,15),
heights=c(30,30,15,15))
couleurs <- rainbow(75)[1:50]#(50)
ticks <- pretty(coeff)
par(mar=c(1,1,3,1))
plot(aic,k:1-.5,type='o',pch=21,bg='blue',cex=2,axes=F,lty=2,xpd=NA)
points(aic[choix],k-choix+.5,pch=21,cex=4,bg=2,xpd=NA)
title('aic',line=2)
par(mar=c(3,0,0,0))
plot(0,axes=F,xlab='',ylab='',xlim=range(ticks),ylim=c(.1,1))
rect(xleft = min(ticks) + (0:49)/50*(max(ticks)-min(ticks)),
xright = min(ticks) + (1:50)/50*(max(ticks)-min(ticks)),
ytop = rep(1,50),
ybottom= rep(0,50),col=couleurs,border=NA)
axis(1,ticks)
rect(xleft=min(ticks),xright=max(ticks),ytop=1,ybottom=0)
text(mean(coeff,na.rm=T),.5,'coefficients',cex=2,font=2)
par(mar=c(1,1,3,1))
image(1:n,1:k,t(coeff[k:1,]),axes=F,col=couleurs,zlim=range(ticks))
for(i in 1:n) for(j in 1:k) if(!is.na(coeff[j,i])) {
if(pval[j,i]<.01) symb = 'green'
else if( (pval[j,i]<.05) & (pval[j,i]>=.01)) symb = 'orange'
else if( (pval[j,i]<.1) & (pval[j,i]>=.05)) symb = 'red'
else symb = 'black'
polygon(c(i+.5 ,i+.2 ,i+.5 ,i+.5),
c(k-j+0.5,k-j+0.5,k-j+0.8,k-j+0.5),
col=symb)
if(j==choix) {
rect(xleft=i-.5,
xright=i+.5,
ybottom=k-j+1.5,
ytop=k-j+.5,
lwd=4)
text(i,
k-j+1,
round(coeff[j,i],2),
cex=1.2,
font=2)
}
else{
rect(xleft=i-.5,xright=i+.5,ybottom=k-j+1.5,ytop=k-j+.5)
text(i,k-j+1,round(coeff[j,i],2),cex=1.2,font=1)
}
}
axis(3,1:n,noms)
par(mar=c(0.5,0,0,0.5))
plot(0,axes=F,xlab='',ylab='',type='n',xlim=c(0,8),ylim=c(-.2,.8))
cols <- c('green','orange','red','black')
niv <- c('0','0.01','0.05','0.1')
for(i in 0:3){
polygon(c(1+2*i ,1+2*i ,1+2*i-.5 ,1+2*i),
c(.4 ,.7 , .4 , .4),
col=cols[i+1])
text(2*i,0.5,niv[i+1],cex=1.5)
}
text(8,.5,1,cex=1.5)
text(4,0,'p-value',cex=2)
box()
residus <- arimaSelect.out[[3]][[choix]]$res
par(mar=c(1,2,4,1))
acf(residus,main='')
title('acf',line=.5)
par(mar=c(1,2,4,1))
pacf(residus,main='')
title('pacf',line=.5)
par(mar=c(2,2,4,1))
qqnorm(residus,main='')
title('qq-norm',line=.5)
qqline(residus)
residus
}
if (par2 == 0) x <- log(x)
if (par2 != 0) x <- x^par2
(selection <- arimaSelect(x, order=c(par6,par3,par7), seasonal=list(order=c(par8,par4,par9), period=par5)))
bitmap(file='test1.png')
resid <- arimaSelectplot(selection)
dev.off()
resid
bitmap(file='test2.png')
acf(resid,length(resid)/2, main='Residual Autocorrelation Function')
dev.off()
bitmap(file='test3.png')
pacf(resid,length(resid)/2, main='Residual Partial Autocorrelation Function')
dev.off()
bitmap(file='test4.png')
cpgram(resid, main='Residual Cumulative Periodogram')
dev.off()
bitmap(file='test5.png')
hist(resid, main='Residual Histogram', xlab='values of Residuals')
dev.off()
bitmap(file='test6.png')
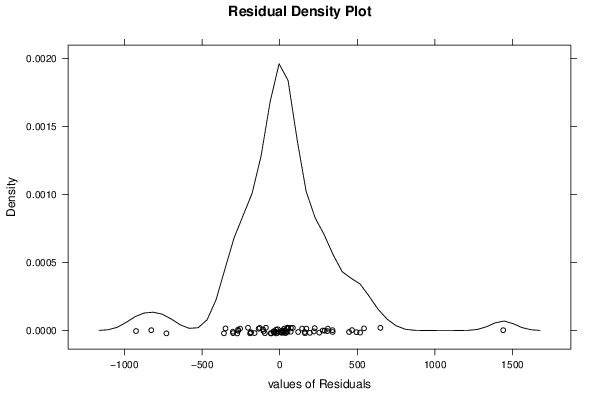
densityplot(~resid,col='black',main='Residual Density Plot', xlab='values of Residuals')
dev.off()
bitmap(file='test7.png')
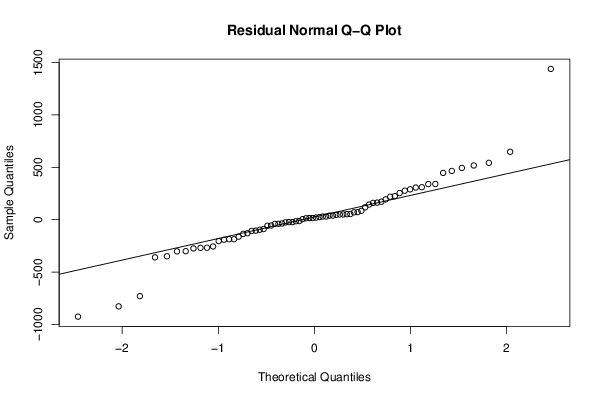
qqnorm(resid, main='Residual Normal Q-Q Plot')
qqline(resid)
dev.off()
ncols <- length(selection[[1]][1,])
nrows <- length(selection[[2]][,1])-1
load(file='createtable')
a<-table.start()
a<-table.row.start(a)
a<-table.element(a,'ARIMA Parameter Estimation and Backward Selection', ncols+1,TRUE)
a<-table.row.end(a)
a<-table.row.start(a)
a<-table.element(a,'Iteration', header=TRUE)
for (i in 1:ncols) {
a<-table.element(a,names(selection[[3]][[1]]$coef)[i],header=TRUE)
}
a<-table.row.end(a)
for (j in 1:nrows) {
a<-table.row.start(a)
mydum <- 'Estimates ('
mydum <- paste(mydum,j)
mydum <- paste(mydum,')')
a<-table.element(a,mydum, header=TRUE)
for (i in 1:ncols) {
a<-table.element(a,round(selection[[1]][j,i],4))
}
a<-table.row.end(a)
a<-table.row.start(a)
a<-table.element(a,'(p-val)', header=TRUE)
for (i in 1:ncols) {
mydum <- '('
mydum <- paste(mydum,round(selection[[2]][j,i],4),sep='')
mydum <- paste(mydum,')')
a<-table.element(a,mydum)
}
a<-table.row.end(a)
}
a<-table.end(a)
table.save(a,file='mytable.tab')
a<-table.start()
a<-table.row.start(a)
a<-table.element(a,'Estimated ARIMA Residuals', 1,TRUE)
a<-table.row.end(a)
a<-table.row.start(a)
a<-table.element(a,'Value', 1,TRUE)
a<-table.row.end(a)
for (i in (par4*par5+par3):length(resid)) {
a<-table.row.start(a)
a<-table.element(a,resid[i])
a<-table.row.end(a)
}
a<-table.end(a)
table.save(a,file='mytable1.tab')