Free Statistics

of Irreproducible Research!

Author's title

Author*The author of this computation has been verified*
R Software Modulerwasp_exponentialsmoothing.wasp
Title produced by softwareExponential Smoothing
Date of computationFri, 22 Jan 2016 08:23:50 +0000
Cite this page as followsStatistical Computations at FreeStatistics.org, Office for Research Development and Education, URL https://freestatistics.org/blog/index.php?v=date/2016/Jan/22/t1453451138jiqzxiv0udillnm.htm/, Retrieved Fri, 17 May 2024 06:26:54 +0000
Statistical Computations at FreeStatistics.org, Office for Research Development and Education, URL https://freestatistics.org/blog/index.php?pk=290192, Retrieved Fri, 17 May 2024 06:26:54 +0000
QR Codes:

Original text written by user:
IsPrivate?No (this computation is public)
User-defined keywords
Estimated Impact78
Family? (F = Feedback message, R = changed R code, M = changed R Module, P = changed Parameters, D = changed Data)
-       [Exponential Smoothing] [vraag 6] [2016-01-22 08:23:50] [7a1b228211171c106fd09cb69827bfa3] [Current]
Feedback Forum

Post a new message
Dataseries X:
1
0
0
0
0
1
0
0
1
0
0
0
0
1
0
0
0
1
1
0


Summary of computational transaction
Raw Inputview raw input (R code)
Raw Outputview raw output of R engine
Computing time1 seconds
R Server'Sir Ronald Aylmer Fisher' @ fisher.wessa.net

\begin{tabular}{lllllllll}
\hline
Summary of computational transaction \tabularnewline
Raw Input & view raw input (R code)  \tabularnewline
Raw Output & view raw output of R engine  \tabularnewline
Computing time & 1 seconds \tabularnewline
R Server & 'Sir Ronald Aylmer Fisher' @ fisher.wessa.net \tabularnewline
\hline
\end{tabular}
%Source: https://freestatistics.org/blog/index.php?pk=290192&T=0

[TABLE]
[ROW][C]Summary of computational transaction[/C][/ROW]
[ROW][C]Raw Input[/C][C]view raw input (R code) [/C][/ROW]
[ROW][C]Raw Output[/C][C]view raw output of R engine [/C][/ROW]
[ROW][C]Computing time[/C][C]1 seconds[/C][/ROW]
[ROW][C]R Server[/C][C]'Sir Ronald Aylmer Fisher' @ fisher.wessa.net[/C][/ROW]
[/TABLE]
Source: https://freestatistics.org/blog/index.php?pk=290192&T=0

Globally Unique Identifier (entire table): ba.freestatistics.org/blog/index.php?pk=290192&T=0

As an alternative you can also use a QR Code:  

The GUIDs for individual cells are displayed in the table below:

Summary of computational transaction
Raw Inputview raw input (R code)
Raw Outputview raw output of R engine
Computing time1 seconds
R Server'Sir Ronald Aylmer Fisher' @ fisher.wessa.net


Estimated Parameters of Exponential Smoothing
ParameterValue
alpha0.266170781245585
betaFALSE
gammaFALSE

\begin{tabular}{lllllllll}
\hline
Estimated Parameters of Exponential Smoothing \tabularnewline
Parameter & Value \tabularnewline
alpha & 0.266170781245585 \tabularnewline
beta & FALSE \tabularnewline
gamma & FALSE \tabularnewline
\hline
\end{tabular}
%Source: https://freestatistics.org/blog/index.php?pk=290192&T=1

[TABLE]
[ROW][C]Estimated Parameters of Exponential Smoothing[/C][/ROW]
[ROW][C]Parameter[/C][C]Value[/C][/ROW]
[ROW][C]alpha[/C][C]0.266170781245585[/C][/ROW]
[ROW][C]beta[/C][C]FALSE[/C][/ROW]
[ROW][C]gamma[/C][C]FALSE[/C][/ROW]
[/TABLE]
Source: https://freestatistics.org/blog/index.php?pk=290192&T=1

Globally Unique Identifier (entire table): ba.freestatistics.org/blog/index.php?pk=290192&T=1

As an alternative you can also use a QR Code:  

The GUIDs for individual cells are displayed in the table below:

Estimated Parameters of Exponential Smoothing
ParameterValue
alpha0.266170781245585
betaFALSE
gammaFALSE


Interpolation Forecasts of Exponential Smoothing
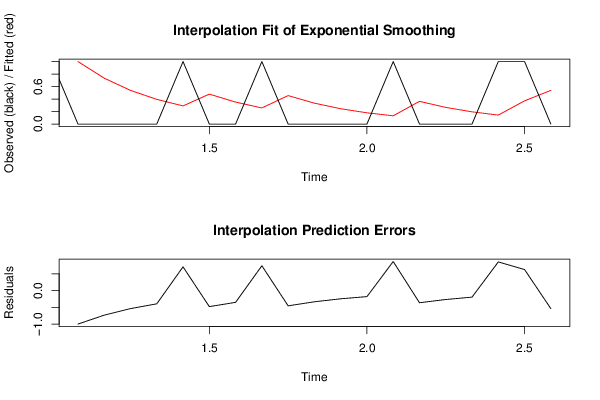
tObservedFittedResiduals
201-1
300.733829218754415-0.733829218754415
400.538505322297715-0.538505322297715
500.395170939956827-0.395170939956827
610.2899879821429660.710012017857034
700.478972435629727-0.478972435629727
800.351483968243062-0.351483968243062
910.2579292058205080.742070794179492
1000.455446768846795-0.455446768846795
1100.334220146567066-0.334220146567066
1200.245260509047296-0.245260509047296
1300.179979327745488-0.179979327745488
1410.1320740894714160.867925910528584
1500.363090607140095-0.363090607140095
1600.266446496574682-0.266446496574682
1700.19552622442125-0.19552622442125
1810.1434828565130460.856517143486954
1910.3714626937452060.628537306254795
2000.53876095959304-0.53876095959304

\begin{tabular}{lllllllll}
\hline
Interpolation Forecasts of Exponential Smoothing \tabularnewline
t & Observed & Fitted & Residuals \tabularnewline
2 & 0 & 1 & -1 \tabularnewline
3 & 0 & 0.733829218754415 & -0.733829218754415 \tabularnewline
4 & 0 & 0.538505322297715 & -0.538505322297715 \tabularnewline
5 & 0 & 0.395170939956827 & -0.395170939956827 \tabularnewline
6 & 1 & 0.289987982142966 & 0.710012017857034 \tabularnewline
7 & 0 & 0.478972435629727 & -0.478972435629727 \tabularnewline
8 & 0 & 0.351483968243062 & -0.351483968243062 \tabularnewline
9 & 1 & 0.257929205820508 & 0.742070794179492 \tabularnewline
10 & 0 & 0.455446768846795 & -0.455446768846795 \tabularnewline
11 & 0 & 0.334220146567066 & -0.334220146567066 \tabularnewline
12 & 0 & 0.245260509047296 & -0.245260509047296 \tabularnewline
13 & 0 & 0.179979327745488 & -0.179979327745488 \tabularnewline
14 & 1 & 0.132074089471416 & 0.867925910528584 \tabularnewline
15 & 0 & 0.363090607140095 & -0.363090607140095 \tabularnewline
16 & 0 & 0.266446496574682 & -0.266446496574682 \tabularnewline
17 & 0 & 0.19552622442125 & -0.19552622442125 \tabularnewline
18 & 1 & 0.143482856513046 & 0.856517143486954 \tabularnewline
19 & 1 & 0.371462693745206 & 0.628537306254795 \tabularnewline
20 & 0 & 0.53876095959304 & -0.53876095959304 \tabularnewline
\hline
\end{tabular}
%Source: https://freestatistics.org/blog/index.php?pk=290192&T=2

[TABLE]
[ROW][C]Interpolation Forecasts of Exponential Smoothing[/C][/ROW]
[ROW][C]t[/C][C]Observed[/C][C]Fitted[/C][C]Residuals[/C][/ROW]
[ROW][C]2[/C][C]0[/C][C]1[/C][C]-1[/C][/ROW]
[ROW][C]3[/C][C]0[/C][C]0.733829218754415[/C][C]-0.733829218754415[/C][/ROW]
[ROW][C]4[/C][C]0[/C][C]0.538505322297715[/C][C]-0.538505322297715[/C][/ROW]
[ROW][C]5[/C][C]0[/C][C]0.395170939956827[/C][C]-0.395170939956827[/C][/ROW]
[ROW][C]6[/C][C]1[/C][C]0.289987982142966[/C][C]0.710012017857034[/C][/ROW]
[ROW][C]7[/C][C]0[/C][C]0.478972435629727[/C][C]-0.478972435629727[/C][/ROW]
[ROW][C]8[/C][C]0[/C][C]0.351483968243062[/C][C]-0.351483968243062[/C][/ROW]
[ROW][C]9[/C][C]1[/C][C]0.257929205820508[/C][C]0.742070794179492[/C][/ROW]
[ROW][C]10[/C][C]0[/C][C]0.455446768846795[/C][C]-0.455446768846795[/C][/ROW]
[ROW][C]11[/C][C]0[/C][C]0.334220146567066[/C][C]-0.334220146567066[/C][/ROW]
[ROW][C]12[/C][C]0[/C][C]0.245260509047296[/C][C]-0.245260509047296[/C][/ROW]
[ROW][C]13[/C][C]0[/C][C]0.179979327745488[/C][C]-0.179979327745488[/C][/ROW]
[ROW][C]14[/C][C]1[/C][C]0.132074089471416[/C][C]0.867925910528584[/C][/ROW]
[ROW][C]15[/C][C]0[/C][C]0.363090607140095[/C][C]-0.363090607140095[/C][/ROW]
[ROW][C]16[/C][C]0[/C][C]0.266446496574682[/C][C]-0.266446496574682[/C][/ROW]
[ROW][C]17[/C][C]0[/C][C]0.19552622442125[/C][C]-0.19552622442125[/C][/ROW]
[ROW][C]18[/C][C]1[/C][C]0.143482856513046[/C][C]0.856517143486954[/C][/ROW]
[ROW][C]19[/C][C]1[/C][C]0.371462693745206[/C][C]0.628537306254795[/C][/ROW]
[ROW][C]20[/C][C]0[/C][C]0.53876095959304[/C][C]-0.53876095959304[/C][/ROW]
[/TABLE]
Source: https://freestatistics.org/blog/index.php?pk=290192&T=2

Globally Unique Identifier (entire table): ba.freestatistics.org/blog/index.php?pk=290192&T=2

As an alternative you can also use a QR Code:  

The GUIDs for individual cells are displayed in the table below:

Interpolation Forecasts of Exponential Smoothing
tObservedFittedResiduals
201-1
300.733829218754415-0.733829218754415
400.538505322297715-0.538505322297715
500.395170939956827-0.395170939956827
610.2899879821429660.710012017857034
700.478972435629727-0.478972435629727
800.351483968243062-0.351483968243062
910.2579292058205080.742070794179492
1000.455446768846795-0.455446768846795
1100.334220146567066-0.334220146567066
1200.245260509047296-0.245260509047296
1300.179979327745488-0.179979327745488
1410.1320740894714160.867925910528584
1500.363090607140095-0.363090607140095
1600.266446496574682-0.266446496574682
1700.19552622442125-0.19552622442125
1810.1434828565130460.856517143486954
1910.3714626937452060.628537306254795
2000.53876095959304-0.53876095959304


Extrapolation Forecasts of Exponential Smoothing
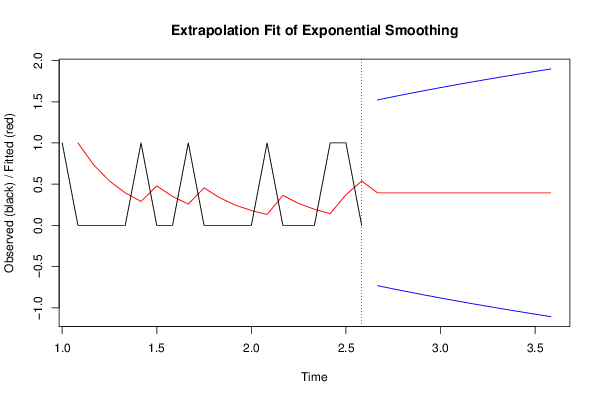
tForecast95% Lower Bound95% Upper Bound
210.395358534073539-0.731102614880721.5218196830278
220.395358534073539-0.7703229726363481.56104004078343
230.395358534073539-0.8082660045877141.59898307273479
240.395358534073539-0.8450489332732181.6357660014203
250.395358534073539-0.8807720783763311.67148914652341
260.395358534073539-0.9155220840659471.70623915221303
270.395358534073539-0.9493743947996421.74009146294672
280.395358534073539-0.9823951830246681.77311225117175
290.395358534073539-1.01464287016691.80535993831398
300.395358534073539-1.046169341113791.83688640926087
310.395358534073539-1.07702092446431.86773799261138
320.395358534073539-1.107239191502491.89795625964957

\begin{tabular}{lllllllll}
\hline
Extrapolation Forecasts of Exponential Smoothing \tabularnewline
t & Forecast & 95% Lower Bound & 95% Upper Bound \tabularnewline
21 & 0.395358534073539 & -0.73110261488072 & 1.5218196830278 \tabularnewline
22 & 0.395358534073539 & -0.770322972636348 & 1.56104004078343 \tabularnewline
23 & 0.395358534073539 & -0.808266004587714 & 1.59898307273479 \tabularnewline
24 & 0.395358534073539 & -0.845048933273218 & 1.6357660014203 \tabularnewline
25 & 0.395358534073539 & -0.880772078376331 & 1.67148914652341 \tabularnewline
26 & 0.395358534073539 & -0.915522084065947 & 1.70623915221303 \tabularnewline
27 & 0.395358534073539 & -0.949374394799642 & 1.74009146294672 \tabularnewline
28 & 0.395358534073539 & -0.982395183024668 & 1.77311225117175 \tabularnewline
29 & 0.395358534073539 & -1.0146428701669 & 1.80535993831398 \tabularnewline
30 & 0.395358534073539 & -1.04616934111379 & 1.83688640926087 \tabularnewline
31 & 0.395358534073539 & -1.0770209244643 & 1.86773799261138 \tabularnewline
32 & 0.395358534073539 & -1.10723919150249 & 1.89795625964957 \tabularnewline
\hline
\end{tabular}
%Source: https://freestatistics.org/blog/index.php?pk=290192&T=3

[TABLE]
[ROW][C]Extrapolation Forecasts of Exponential Smoothing[/C][/ROW]
[ROW][C]t[/C][C]Forecast[/C][C]95% Lower Bound[/C][C]95% Upper Bound[/C][/ROW]
[ROW][C]21[/C][C]0.395358534073539[/C][C]-0.73110261488072[/C][C]1.5218196830278[/C][/ROW]
[ROW][C]22[/C][C]0.395358534073539[/C][C]-0.770322972636348[/C][C]1.56104004078343[/C][/ROW]
[ROW][C]23[/C][C]0.395358534073539[/C][C]-0.808266004587714[/C][C]1.59898307273479[/C][/ROW]
[ROW][C]24[/C][C]0.395358534073539[/C][C]-0.845048933273218[/C][C]1.6357660014203[/C][/ROW]
[ROW][C]25[/C][C]0.395358534073539[/C][C]-0.880772078376331[/C][C]1.67148914652341[/C][/ROW]
[ROW][C]26[/C][C]0.395358534073539[/C][C]-0.915522084065947[/C][C]1.70623915221303[/C][/ROW]
[ROW][C]27[/C][C]0.395358534073539[/C][C]-0.949374394799642[/C][C]1.74009146294672[/C][/ROW]
[ROW][C]28[/C][C]0.395358534073539[/C][C]-0.982395183024668[/C][C]1.77311225117175[/C][/ROW]
[ROW][C]29[/C][C]0.395358534073539[/C][C]-1.0146428701669[/C][C]1.80535993831398[/C][/ROW]
[ROW][C]30[/C][C]0.395358534073539[/C][C]-1.04616934111379[/C][C]1.83688640926087[/C][/ROW]
[ROW][C]31[/C][C]0.395358534073539[/C][C]-1.0770209244643[/C][C]1.86773799261138[/C][/ROW]
[ROW][C]32[/C][C]0.395358534073539[/C][C]-1.10723919150249[/C][C]1.89795625964957[/C][/ROW]
[/TABLE]
Source: https://freestatistics.org/blog/index.php?pk=290192&T=3

Globally Unique Identifier (entire table): ba.freestatistics.org/blog/index.php?pk=290192&T=3

As an alternative you can also use a QR Code:  

The GUIDs for individual cells are displayed in the table below:

Extrapolation Forecasts of Exponential Smoothing
tForecast95% Lower Bound95% Upper Bound
210.395358534073539-0.731102614880721.5218196830278
220.395358534073539-0.7703229726363481.56104004078343
230.395358534073539-0.8082660045877141.59898307273479
240.395358534073539-0.8450489332732181.6357660014203
250.395358534073539-0.8807720783763311.67148914652341
260.395358534073539-0.9155220840659471.70623915221303
270.395358534073539-0.9493743947996421.74009146294672
280.395358534073539-0.9823951830246681.77311225117175
290.395358534073539-1.01464287016691.80535993831398
300.395358534073539-1.046169341113791.83688640926087
310.395358534073539-1.07702092446431.86773799261138
320.395358534073539-1.107239191502491.89795625964957


Parameters (Session):
par1 = 8 ; par2 = 0 ;
Parameters (R input):
par1 = 12 ; par2 = Single ; par3 = additive ;
R code (references can be found in the software module):
par1 <- as.numeric(par1)
if (par2 == 'Single') K <- 1
if (par2 == 'Double') K <- 2
if (par2 == 'Triple') K <- par1
nx <- length(x)
nxmK <- nx - K
x <- ts(x, frequency = par1)
if (par2 == 'Single') fit <- HoltWinters(x, gamma=F, beta=F)
if (par2 == 'Double') fit <- HoltWinters(x, gamma=F)
if (par2 == 'Triple') fit <- HoltWinters(x, seasonal=par3)
fit
myresid <- x - fit$fitted[,'xhat']
bitmap(file='test1.png')
op <- par(mfrow=c(2,1))
plot(fit,ylab='Observed (black) / Fitted (red)',main='Interpolation Fit of Exponential Smoothing')
plot(myresid,ylab='Residuals',main='Interpolation Prediction Errors')
par(op)
dev.off()
bitmap(file='test2.png')
p <- predict(fit, par1, prediction.interval=TRUE)
np <- length(p[,1])
plot(fit,p,ylab='Observed (black) / Fitted (red)',main='Extrapolation Fit of Exponential Smoothing')
dev.off()
bitmap(file='test3.png')
op <- par(mfrow = c(2,2))
acf(as.numeric(myresid),lag.max = nx/2,main='Residual ACF')
spectrum(myresid,main='Residals Periodogram')
cpgram(myresid,main='Residal Cumulative Periodogram')
qqnorm(myresid,main='Residual Normal QQ Plot')
qqline(myresid)
par(op)
dev.off()
load(file='createtable')
a<-table.start()
a<-table.row.start(a)
a<-table.element(a,'Estimated Parameters of Exponential Smoothing',2,TRUE)
a<-table.row.end(a)
a<-table.row.start(a)
a<-table.element(a,'Parameter',header=TRUE)
a<-table.element(a,'Value',header=TRUE)
a<-table.row.end(a)
a<-table.row.start(a)
a<-table.element(a,'alpha',header=TRUE)
a<-table.element(a,fit$alpha)
a<-table.row.end(a)
a<-table.row.start(a)
a<-table.element(a,'beta',header=TRUE)
a<-table.element(a,fit$beta)
a<-table.row.end(a)
a<-table.row.start(a)
a<-table.element(a,'gamma',header=TRUE)
a<-table.element(a,fit$gamma)
a<-table.row.end(a)
a<-table.end(a)
table.save(a,file='mytable.tab')
a<-table.start()
a<-table.row.start(a)
a<-table.element(a,'Interpolation Forecasts of Exponential Smoothing',4,TRUE)
a<-table.row.end(a)
a<-table.row.start(a)
a<-table.element(a,'t',header=TRUE)
a<-table.element(a,'Observed',header=TRUE)
a<-table.element(a,'Fitted',header=TRUE)
a<-table.element(a,'Residuals',header=TRUE)
a<-table.row.end(a)
for (i in 1:nxmK) {
a<-table.row.start(a)
a<-table.element(a,i+K,header=TRUE)
a<-table.element(a,x[i+K])
a<-table.element(a,fit$fitted[i,'xhat'])
a<-table.element(a,myresid[i])
a<-table.row.end(a)
}
a<-table.end(a)
table.save(a,file='mytable1.tab')
a<-table.start()
a<-table.row.start(a)
a<-table.element(a,'Extrapolation Forecasts of Exponential Smoothing',4,TRUE)
a<-table.row.end(a)
a<-table.row.start(a)
a<-table.element(a,'t',header=TRUE)
a<-table.element(a,'Forecast',header=TRUE)
a<-table.element(a,'95% Lower Bound',header=TRUE)
a<-table.element(a,'95% Upper Bound',header=TRUE)
a<-table.row.end(a)
for (i in 1:np) {
a<-table.row.start(a)
a<-table.element(a,nx+i,header=TRUE)
a<-table.element(a,p[i,'fit'])
a<-table.element(a,p[i,'lwr'])
a<-table.element(a,p[i,'upr'])
a<-table.row.end(a)
}
a<-table.end(a)
table.save(a,file='mytable2.tab')