Free Statistics

of Irreproducible Research!

Author's title

Author*Unverified author*
R Software Modulerwasp_exponentialsmoothing.wasp
Title produced by softwareExponential Smoothing
Date of computationSun, 03 Jan 2016 17:41:05 +0000
Cite this page as followsStatistical Computations at FreeStatistics.org, Office for Research Development and Education, URL https://freestatistics.org/blog/index.php?v=date/2016/Jan/03/t14518429039kg7vbyj9fh95nc.htm/, Retrieved Fri, 17 May 2024 01:43:30 +0000
Statistical Computations at FreeStatistics.org, Office for Research Development and Education, URL https://freestatistics.org/blog/index.php?pk=287312, Retrieved Fri, 17 May 2024 01:43:30 +0000
QR Codes:

Original text written by user:
IsPrivate?No (this computation is public)
User-defined keywords
Estimated Impact141
Family? (F = Feedback message, R = changed R code, M = changed R Module, P = changed Parameters, D = changed Data)
-     [Univariate Data Series] [] [2015-09-25 19:44:43] [ba9845715efdcdf5bf90594b26d5ea9c]
- R PD  [Univariate Data Series] [] [2015-10-02 11:08:09] [ba9845715efdcdf5bf90594b26d5ea9c]
- RMP     [Histogram] [] [2015-10-02 11:09:44] [ba9845715efdcdf5bf90594b26d5ea9c]
- RMPD        [Exponential Smoothing] [] [2016-01-03 17:41:05] [eed3b94f44ab74d862a61d666a631b56] [Current]
Feedback Forum

Post a new message
Dataseries X:
100
100
100
100
100
100
100
100
100
100
100
100
100
100
100
100
100
100
100
100
100
100
100
100
100,4
100,4
100,4
100,4
100,4
100,4
100,4
100,4
100,4
100,4
101,4
101,4
102
102
102,6
102,6
102,6
102,6
102,6
102,6
102,3
102,4
102,4
102,4
102,9
102,9
102,9
104,9
104,9
105,5
105,5
105,5
105,5
105,5
105,5
105,5


Summary of computational transaction
Raw Inputview raw input (R code)
Raw Outputview raw output of R engine
Computing time1 seconds
R Server'Gwilym Jenkins' @ jenkins.wessa.net

\begin{tabular}{lllllllll}
\hline
Summary of computational transaction \tabularnewline
Raw Input & view raw input (R code)  \tabularnewline
Raw Output & view raw output of R engine  \tabularnewline
Computing time & 1 seconds \tabularnewline
R Server & 'Gwilym Jenkins' @ jenkins.wessa.net \tabularnewline
\hline
\end{tabular}
%Source: https://freestatistics.org/blog/index.php?pk=287312&T=0

[TABLE]
[ROW][C]Summary of computational transaction[/C][/ROW]
[ROW][C]Raw Input[/C][C]view raw input (R code) [/C][/ROW]
[ROW][C]Raw Output[/C][C]view raw output of R engine [/C][/ROW]
[ROW][C]Computing time[/C][C]1 seconds[/C][/ROW]
[ROW][C]R Server[/C][C]'Gwilym Jenkins' @ jenkins.wessa.net[/C][/ROW]
[/TABLE]
Source: https://freestatistics.org/blog/index.php?pk=287312&T=0

Globally Unique Identifier (entire table): ba.freestatistics.org/blog/index.php?pk=287312&T=0

As an alternative you can also use a QR Code:  

The GUIDs for individual cells are displayed in the table below:

Summary of computational transaction
Raw Inputview raw input (R code)
Raw Outputview raw output of R engine
Computing time1 seconds
R Server'Gwilym Jenkins' @ jenkins.wessa.net


Estimated Parameters of Exponential Smoothing
ParameterValue
alpha0.91793069062011
beta0.0567382343305122
gamma0

\begin{tabular}{lllllllll}
\hline
Estimated Parameters of Exponential Smoothing \tabularnewline
Parameter & Value \tabularnewline
alpha & 0.91793069062011 \tabularnewline
beta & 0.0567382343305122 \tabularnewline
gamma & 0 \tabularnewline
\hline
\end{tabular}
%Source: https://freestatistics.org/blog/index.php?pk=287312&T=1

[TABLE]
[ROW][C]Estimated Parameters of Exponential Smoothing[/C][/ROW]
[ROW][C]Parameter[/C][C]Value[/C][/ROW]
[ROW][C]alpha[/C][C]0.91793069062011[/C][/ROW]
[ROW][C]beta[/C][C]0.0567382343305122[/C][/ROW]
[ROW][C]gamma[/C][C]0[/C][/ROW]
[/TABLE]
Source: https://freestatistics.org/blog/index.php?pk=287312&T=1

Globally Unique Identifier (entire table): ba.freestatistics.org/blog/index.php?pk=287312&T=1

As an alternative you can also use a QR Code:  

The GUIDs for individual cells are displayed in the table below:

Estimated Parameters of Exponential Smoothing
ParameterValue
alpha0.91793069062011
beta0.0567382343305122
gamma0


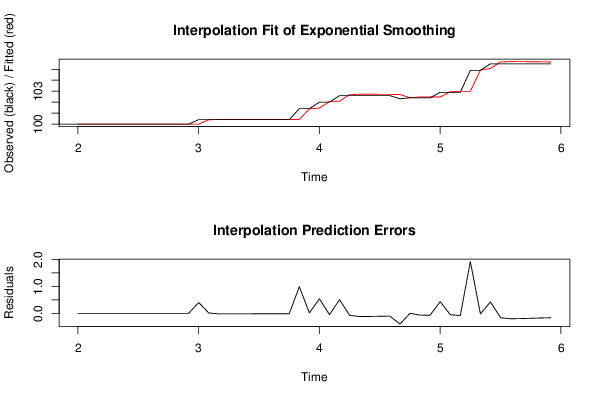
Interpolation Forecasts of Exponential Smoothing
tObservedFittedResiduals
13100100-5.6843418860808e-14
141001001.4210854715202e-14
151001001.4210854715202e-14
161001001.4210854715202e-14
171001001.4210854715202e-14
181001000
191001000
201001000
211001000
221001000
231001000
241001000
25100.41000.400000000000006
26100.4100.3880049828970.0119950171025209
27100.4100.420473005561-0.0204730055612004
28100.4100.42207136346-0.0220713634604266
29100.4100.421053023989-0.0210530239885571
30100.4100.419872970889-0.0198729708892813
31100.4100.418741105314-0.0187411053144189
32100.4100.417672144015-0.0176721440151226
33100.4100.416664018619-0.0166640186192097
34100.4100.415713390935-0.0157133909354599
35101.4100.4148169924180.985183007581583
36101.4101.3839841877140.0160158122863265
37102101.4643572019030.535642798097015
38102102.049608997246-0.0496089972464233
39102.6102.0950564836870.504943516313404
40102.6102.675843092259-0.075843092258566
41102.6102.71955780589-0.119557805890139
42102.6102.716918660503-0.116918660503217
43102.6102.710612737274-0.110612737273698
44102.6102.704334307741-0.104334307740956
45102.3102.698385126299-0.398385126298621
46102.4102.401769072726-0.00176907272606286
47102.4102.469126930688-0.0691269306875313
48102.4102.4710546909-0.0710546909002687
49102.9102.4675122470210.432487752979412
50102.9102.948711592626-0.0487115926261481
51102.9102.985666304795-0.0856663047950263
52104.9102.9842375000071.91576249999277
53104.9104.919757915656-0.0197579156561005
54105.5105.0775757123070.42242428769309
55105.5105.663286727426-0.163286727425699
56105.5105.702851364702-0.202851364702184
57105.5105.695533549724-0.195533549723649
58105.5105.684749248998-0.184749248998401
59105.5105.674242121616-0.174242121615521
60105.5105.664304971414-0.164304971413657

\begin{tabular}{lllllllll}
\hline
Interpolation Forecasts of Exponential Smoothing \tabularnewline
t & Observed & Fitted & Residuals \tabularnewline
13 & 100 & 100 & -5.6843418860808e-14 \tabularnewline
14 & 100 & 100 & 1.4210854715202e-14 \tabularnewline
15 & 100 & 100 & 1.4210854715202e-14 \tabularnewline
16 & 100 & 100 & 1.4210854715202e-14 \tabularnewline
17 & 100 & 100 & 1.4210854715202e-14 \tabularnewline
18 & 100 & 100 & 0 \tabularnewline
19 & 100 & 100 & 0 \tabularnewline
20 & 100 & 100 & 0 \tabularnewline
21 & 100 & 100 & 0 \tabularnewline
22 & 100 & 100 & 0 \tabularnewline
23 & 100 & 100 & 0 \tabularnewline
24 & 100 & 100 & 0 \tabularnewline
25 & 100.4 & 100 & 0.400000000000006 \tabularnewline
26 & 100.4 & 100.388004982897 & 0.0119950171025209 \tabularnewline
27 & 100.4 & 100.420473005561 & -0.0204730055612004 \tabularnewline
28 & 100.4 & 100.42207136346 & -0.0220713634604266 \tabularnewline
29 & 100.4 & 100.421053023989 & -0.0210530239885571 \tabularnewline
30 & 100.4 & 100.419872970889 & -0.0198729708892813 \tabularnewline
31 & 100.4 & 100.418741105314 & -0.0187411053144189 \tabularnewline
32 & 100.4 & 100.417672144015 & -0.0176721440151226 \tabularnewline
33 & 100.4 & 100.416664018619 & -0.0166640186192097 \tabularnewline
34 & 100.4 & 100.415713390935 & -0.0157133909354599 \tabularnewline
35 & 101.4 & 100.414816992418 & 0.985183007581583 \tabularnewline
36 & 101.4 & 101.383984187714 & 0.0160158122863265 \tabularnewline
37 & 102 & 101.464357201903 & 0.535642798097015 \tabularnewline
38 & 102 & 102.049608997246 & -0.0496089972464233 \tabularnewline
39 & 102.6 & 102.095056483687 & 0.504943516313404 \tabularnewline
40 & 102.6 & 102.675843092259 & -0.075843092258566 \tabularnewline
41 & 102.6 & 102.71955780589 & -0.119557805890139 \tabularnewline
42 & 102.6 & 102.716918660503 & -0.116918660503217 \tabularnewline
43 & 102.6 & 102.710612737274 & -0.110612737273698 \tabularnewline
44 & 102.6 & 102.704334307741 & -0.104334307740956 \tabularnewline
45 & 102.3 & 102.698385126299 & -0.398385126298621 \tabularnewline
46 & 102.4 & 102.401769072726 & -0.00176907272606286 \tabularnewline
47 & 102.4 & 102.469126930688 & -0.0691269306875313 \tabularnewline
48 & 102.4 & 102.4710546909 & -0.0710546909002687 \tabularnewline
49 & 102.9 & 102.467512247021 & 0.432487752979412 \tabularnewline
50 & 102.9 & 102.948711592626 & -0.0487115926261481 \tabularnewline
51 & 102.9 & 102.985666304795 & -0.0856663047950263 \tabularnewline
52 & 104.9 & 102.984237500007 & 1.91576249999277 \tabularnewline
53 & 104.9 & 104.919757915656 & -0.0197579156561005 \tabularnewline
54 & 105.5 & 105.077575712307 & 0.42242428769309 \tabularnewline
55 & 105.5 & 105.663286727426 & -0.163286727425699 \tabularnewline
56 & 105.5 & 105.702851364702 & -0.202851364702184 \tabularnewline
57 & 105.5 & 105.695533549724 & -0.195533549723649 \tabularnewline
58 & 105.5 & 105.684749248998 & -0.184749248998401 \tabularnewline
59 & 105.5 & 105.674242121616 & -0.174242121615521 \tabularnewline
60 & 105.5 & 105.664304971414 & -0.164304971413657 \tabularnewline
\hline
\end{tabular}
%Source: https://freestatistics.org/blog/index.php?pk=287312&T=2

[TABLE]
[ROW][C]Interpolation Forecasts of Exponential Smoothing[/C][/ROW]
[ROW][C]t[/C][C]Observed[/C][C]Fitted[/C][C]Residuals[/C][/ROW]
[ROW][C]13[/C][C]100[/C][C]100[/C][C]-5.6843418860808e-14[/C][/ROW]
[ROW][C]14[/C][C]100[/C][C]100[/C][C]1.4210854715202e-14[/C][/ROW]
[ROW][C]15[/C][C]100[/C][C]100[/C][C]1.4210854715202e-14[/C][/ROW]
[ROW][C]16[/C][C]100[/C][C]100[/C][C]1.4210854715202e-14[/C][/ROW]
[ROW][C]17[/C][C]100[/C][C]100[/C][C]1.4210854715202e-14[/C][/ROW]
[ROW][C]18[/C][C]100[/C][C]100[/C][C]0[/C][/ROW]
[ROW][C]19[/C][C]100[/C][C]100[/C][C]0[/C][/ROW]
[ROW][C]20[/C][C]100[/C][C]100[/C][C]0[/C][/ROW]
[ROW][C]21[/C][C]100[/C][C]100[/C][C]0[/C][/ROW]
[ROW][C]22[/C][C]100[/C][C]100[/C][C]0[/C][/ROW]
[ROW][C]23[/C][C]100[/C][C]100[/C][C]0[/C][/ROW]
[ROW][C]24[/C][C]100[/C][C]100[/C][C]0[/C][/ROW]
[ROW][C]25[/C][C]100.4[/C][C]100[/C][C]0.400000000000006[/C][/ROW]
[ROW][C]26[/C][C]100.4[/C][C]100.388004982897[/C][C]0.0119950171025209[/C][/ROW]
[ROW][C]27[/C][C]100.4[/C][C]100.420473005561[/C][C]-0.0204730055612004[/C][/ROW]
[ROW][C]28[/C][C]100.4[/C][C]100.42207136346[/C][C]-0.0220713634604266[/C][/ROW]
[ROW][C]29[/C][C]100.4[/C][C]100.421053023989[/C][C]-0.0210530239885571[/C][/ROW]
[ROW][C]30[/C][C]100.4[/C][C]100.419872970889[/C][C]-0.0198729708892813[/C][/ROW]
[ROW][C]31[/C][C]100.4[/C][C]100.418741105314[/C][C]-0.0187411053144189[/C][/ROW]
[ROW][C]32[/C][C]100.4[/C][C]100.417672144015[/C][C]-0.0176721440151226[/C][/ROW]
[ROW][C]33[/C][C]100.4[/C][C]100.416664018619[/C][C]-0.0166640186192097[/C][/ROW]
[ROW][C]34[/C][C]100.4[/C][C]100.415713390935[/C][C]-0.0157133909354599[/C][/ROW]
[ROW][C]35[/C][C]101.4[/C][C]100.414816992418[/C][C]0.985183007581583[/C][/ROW]
[ROW][C]36[/C][C]101.4[/C][C]101.383984187714[/C][C]0.0160158122863265[/C][/ROW]
[ROW][C]37[/C][C]102[/C][C]101.464357201903[/C][C]0.535642798097015[/C][/ROW]
[ROW][C]38[/C][C]102[/C][C]102.049608997246[/C][C]-0.0496089972464233[/C][/ROW]
[ROW][C]39[/C][C]102.6[/C][C]102.095056483687[/C][C]0.504943516313404[/C][/ROW]
[ROW][C]40[/C][C]102.6[/C][C]102.675843092259[/C][C]-0.075843092258566[/C][/ROW]
[ROW][C]41[/C][C]102.6[/C][C]102.71955780589[/C][C]-0.119557805890139[/C][/ROW]
[ROW][C]42[/C][C]102.6[/C][C]102.716918660503[/C][C]-0.116918660503217[/C][/ROW]
[ROW][C]43[/C][C]102.6[/C][C]102.710612737274[/C][C]-0.110612737273698[/C][/ROW]
[ROW][C]44[/C][C]102.6[/C][C]102.704334307741[/C][C]-0.104334307740956[/C][/ROW]
[ROW][C]45[/C][C]102.3[/C][C]102.698385126299[/C][C]-0.398385126298621[/C][/ROW]
[ROW][C]46[/C][C]102.4[/C][C]102.401769072726[/C][C]-0.00176907272606286[/C][/ROW]
[ROW][C]47[/C][C]102.4[/C][C]102.469126930688[/C][C]-0.0691269306875313[/C][/ROW]
[ROW][C]48[/C][C]102.4[/C][C]102.4710546909[/C][C]-0.0710546909002687[/C][/ROW]
[ROW][C]49[/C][C]102.9[/C][C]102.467512247021[/C][C]0.432487752979412[/C][/ROW]
[ROW][C]50[/C][C]102.9[/C][C]102.948711592626[/C][C]-0.0487115926261481[/C][/ROW]
[ROW][C]51[/C][C]102.9[/C][C]102.985666304795[/C][C]-0.0856663047950263[/C][/ROW]
[ROW][C]52[/C][C]104.9[/C][C]102.984237500007[/C][C]1.91576249999277[/C][/ROW]
[ROW][C]53[/C][C]104.9[/C][C]104.919757915656[/C][C]-0.0197579156561005[/C][/ROW]
[ROW][C]54[/C][C]105.5[/C][C]105.077575712307[/C][C]0.42242428769309[/C][/ROW]
[ROW][C]55[/C][C]105.5[/C][C]105.663286727426[/C][C]-0.163286727425699[/C][/ROW]
[ROW][C]56[/C][C]105.5[/C][C]105.702851364702[/C][C]-0.202851364702184[/C][/ROW]
[ROW][C]57[/C][C]105.5[/C][C]105.695533549724[/C][C]-0.195533549723649[/C][/ROW]
[ROW][C]58[/C][C]105.5[/C][C]105.684749248998[/C][C]-0.184749248998401[/C][/ROW]
[ROW][C]59[/C][C]105.5[/C][C]105.674242121616[/C][C]-0.174242121615521[/C][/ROW]
[ROW][C]60[/C][C]105.5[/C][C]105.664304971414[/C][C]-0.164304971413657[/C][/ROW]
[/TABLE]
Source: https://freestatistics.org/blog/index.php?pk=287312&T=2

Globally Unique Identifier (entire table): ba.freestatistics.org/blog/index.php?pk=287312&T=2

As an alternative you can also use a QR Code:  

The GUIDs for individual cells are displayed in the table below:

Interpolation Forecasts of Exponential Smoothing
tObservedFittedResiduals
13100100-5.6843418860808e-14
141001001.4210854715202e-14
151001001.4210854715202e-14
161001001.4210854715202e-14
171001001.4210854715202e-14
181001000
191001000
201001000
211001000
221001000
231001000
241001000
25100.41000.400000000000006
26100.4100.3880049828970.0119950171025209
27100.4100.420473005561-0.0204730055612004
28100.4100.42207136346-0.0220713634604266
29100.4100.421053023989-0.0210530239885571
30100.4100.419872970889-0.0198729708892813
31100.4100.418741105314-0.0187411053144189
32100.4100.417672144015-0.0176721440151226
33100.4100.416664018619-0.0166640186192097
34100.4100.415713390935-0.0157133909354599
35101.4100.4148169924180.985183007581583
36101.4101.3839841877140.0160158122863265
37102101.4643572019030.535642798097015
38102102.049608997246-0.0496089972464233
39102.6102.0950564836870.504943516313404
40102.6102.675843092259-0.075843092258566
41102.6102.71955780589-0.119557805890139
42102.6102.716918660503-0.116918660503217
43102.6102.710612737274-0.110612737273698
44102.6102.704334307741-0.104334307740956
45102.3102.698385126299-0.398385126298621
46102.4102.401769072726-0.00176907272606286
47102.4102.469126930688-0.0691269306875313
48102.4102.4710546909-0.0710546909002687
49102.9102.4675122470210.432487752979412
50102.9102.948711592626-0.0487115926261481
51102.9102.985666304795-0.0856663047950263
52104.9102.9842375000071.91576249999277
53104.9104.919757915656-0.0197579156561005
54105.5105.0775757123070.42242428769309
55105.5105.663286727426-0.163286727425699
56105.5105.702851364702-0.202851364702184
57105.5105.695533549724-0.195533549723649
58105.5105.684749248998-0.184749248998401
59105.5105.674242121616-0.174242121615521
60105.5105.664304971414-0.164304971413657


Extrapolation Forecasts of Exponential Smoothing
tForecast95% Lower Bound95% Upper Bound
61105.654932143183104.955041720979106.354822565387
62105.796379890835104.821313169955106.771446611715
63105.937827638486104.728494601141107.147160675831
64106.079275386138104.655302813979107.503247958296
65106.220723133789104.593133808644107.848312458934
66106.362170881441104.537563746072108.18677801681
67106.503618629092104.485999270635108.52123798755
68106.645066376744104.436787755078108.85334499841
69106.786514124395104.38881347329109.1842147755
70106.927961872047104.341290820703109.514632923391
71107.069409619699104.293648814877109.84517042452
72107.21085736735104.245462183989110.176252550711

\begin{tabular}{lllllllll}
\hline
Extrapolation Forecasts of Exponential Smoothing \tabularnewline
t & Forecast & 95% Lower Bound & 95% Upper Bound \tabularnewline
61 & 105.654932143183 & 104.955041720979 & 106.354822565387 \tabularnewline
62 & 105.796379890835 & 104.821313169955 & 106.771446611715 \tabularnewline
63 & 105.937827638486 & 104.728494601141 & 107.147160675831 \tabularnewline
64 & 106.079275386138 & 104.655302813979 & 107.503247958296 \tabularnewline
65 & 106.220723133789 & 104.593133808644 & 107.848312458934 \tabularnewline
66 & 106.362170881441 & 104.537563746072 & 108.18677801681 \tabularnewline
67 & 106.503618629092 & 104.485999270635 & 108.52123798755 \tabularnewline
68 & 106.645066376744 & 104.436787755078 & 108.85334499841 \tabularnewline
69 & 106.786514124395 & 104.38881347329 & 109.1842147755 \tabularnewline
70 & 106.927961872047 & 104.341290820703 & 109.514632923391 \tabularnewline
71 & 107.069409619699 & 104.293648814877 & 109.84517042452 \tabularnewline
72 & 107.21085736735 & 104.245462183989 & 110.176252550711 \tabularnewline
\hline
\end{tabular}
%Source: https://freestatistics.org/blog/index.php?pk=287312&T=3

[TABLE]
[ROW][C]Extrapolation Forecasts of Exponential Smoothing[/C][/ROW]
[ROW][C]t[/C][C]Forecast[/C][C]95% Lower Bound[/C][C]95% Upper Bound[/C][/ROW]
[ROW][C]61[/C][C]105.654932143183[/C][C]104.955041720979[/C][C]106.354822565387[/C][/ROW]
[ROW][C]62[/C][C]105.796379890835[/C][C]104.821313169955[/C][C]106.771446611715[/C][/ROW]
[ROW][C]63[/C][C]105.937827638486[/C][C]104.728494601141[/C][C]107.147160675831[/C][/ROW]
[ROW][C]64[/C][C]106.079275386138[/C][C]104.655302813979[/C][C]107.503247958296[/C][/ROW]
[ROW][C]65[/C][C]106.220723133789[/C][C]104.593133808644[/C][C]107.848312458934[/C][/ROW]
[ROW][C]66[/C][C]106.362170881441[/C][C]104.537563746072[/C][C]108.18677801681[/C][/ROW]
[ROW][C]67[/C][C]106.503618629092[/C][C]104.485999270635[/C][C]108.52123798755[/C][/ROW]
[ROW][C]68[/C][C]106.645066376744[/C][C]104.436787755078[/C][C]108.85334499841[/C][/ROW]
[ROW][C]69[/C][C]106.786514124395[/C][C]104.38881347329[/C][C]109.1842147755[/C][/ROW]
[ROW][C]70[/C][C]106.927961872047[/C][C]104.341290820703[/C][C]109.514632923391[/C][/ROW]
[ROW][C]71[/C][C]107.069409619699[/C][C]104.293648814877[/C][C]109.84517042452[/C][/ROW]
[ROW][C]72[/C][C]107.21085736735[/C][C]104.245462183989[/C][C]110.176252550711[/C][/ROW]
[/TABLE]
Source: https://freestatistics.org/blog/index.php?pk=287312&T=3

Globally Unique Identifier (entire table): ba.freestatistics.org/blog/index.php?pk=287312&T=3

As an alternative you can also use a QR Code:  

The GUIDs for individual cells are displayed in the table below:

Extrapolation Forecasts of Exponential Smoothing
tForecast95% Lower Bound95% Upper Bound
61105.654932143183104.955041720979106.354822565387
62105.796379890835104.821313169955106.771446611715
63105.937827638486104.728494601141107.147160675831
64106.079275386138104.655302813979107.503247958296
65106.220723133789104.593133808644107.848312458934
66106.362170881441104.537563746072108.18677801681
67106.503618629092104.485999270635108.52123798755
68106.645066376744104.436787755078108.85334499841
69106.786514124395104.38881347329109.1842147755
70106.927961872047104.341290820703109.514632923391
71107.069409619699104.293648814877109.84517042452
72107.21085736735104.245462183989110.176252550711


Parameters (Session):
par1 = 48 ; par2 = 1 ; par3 = 0 ; par4 = 0 ; par5 = 12 ; par6 = White Noise ; par7 = 0.95 ;
Parameters (R input):
par1 = 12 ; par2 = Triple ; par3 = additive ;
R code (references can be found in the software module):
par1 <- as.numeric(par1)
if (par2 == 'Single') K <- 1
if (par2 == 'Double') K <- 2
if (par2 == 'Triple') K <- par1
nx <- length(x)
nxmK <- nx - K
x <- ts(x, frequency = par1)
if (par2 == 'Single') fit <- HoltWinters(x, gamma=F, beta=F)
if (par2 == 'Double') fit <- HoltWinters(x, gamma=F)
if (par2 == 'Triple') fit <- HoltWinters(x, seasonal=par3)
fit
myresid <- x - fit$fitted[,'xhat']
bitmap(file='test1.png')
op <- par(mfrow=c(2,1))
plot(fit,ylab='Observed (black) / Fitted (red)',main='Interpolation Fit of Exponential Smoothing')
plot(myresid,ylab='Residuals',main='Interpolation Prediction Errors')
par(op)
dev.off()
bitmap(file='test2.png')
p <- predict(fit, par1, prediction.interval=TRUE)
np <- length(p[,1])
plot(fit,p,ylab='Observed (black) / Fitted (red)',main='Extrapolation Fit of Exponential Smoothing')
dev.off()
bitmap(file='test3.png')
op <- par(mfrow = c(2,2))
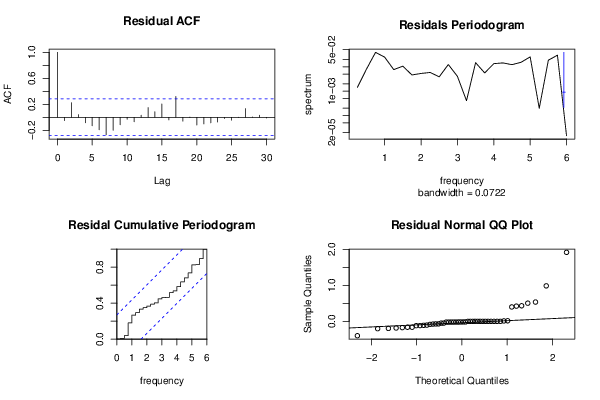
acf(as.numeric(myresid),lag.max = nx/2,main='Residual ACF')
spectrum(myresid,main='Residals Periodogram')
cpgram(myresid,main='Residal Cumulative Periodogram')
qqnorm(myresid,main='Residual Normal QQ Plot')
qqline(myresid)
par(op)
dev.off()
load(file='createtable')
a<-table.start()
a<-table.row.start(a)
a<-table.element(a,'Estimated Parameters of Exponential Smoothing',2,TRUE)
a<-table.row.end(a)
a<-table.row.start(a)
a<-table.element(a,'Parameter',header=TRUE)
a<-table.element(a,'Value',header=TRUE)
a<-table.row.end(a)
a<-table.row.start(a)
a<-table.element(a,'alpha',header=TRUE)
a<-table.element(a,fit$alpha)
a<-table.row.end(a)
a<-table.row.start(a)
a<-table.element(a,'beta',header=TRUE)
a<-table.element(a,fit$beta)
a<-table.row.end(a)
a<-table.row.start(a)
a<-table.element(a,'gamma',header=TRUE)
a<-table.element(a,fit$gamma)
a<-table.row.end(a)
a<-table.end(a)
table.save(a,file='mytable.tab')
a<-table.start()
a<-table.row.start(a)
a<-table.element(a,'Interpolation Forecasts of Exponential Smoothing',4,TRUE)
a<-table.row.end(a)
a<-table.row.start(a)
a<-table.element(a,'t',header=TRUE)
a<-table.element(a,'Observed',header=TRUE)
a<-table.element(a,'Fitted',header=TRUE)
a<-table.element(a,'Residuals',header=TRUE)
a<-table.row.end(a)
for (i in 1:nxmK) {
a<-table.row.start(a)
a<-table.element(a,i+K,header=TRUE)
a<-table.element(a,x[i+K])
a<-table.element(a,fit$fitted[i,'xhat'])
a<-table.element(a,myresid[i])
a<-table.row.end(a)
}
a<-table.end(a)
table.save(a,file='mytable1.tab')
a<-table.start()
a<-table.row.start(a)
a<-table.element(a,'Extrapolation Forecasts of Exponential Smoothing',4,TRUE)
a<-table.row.end(a)
a<-table.row.start(a)
a<-table.element(a,'t',header=TRUE)
a<-table.element(a,'Forecast',header=TRUE)
a<-table.element(a,'95% Lower Bound',header=TRUE)
a<-table.element(a,'95% Upper Bound',header=TRUE)
a<-table.row.end(a)
for (i in 1:np) {
a<-table.row.start(a)
a<-table.element(a,nx+i,header=TRUE)
a<-table.element(a,p[i,'fit'])
a<-table.element(a,p[i,'lwr'])
a<-table.element(a,p[i,'upr'])
a<-table.row.end(a)
}
a<-table.end(a)
table.save(a,file='mytable2.tab')