Free Statistics

of Irreproducible Research!

Author's title

Author*The author of this computation has been verified*
R Software Modulerwasp_exponentialsmoothing.wasp
Title produced by softwareExponential Smoothing
Date of computationFri, 23 Dec 2016 08:43:01 +0100
Cite this page as followsStatistical Computations at FreeStatistics.org, Office for Research Development and Education, URL https://freestatistics.org/blog/index.php?v=date/2016/Dec/23/t1482479025mfzv9lulbzq8ey4.htm/, Retrieved Sat, 18 May 2024 02:33:46 +0000
Statistical Computations at FreeStatistics.org, Office for Research Development and Education, URL https://freestatistics.org/blog/index.php?pk=302753, Retrieved Sat, 18 May 2024 02:33:46 +0000
QR Codes:

Original text written by user:
IsPrivate?No (this computation is public)
User-defined keywords
Estimated Impact126
Family? (F = Feedback message, R = changed R code, M = changed R Module, P = changed Parameters, D = changed Data)
-     [Kendall tau Correlation Matrix] [Correlation matrices] [2016-12-21 16:26:17] [b011e1d1c3fc908d73f0b66878a70c1c]
- RMPD    [Exponential Smoothing] [Exponential smoot...] [2016-12-23 07:43:01] [0fd57913e31aa45e4c342a705351a504] [Current]
Feedback Forum

Post a new message
Dataseries X:
3233.7
3097.3
3216.8
3729.6
3447.7
3384.3
3494.7
3904.2
3605.2
3674.6
3751.1
4039.5
3885.9
3906.1
3965
4411.6
4325.1
4349.2
4426.1
4915
4506.9
4497.4
4546.5
5122
4471.3
4560.6
4581.6
5186.2
4719.8
4784.1
4778.6
5494.8
4966.8
5188.2
5135.4
5690.4
5293.5
5673.8
5568.9
6094.2
5712.7
5858.7
5814.6
6616.6


Summary of computational transaction
Raw Input view raw input (R code)
Raw Outputview raw output of R engine
Computing time2 seconds
R ServerBig Analytics Cloud Computing Center

\begin{tabular}{lllllllll}
\hline
Summary of computational transaction \tabularnewline
Raw Input view raw input (R code)  \tabularnewline
Raw Outputview raw output of R engine  \tabularnewline
Computing time2 seconds \tabularnewline
R ServerBig Analytics Cloud Computing Center \tabularnewline
\hline
\end{tabular}
%Source: https://freestatistics.org/blog/index.php?pk=302753&T=0

[TABLE]
[ROW]
Summary of computational transaction[/C][/ROW] [ROW]Raw Input[/C] view raw input (R code) [/C][/ROW] [ROW]Raw Output[/C]view raw output of R engine [/C][/ROW] [ROW]Computing time[/C]2 seconds[/C][/ROW] [ROW]R Server[/C]Big Analytics Cloud Computing Center[/C][/ROW] [/TABLE] Source: https://freestatistics.org/blog/index.php?pk=302753&T=0

Globally Unique Identifier (entire table): ba.freestatistics.org/blog/index.php?pk=302753&T=0

As an alternative you can also use a QR Code:  

The GUIDs for individual cells are displayed in the table below:

Summary of computational transaction
Raw Input view raw input (R code)
Raw Outputview raw output of R engine
Computing time2 seconds
R ServerBig Analytics Cloud Computing Center


Estimated Parameters of Exponential Smoothing
ParameterValue
alpha0.457680908025924
beta0
gamma0.693037054812142

\begin{tabular}{lllllllll}
\hline
Estimated Parameters of Exponential Smoothing \tabularnewline
Parameter & Value \tabularnewline
alpha & 0.457680908025924 \tabularnewline
beta & 0 \tabularnewline
gamma & 0.693037054812142 \tabularnewline
\hline
\end{tabular}
%Source: https://freestatistics.org/blog/index.php?pk=302753&T=1

[TABLE]
[ROW][C]Estimated Parameters of Exponential Smoothing[/C][/ROW]
[ROW][C]Parameter[/C][C]Value[/C][/ROW]
[ROW][C]alpha[/C][C]0.457680908025924[/C][/ROW]
[ROW][C]beta[/C][C]0[/C][/ROW]
[ROW][C]gamma[/C][C]0.693037054812142[/C][/ROW]
[/TABLE]
Source: https://freestatistics.org/blog/index.php?pk=302753&T=1

Globally Unique Identifier (entire table): ba.freestatistics.org/blog/index.php?pk=302753&T=1

As an alternative you can also use a QR Code:  

The GUIDs for individual cells are displayed in the table below:

Estimated Parameters of Exponential Smoothing
ParameterValue
alpha0.457680908025924
beta0
gamma0.693037054812142


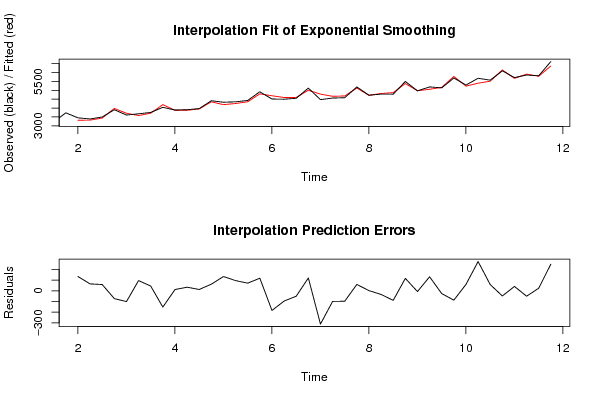
Interpolation Forecasts of Exponential Smoothing
tObservedFittedResiduals
53447.73312.791875134.908125000001
63384.33318.5754981500765.7245018499252
73494.73434.957597836359.7424021636994
83904.23976.47680470623-72.2768047062327
93605.23705.59068568162-100.390685681623
103674.63577.6800626372496.9199373627589
113751.13706.0913620009145.0086379990948
124039.54191.2481535929-151.748153592898
133885.93873.4229912635112.4770087364946
143906.13871.3284074720634.7715925279417
1539653951.784878061513.2151219384955
164411.64348.4398899838963.1601100161115
174325.14190.6977086306134.402291369397
184349.24252.7853563847696.4146436152378
194426.14353.3527348901172.7472651098869
2049154796.02615739098118.973842609024
214506.94690.6050321062-183.705032106196
224497.44592.82347916142-95.4234791614217
234546.54596.69489287604-50.1948928760421
2451225000.47416780825121.525832191752
254471.34782.46002392069-311.16002392069
264560.64659.52513139493-98.9251313949326
274581.64678.79294443921-97.1929444392081
285186.25125.6028666663660.597133333642
294719.84717.079041694412.72095830558737
304784.14817.56937779959-33.4693777995863
314778.64867.44607724759-88.8460772475901
325494.85377.38116429404117.418835705958
334966.84973.11094780802-6.31094780801959
345188.25055.865515479132.334484520999
355135.45160.81429830057-25.4142983005713
365690.45777.30499494363-86.9049949436303
375293.55233.0161661738460.4838338261607
385673.85398.45093133043275.349068669574
395568.95509.5653164150959.3346835849061
406094.26141.73289626706-47.5328962670592
415712.75670.8596078467741.8403921532254
425858.75908.51812822754-49.8181282275373
435814.65789.6212879075824.9787120924248
446616.66365.89891206519250.701087934812

\begin{tabular}{lllllllll}
\hline
Interpolation Forecasts of Exponential Smoothing \tabularnewline
t & Observed & Fitted & Residuals \tabularnewline
5 & 3447.7 & 3312.791875 & 134.908125000001 \tabularnewline
6 & 3384.3 & 3318.57549815007 & 65.7245018499252 \tabularnewline
7 & 3494.7 & 3434.9575978363 & 59.7424021636994 \tabularnewline
8 & 3904.2 & 3976.47680470623 & -72.2768047062327 \tabularnewline
9 & 3605.2 & 3705.59068568162 & -100.390685681623 \tabularnewline
10 & 3674.6 & 3577.68006263724 & 96.9199373627589 \tabularnewline
11 & 3751.1 & 3706.09136200091 & 45.0086379990948 \tabularnewline
12 & 4039.5 & 4191.2481535929 & -151.748153592898 \tabularnewline
13 & 3885.9 & 3873.42299126351 & 12.4770087364946 \tabularnewline
14 & 3906.1 & 3871.32840747206 & 34.7715925279417 \tabularnewline
15 & 3965 & 3951.7848780615 & 13.2151219384955 \tabularnewline
16 & 4411.6 & 4348.43988998389 & 63.1601100161115 \tabularnewline
17 & 4325.1 & 4190.6977086306 & 134.402291369397 \tabularnewline
18 & 4349.2 & 4252.78535638476 & 96.4146436152378 \tabularnewline
19 & 4426.1 & 4353.35273489011 & 72.7472651098869 \tabularnewline
20 & 4915 & 4796.02615739098 & 118.973842609024 \tabularnewline
21 & 4506.9 & 4690.6050321062 & -183.705032106196 \tabularnewline
22 & 4497.4 & 4592.82347916142 & -95.4234791614217 \tabularnewline
23 & 4546.5 & 4596.69489287604 & -50.1948928760421 \tabularnewline
24 & 5122 & 5000.47416780825 & 121.525832191752 \tabularnewline
25 & 4471.3 & 4782.46002392069 & -311.16002392069 \tabularnewline
26 & 4560.6 & 4659.52513139493 & -98.9251313949326 \tabularnewline
27 & 4581.6 & 4678.79294443921 & -97.1929444392081 \tabularnewline
28 & 5186.2 & 5125.60286666636 & 60.597133333642 \tabularnewline
29 & 4719.8 & 4717.07904169441 & 2.72095830558737 \tabularnewline
30 & 4784.1 & 4817.56937779959 & -33.4693777995863 \tabularnewline
31 & 4778.6 & 4867.44607724759 & -88.8460772475901 \tabularnewline
32 & 5494.8 & 5377.38116429404 & 117.418835705958 \tabularnewline
33 & 4966.8 & 4973.11094780802 & -6.31094780801959 \tabularnewline
34 & 5188.2 & 5055.865515479 & 132.334484520999 \tabularnewline
35 & 5135.4 & 5160.81429830057 & -25.4142983005713 \tabularnewline
36 & 5690.4 & 5777.30499494363 & -86.9049949436303 \tabularnewline
37 & 5293.5 & 5233.01616617384 & 60.4838338261607 \tabularnewline
38 & 5673.8 & 5398.45093133043 & 275.349068669574 \tabularnewline
39 & 5568.9 & 5509.56531641509 & 59.3346835849061 \tabularnewline
40 & 6094.2 & 6141.73289626706 & -47.5328962670592 \tabularnewline
41 & 5712.7 & 5670.85960784677 & 41.8403921532254 \tabularnewline
42 & 5858.7 & 5908.51812822754 & -49.8181282275373 \tabularnewline
43 & 5814.6 & 5789.62128790758 & 24.9787120924248 \tabularnewline
44 & 6616.6 & 6365.89891206519 & 250.701087934812 \tabularnewline
\hline
\end{tabular}
%Source: https://freestatistics.org/blog/index.php?pk=302753&T=2

[TABLE]
[ROW][C]Interpolation Forecasts of Exponential Smoothing[/C][/ROW]
[ROW][C]t[/C][C]Observed[/C][C]Fitted[/C][C]Residuals[/C][/ROW]
[ROW][C]5[/C][C]3447.7[/C][C]3312.791875[/C][C]134.908125000001[/C][/ROW]
[ROW][C]6[/C][C]3384.3[/C][C]3318.57549815007[/C][C]65.7245018499252[/C][/ROW]
[ROW][C]7[/C][C]3494.7[/C][C]3434.9575978363[/C][C]59.7424021636994[/C][/ROW]
[ROW][C]8[/C][C]3904.2[/C][C]3976.47680470623[/C][C]-72.2768047062327[/C][/ROW]
[ROW][C]9[/C][C]3605.2[/C][C]3705.59068568162[/C][C]-100.390685681623[/C][/ROW]
[ROW][C]10[/C][C]3674.6[/C][C]3577.68006263724[/C][C]96.9199373627589[/C][/ROW]
[ROW][C]11[/C][C]3751.1[/C][C]3706.09136200091[/C][C]45.0086379990948[/C][/ROW]
[ROW][C]12[/C][C]4039.5[/C][C]4191.2481535929[/C][C]-151.748153592898[/C][/ROW]
[ROW][C]13[/C][C]3885.9[/C][C]3873.42299126351[/C][C]12.4770087364946[/C][/ROW]
[ROW][C]14[/C][C]3906.1[/C][C]3871.32840747206[/C][C]34.7715925279417[/C][/ROW]
[ROW][C]15[/C][C]3965[/C][C]3951.7848780615[/C][C]13.2151219384955[/C][/ROW]
[ROW][C]16[/C][C]4411.6[/C][C]4348.43988998389[/C][C]63.1601100161115[/C][/ROW]
[ROW][C]17[/C][C]4325.1[/C][C]4190.6977086306[/C][C]134.402291369397[/C][/ROW]
[ROW][C]18[/C][C]4349.2[/C][C]4252.78535638476[/C][C]96.4146436152378[/C][/ROW]
[ROW][C]19[/C][C]4426.1[/C][C]4353.35273489011[/C][C]72.7472651098869[/C][/ROW]
[ROW][C]20[/C][C]4915[/C][C]4796.02615739098[/C][C]118.973842609024[/C][/ROW]
[ROW][C]21[/C][C]4506.9[/C][C]4690.6050321062[/C][C]-183.705032106196[/C][/ROW]
[ROW][C]22[/C][C]4497.4[/C][C]4592.82347916142[/C][C]-95.4234791614217[/C][/ROW]
[ROW][C]23[/C][C]4546.5[/C][C]4596.69489287604[/C][C]-50.1948928760421[/C][/ROW]
[ROW][C]24[/C][C]5122[/C][C]5000.47416780825[/C][C]121.525832191752[/C][/ROW]
[ROW][C]25[/C][C]4471.3[/C][C]4782.46002392069[/C][C]-311.16002392069[/C][/ROW]
[ROW][C]26[/C][C]4560.6[/C][C]4659.52513139493[/C][C]-98.9251313949326[/C][/ROW]
[ROW][C]27[/C][C]4581.6[/C][C]4678.79294443921[/C][C]-97.1929444392081[/C][/ROW]
[ROW][C]28[/C][C]5186.2[/C][C]5125.60286666636[/C][C]60.597133333642[/C][/ROW]
[ROW][C]29[/C][C]4719.8[/C][C]4717.07904169441[/C][C]2.72095830558737[/C][/ROW]
[ROW][C]30[/C][C]4784.1[/C][C]4817.56937779959[/C][C]-33.4693777995863[/C][/ROW]
[ROW][C]31[/C][C]4778.6[/C][C]4867.44607724759[/C][C]-88.8460772475901[/C][/ROW]
[ROW][C]32[/C][C]5494.8[/C][C]5377.38116429404[/C][C]117.418835705958[/C][/ROW]
[ROW][C]33[/C][C]4966.8[/C][C]4973.11094780802[/C][C]-6.31094780801959[/C][/ROW]
[ROW][C]34[/C][C]5188.2[/C][C]5055.865515479[/C][C]132.334484520999[/C][/ROW]
[ROW][C]35[/C][C]5135.4[/C][C]5160.81429830057[/C][C]-25.4142983005713[/C][/ROW]
[ROW][C]36[/C][C]5690.4[/C][C]5777.30499494363[/C][C]-86.9049949436303[/C][/ROW]
[ROW][C]37[/C][C]5293.5[/C][C]5233.01616617384[/C][C]60.4838338261607[/C][/ROW]
[ROW][C]38[/C][C]5673.8[/C][C]5398.45093133043[/C][C]275.349068669574[/C][/ROW]
[ROW][C]39[/C][C]5568.9[/C][C]5509.56531641509[/C][C]59.3346835849061[/C][/ROW]
[ROW][C]40[/C][C]6094.2[/C][C]6141.73289626706[/C][C]-47.5328962670592[/C][/ROW]
[ROW][C]41[/C][C]5712.7[/C][C]5670.85960784677[/C][C]41.8403921532254[/C][/ROW]
[ROW][C]42[/C][C]5858.7[/C][C]5908.51812822754[/C][C]-49.8181282275373[/C][/ROW]
[ROW][C]43[/C][C]5814.6[/C][C]5789.62128790758[/C][C]24.9787120924248[/C][/ROW]
[ROW][C]44[/C][C]6616.6[/C][C]6365.89891206519[/C][C]250.701087934812[/C][/ROW]
[/TABLE]
Source: https://freestatistics.org/blog/index.php?pk=302753&T=2

Globally Unique Identifier (entire table): ba.freestatistics.org/blog/index.php?pk=302753&T=2

As an alternative you can also use a QR Code:  

The GUIDs for individual cells are displayed in the table below:

Interpolation Forecasts of Exponential Smoothing
tObservedFittedResiduals
53447.73312.791875134.908125000001
63384.33318.5754981500765.7245018499252
73494.73434.957597836359.7424021636994
83904.23976.47680470623-72.2768047062327
93605.23705.59068568162-100.390685681623
103674.63577.6800626372496.9199373627589
113751.13706.0913620009145.0086379990948
124039.54191.2481535929-151.748153592898
133885.93873.4229912635112.4770087364946
143906.13871.3284074720634.7715925279417
1539653951.784878061513.2151219384955
164411.64348.4398899838963.1601100161115
174325.14190.6977086306134.402291369397
184349.24252.7853563847696.4146436152378
194426.14353.3527348901172.7472651098869
2049154796.02615739098118.973842609024
214506.94690.6050321062-183.705032106196
224497.44592.82347916142-95.4234791614217
234546.54596.69489287604-50.1948928760421
2451225000.47416780825121.525832191752
254471.34782.46002392069-311.16002392069
264560.64659.52513139493-98.9251313949326
274581.64678.79294443921-97.1929444392081
285186.25125.6028666663660.597133333642
294719.84717.079041694412.72095830558737
304784.14817.56937779959-33.4693777995863
314778.64867.44607724759-88.8460772475901
325494.85377.38116429404117.418835705958
334966.84973.11094780802-6.31094780801959
345188.25055.865515479132.334484520999
355135.45160.81429830057-25.4142983005713
365690.45777.30499494363-86.9049949436303
375293.55233.0161661738460.4838338261607
385673.85398.45093133043275.349068669574
395568.95509.5653164150959.3346835849061
406094.26141.73289626706-47.5328962670592
415712.75670.8596078467741.8403921532254
425858.75908.51812822754-49.8181282275373
435814.65789.6212879075824.9787120924248
446616.66365.89891206519250.701087934812


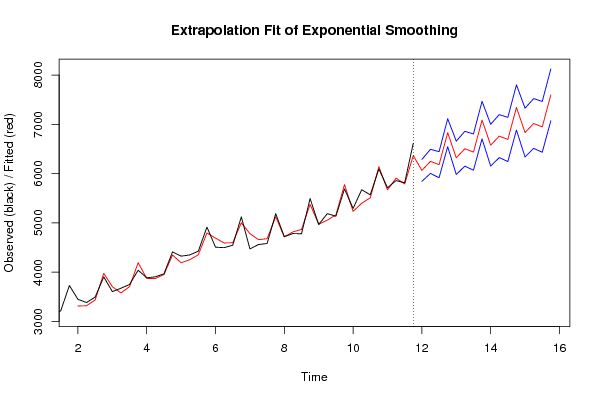
Extrapolation Forecasts of Exponential Smoothing
tForecast95% Lower Bound95% Upper Bound
456065.112326894015843.041865885426287.1827879026
466249.171697952796004.947512391886493.3958835137
476181.187848764185916.658803150646445.71689437773
486830.870322157486547.487578975167114.2530653398
496321.117326894015982.637606615016659.59704717301
506505.176697952796151.766618582556858.58677732303
516437.192848764196069.458097400116804.92760012826
527086.875322157486705.353356182887468.39728813208
536577.122326894016153.068376991717001.1762767963
546761.181697952796325.117579286677197.24581661891
556693.197848764196245.445597236197140.95010029218
567342.880322157486883.737379373097802.02326494187
576833.127326894016338.076840766267328.17781302176
587017.186697952796511.81045496587522.56294093978
596949.202848764196433.707640119177464.6980574092
607598.885322157487073.465991245218124.30465306975

\begin{tabular}{lllllllll}
\hline
Extrapolation Forecasts of Exponential Smoothing \tabularnewline
t & Forecast & 95% Lower Bound & 95% Upper Bound \tabularnewline
45 & 6065.11232689401 & 5843.04186588542 & 6287.1827879026 \tabularnewline
46 & 6249.17169795279 & 6004.94751239188 & 6493.3958835137 \tabularnewline
47 & 6181.18784876418 & 5916.65880315064 & 6445.71689437773 \tabularnewline
48 & 6830.87032215748 & 6547.48757897516 & 7114.2530653398 \tabularnewline
49 & 6321.11732689401 & 5982.63760661501 & 6659.59704717301 \tabularnewline
50 & 6505.17669795279 & 6151.76661858255 & 6858.58677732303 \tabularnewline
51 & 6437.19284876419 & 6069.45809740011 & 6804.92760012826 \tabularnewline
52 & 7086.87532215748 & 6705.35335618288 & 7468.39728813208 \tabularnewline
53 & 6577.12232689401 & 6153.06837699171 & 7001.1762767963 \tabularnewline
54 & 6761.18169795279 & 6325.11757928667 & 7197.24581661891 \tabularnewline
55 & 6693.19784876419 & 6245.44559723619 & 7140.95010029218 \tabularnewline
56 & 7342.88032215748 & 6883.73737937309 & 7802.02326494187 \tabularnewline
57 & 6833.12732689401 & 6338.07684076626 & 7328.17781302176 \tabularnewline
58 & 7017.18669795279 & 6511.8104549658 & 7522.56294093978 \tabularnewline
59 & 6949.20284876419 & 6433.70764011917 & 7464.6980574092 \tabularnewline
60 & 7598.88532215748 & 7073.46599124521 & 8124.30465306975 \tabularnewline
\hline
\end{tabular}
%Source: https://freestatistics.org/blog/index.php?pk=302753&T=3

[TABLE]
[ROW][C]Extrapolation Forecasts of Exponential Smoothing[/C][/ROW]
[ROW][C]t[/C][C]Forecast[/C][C]95% Lower Bound[/C][C]95% Upper Bound[/C][/ROW]
[ROW][C]45[/C][C]6065.11232689401[/C][C]5843.04186588542[/C][C]6287.1827879026[/C][/ROW]
[ROW][C]46[/C][C]6249.17169795279[/C][C]6004.94751239188[/C][C]6493.3958835137[/C][/ROW]
[ROW][C]47[/C][C]6181.18784876418[/C][C]5916.65880315064[/C][C]6445.71689437773[/C][/ROW]
[ROW][C]48[/C][C]6830.87032215748[/C][C]6547.48757897516[/C][C]7114.2530653398[/C][/ROW]
[ROW][C]49[/C][C]6321.11732689401[/C][C]5982.63760661501[/C][C]6659.59704717301[/C][/ROW]
[ROW][C]50[/C][C]6505.17669795279[/C][C]6151.76661858255[/C][C]6858.58677732303[/C][/ROW]
[ROW][C]51[/C][C]6437.19284876419[/C][C]6069.45809740011[/C][C]6804.92760012826[/C][/ROW]
[ROW][C]52[/C][C]7086.87532215748[/C][C]6705.35335618288[/C][C]7468.39728813208[/C][/ROW]
[ROW][C]53[/C][C]6577.12232689401[/C][C]6153.06837699171[/C][C]7001.1762767963[/C][/ROW]
[ROW][C]54[/C][C]6761.18169795279[/C][C]6325.11757928667[/C][C]7197.24581661891[/C][/ROW]
[ROW][C]55[/C][C]6693.19784876419[/C][C]6245.44559723619[/C][C]7140.95010029218[/C][/ROW]
[ROW][C]56[/C][C]7342.88032215748[/C][C]6883.73737937309[/C][C]7802.02326494187[/C][/ROW]
[ROW][C]57[/C][C]6833.12732689401[/C][C]6338.07684076626[/C][C]7328.17781302176[/C][/ROW]
[ROW][C]58[/C][C]7017.18669795279[/C][C]6511.8104549658[/C][C]7522.56294093978[/C][/ROW]
[ROW][C]59[/C][C]6949.20284876419[/C][C]6433.70764011917[/C][C]7464.6980574092[/C][/ROW]
[ROW][C]60[/C][C]7598.88532215748[/C][C]7073.46599124521[/C][C]8124.30465306975[/C][/ROW]
[/TABLE]
Source: https://freestatistics.org/blog/index.php?pk=302753&T=3

Globally Unique Identifier (entire table): ba.freestatistics.org/blog/index.php?pk=302753&T=3

As an alternative you can also use a QR Code:  

The GUIDs for individual cells are displayed in the table below:

Extrapolation Forecasts of Exponential Smoothing
tForecast95% Lower Bound95% Upper Bound
456065.112326894015843.041865885426287.1827879026
466249.171697952796004.947512391886493.3958835137
476181.187848764185916.658803150646445.71689437773
486830.870322157486547.487578975167114.2530653398
496321.117326894015982.637606615016659.59704717301
506505.176697952796151.766618582556858.58677732303
516437.192848764196069.458097400116804.92760012826
527086.875322157486705.353356182887468.39728813208
536577.122326894016153.068376991717001.1762767963
546761.181697952796325.117579286677197.24581661891
556693.197848764196245.445597236197140.95010029218
567342.880322157486883.737379373097802.02326494187
576833.127326894016338.076840766267328.17781302176
587017.186697952796511.81045496587522.56294093978
596949.202848764196433.707640119177464.6980574092
607598.885322157487073.465991245218124.30465306975


Parameters (Session):
par4 = 12 ;
Parameters (R input):
par1 = 4 ; par2 = Triple ; par3 = additive ; par4 = 16 ;
R code (references can be found in the software module):
par1 <- as.numeric(par1)
par4 <- as.numeric(par4)
if (par2 == 'Single') K <- 1
if (par2 == 'Double') K <- 2
if (par2 == 'Triple') K <- par1
nx <- length(x)
nxmK <- nx - K
x <- ts(x, frequency = par1)
if (par2 == 'Single') fit <- HoltWinters(x, gamma=F, beta=F)
if (par2 == 'Double') fit <- HoltWinters(x, gamma=F)
if (par2 == 'Triple') fit <- HoltWinters(x, seasonal=par3)
fit
myresid <- x - fit$fitted[,'xhat']
bitmap(file='test1.png')
op <- par(mfrow=c(2,1))
plot(fit,ylab='Observed (black) / Fitted (red)',main='Interpolation Fit of Exponential Smoothing')
plot(myresid,ylab='Residuals',main='Interpolation Prediction Errors')
par(op)
dev.off()
bitmap(file='test2.png')
p <- predict(fit, par4, prediction.interval=TRUE)
np <- length(p[,1])
plot(fit,p,ylab='Observed (black) / Fitted (red)',main='Extrapolation Fit of Exponential Smoothing')
dev.off()
bitmap(file='test3.png')
op <- par(mfrow = c(2,2))
acf(as.numeric(myresid),lag.max = nx/2,main='Residual ACF')
spectrum(myresid,main='Residals Periodogram')
cpgram(myresid,main='Residal Cumulative Periodogram')
qqnorm(myresid,main='Residual Normal QQ Plot')
qqline(myresid)
par(op)
dev.off()
load(file='createtable')
a<-table.start()
a<-table.row.start(a)
a<-table.element(a,'Estimated Parameters of Exponential Smoothing',2,TRUE)
a<-table.row.end(a)
a<-table.row.start(a)
a<-table.element(a,'Parameter',header=TRUE)
a<-table.element(a,'Value',header=TRUE)
a<-table.row.end(a)
a<-table.row.start(a)
a<-table.element(a,'alpha',header=TRUE)
a<-table.element(a,fit$alpha)
a<-table.row.end(a)
a<-table.row.start(a)
a<-table.element(a,'beta',header=TRUE)
a<-table.element(a,fit$beta)
a<-table.row.end(a)
a<-table.row.start(a)
a<-table.element(a,'gamma',header=TRUE)
a<-table.element(a,fit$gamma)
a<-table.row.end(a)
a<-table.end(a)
table.save(a,file='mytable.tab')
a<-table.start()
a<-table.row.start(a)
a<-table.element(a,'Interpolation Forecasts of Exponential Smoothing',4,TRUE)
a<-table.row.end(a)
a<-table.row.start(a)
a<-table.element(a,'t',header=TRUE)
a<-table.element(a,'Observed',header=TRUE)
a<-table.element(a,'Fitted',header=TRUE)
a<-table.element(a,'Residuals',header=TRUE)
a<-table.row.end(a)
for (i in 1:nxmK) {
a<-table.row.start(a)
a<-table.element(a,i+K,header=TRUE)
a<-table.element(a,x[i+K])
a<-table.element(a,fit$fitted[i,'xhat'])
a<-table.element(a,myresid[i])
a<-table.row.end(a)
}
a<-table.end(a)
table.save(a,file='mytable1.tab')
a<-table.start()
a<-table.row.start(a)
a<-table.element(a,'Extrapolation Forecasts of Exponential Smoothing',4,TRUE)
a<-table.row.end(a)
a<-table.row.start(a)
a<-table.element(a,'t',header=TRUE)
a<-table.element(a,'Forecast',header=TRUE)
a<-table.element(a,'95% Lower Bound',header=TRUE)
a<-table.element(a,'95% Upper Bound',header=TRUE)
a<-table.row.end(a)
for (i in 1:np) {
a<-table.row.start(a)
a<-table.element(a,nx+i,header=TRUE)
a<-table.element(a,p[i,'fit'])
a<-table.element(a,p[i,'lwr'])
a<-table.element(a,p[i,'upr'])
a<-table.row.end(a)
}
a<-table.end(a)
table.save(a,file='mytable2.tab')