Free Statistics

of Irreproducible Research!

Author's title

Author*The author of this computation has been verified*
R Software Modulerwasp_arimabackwardselection.wasp
Title produced by softwareARIMA Backward Selection
Date of computationMon, 19 Dec 2016 16:07:09 +0100
Cite this page as followsStatistical Computations at FreeStatistics.org, Office for Research Development and Education, URL https://freestatistics.org/blog/index.php?v=date/2016/Dec/19/t1482160073p6gbyyaewgnmm9z.htm/, Retrieved Sat, 18 May 2024 03:38:09 +0000
Statistical Computations at FreeStatistics.org, Office for Research Development and Education, URL https://freestatistics.org/blog/index.php?pk=301385, Retrieved Sat, 18 May 2024 03:38:09 +0000
QR Codes:

Original text written by user:
IsPrivate?No (this computation is public)
User-defined keywords
Estimated Impact62
Family? (F = Feedback message, R = changed R code, M = changed R Module, P = changed Parameters, D = changed Data)
-       [ARIMA Backward Selection] [arima backward 2582] [2016-12-19 15:07:09] [afe7f6443461a2cd6ee0b843643e84a9] [Current]
Feedback Forum

Post a new message
Dataseries X:
4028.8
4076.6
4125.8
4177.2
4183
4222.6
4255.8
4260.8
4279.2
4328.8
4356.6
4393
4419.4
4426.2
4467.2
4517.4
4517
4560.4
4589
4596
4621.2
4654.6
4708.6
4774.4
4824.8
4839
4869.8
4895.8
4895.8
4968.8
5010
5032.4
5054
5083.8
5117.4
5170.8
5182.2
5163.6
5212.6
5288
5303.4
5367.6
5433.8
5465.8
5493.8
5549.4
5590.2
5661.2
5699
5654.2
5671.8
5730.8
5693
5720.4
5747.8
5764.2
5783
5822.4
5836.2
5864.6
5913.4
5906.8
5954
6031.2
6011.2
6059.8
6091.6
6088
6082.2
6108
6151.4
6187
6190
6152.2
6183.8
6222.8
6165.8
6223.4
6292.8
6320.6
6344
6391.2
6443.4
6504
6520.2
6518.8
6563.8
6614
6555.6
6601.8
6632.4
6657.8
6674.4
6687
6697.6
6732
6736.4
6745.8
6805.2
6850.4
6807.2
6844.6
6850.8
6848.2
6837.8
6857.6
6900.8
6940.8
6937.4
6950.4
6978.8
6997.8
6934.8
6946.8
6956.2
6968.2


Summary of computational transaction
Raw Input view raw input (R code)
Raw Outputview raw output of R engine
Computing time3 seconds
R ServerBig Analytics Cloud Computing Center

\begin{tabular}{lllllllll}
\hline
Summary of computational transaction \tabularnewline
Raw Input view raw input (R code)  \tabularnewline
Raw Outputview raw output of R engine  \tabularnewline
Computing time3 seconds \tabularnewline
R ServerBig Analytics Cloud Computing Center \tabularnewline
\hline
\end{tabular}
%Source: https://freestatistics.org/blog/index.php?pk=301385&T=0

[TABLE]
[ROW]
Summary of computational transaction[/C][/ROW] [ROW]Raw Input[/C] view raw input (R code) [/C][/ROW] [ROW]Raw Output[/C]view raw output of R engine [/C][/ROW] [ROW]Computing time[/C]3 seconds[/C][/ROW] [ROW]R Server[/C]Big Analytics Cloud Computing Center[/C][/ROW] [/TABLE] Source: https://freestatistics.org/blog/index.php?pk=301385&T=0

Globally Unique Identifier (entire table): ba.freestatistics.org/blog/index.php?pk=301385&T=0

As an alternative you can also use a QR Code:  

The GUIDs for individual cells are displayed in the table below:

Summary of computational transaction
Raw Input view raw input (R code)
Raw Outputview raw output of R engine
Computing time3 seconds
R ServerBig Analytics Cloud Computing Center


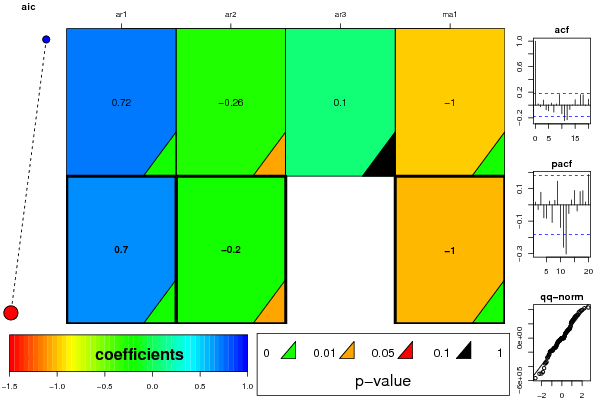
ARIMA Parameter Estimation and Backward Selection
Iterationar1ar2ar3ma1
Estimates ( 1 )0.7171-0.26330.0952-0.9996
(p-val)(0 )(0.0288 )(0.3437 )(0 )
Estimates ( 2 )0.697-0.19710-1.0003
(p-val)(0 )(0.0453 )(NA )(0 )
Estimates ( 3 )NANANANA
(p-val)(NA )(NA )(NA )(NA )
Estimates ( 4 )NANANANA
(p-val)(NA )(NA )(NA )(NA )
Estimates ( 5 )NANANANA
(p-val)(NA )(NA )(NA )(NA )
Estimates ( 6 )NANANANA
(p-val)(NA )(NA )(NA )(NA )
Estimates ( 7 )NANANANA
(p-val)(NA )(NA )(NA )(NA )

\begin{tabular}{lllllllll}
\hline
ARIMA Parameter Estimation and Backward Selection \tabularnewline
Iteration & ar1 & ar2 & ar3 & ma1 \tabularnewline
Estimates ( 1 ) & 0.7171 & -0.2633 & 0.0952 & -0.9996 \tabularnewline
(p-val) & (0 ) & (0.0288 ) & (0.3437 ) & (0 ) \tabularnewline
Estimates ( 2 ) & 0.697 & -0.1971 & 0 & -1.0003 \tabularnewline
(p-val) & (0 ) & (0.0453 ) & (NA ) & (0 ) \tabularnewline
Estimates ( 3 ) & NA & NA & NA & NA \tabularnewline
(p-val) & (NA ) & (NA ) & (NA ) & (NA ) \tabularnewline
Estimates ( 4 ) & NA & NA & NA & NA \tabularnewline
(p-val) & (NA ) & (NA ) & (NA ) & (NA ) \tabularnewline
Estimates ( 5 ) & NA & NA & NA & NA \tabularnewline
(p-val) & (NA ) & (NA ) & (NA ) & (NA ) \tabularnewline
Estimates ( 6 ) & NA & NA & NA & NA \tabularnewline
(p-val) & (NA ) & (NA ) & (NA ) & (NA ) \tabularnewline
Estimates ( 7 ) & NA & NA & NA & NA \tabularnewline
(p-val) & (NA ) & (NA ) & (NA ) & (NA ) \tabularnewline
\hline
\end{tabular}
%Source: https://freestatistics.org/blog/index.php?pk=301385&T=1

[TABLE]
[ROW][C]ARIMA Parameter Estimation and Backward Selection[/C][/ROW]
[ROW][C]Iteration[/C][C]ar1[/C][C]ar2[/C][C]ar3[/C][C]ma1[/C][/ROW]
[ROW][C]Estimates ( 1 )[/C][C]0.7171[/C][C]-0.2633[/C][C]0.0952[/C][C]-0.9996[/C][/ROW]
[ROW][C](p-val)[/C][C](0 )[/C][C](0.0288 )[/C][C](0.3437 )[/C][C](0 )[/C][/ROW]
[ROW][C]Estimates ( 2 )[/C][C]0.697[/C][C]-0.1971[/C][C]0[/C][C]-1.0003[/C][/ROW]
[ROW][C](p-val)[/C][C](0 )[/C][C](0.0453 )[/C][C](NA )[/C][C](0 )[/C][/ROW]
[ROW][C]Estimates ( 3 )[/C][C]NA[/C][C]NA[/C][C]NA[/C][C]NA[/C][/ROW]
[ROW][C](p-val)[/C][C](NA )[/C][C](NA )[/C][C](NA )[/C][C](NA )[/C][/ROW]
[ROW][C]Estimates ( 4 )[/C][C]NA[/C][C]NA[/C][C]NA[/C][C]NA[/C][/ROW]
[ROW][C](p-val)[/C][C](NA )[/C][C](NA )[/C][C](NA )[/C][C](NA )[/C][/ROW]
[ROW][C]Estimates ( 5 )[/C][C]NA[/C][C]NA[/C][C]NA[/C][C]NA[/C][/ROW]
[ROW][C](p-val)[/C][C](NA )[/C][C](NA )[/C][C](NA )[/C][C](NA )[/C][/ROW]
[ROW][C]Estimates ( 6 )[/C][C]NA[/C][C]NA[/C][C]NA[/C][C]NA[/C][/ROW]
[ROW][C](p-val)[/C][C](NA )[/C][C](NA )[/C][C](NA )[/C][C](NA )[/C][/ROW]
[ROW][C]Estimates ( 7 )[/C][C]NA[/C][C]NA[/C][C]NA[/C][C]NA[/C][/ROW]
[ROW][C](p-val)[/C][C](NA )[/C][C](NA )[/C][C](NA )[/C][C](NA )[/C][/ROW]
[/TABLE]
Source: https://freestatistics.org/blog/index.php?pk=301385&T=1

Globally Unique Identifier (entire table): ba.freestatistics.org/blog/index.php?pk=301385&T=1

As an alternative you can also use a QR Code:  

The GUIDs for individual cells are displayed in the table below:

ARIMA Parameter Estimation and Backward Selection
Iterationar1ar2ar3ma1
Estimates ( 1 )0.7171-0.26330.0952-0.9996
(p-val)(0 )(0.0288 )(0.3437 )(0 )
Estimates ( 2 )0.697-0.19710-1.0003
(p-val)(0 )(0.0453 )(NA )(0 )
Estimates ( 3 )NANANANA
(p-val)(NA )(NA )(NA )(NA )
Estimates ( 4 )NANANANA
(p-val)(NA )(NA )(NA )(NA )
Estimates ( 5 )NANANANA
(p-val)(NA )(NA )(NA )(NA )
Estimates ( 6 )NANANANA
(p-val)(NA )(NA )(NA )(NA )
Estimates ( 7 )NANANANA
(p-val)(NA )(NA )(NA )(NA )


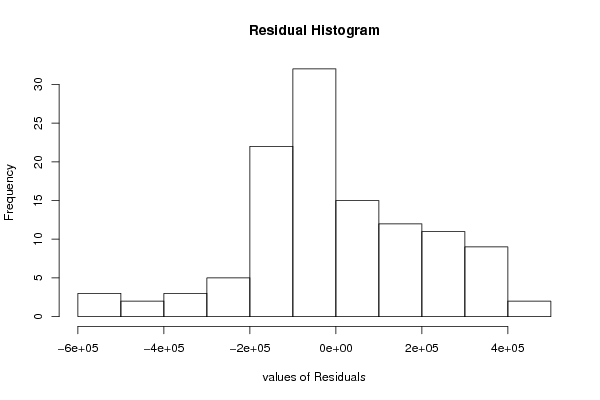
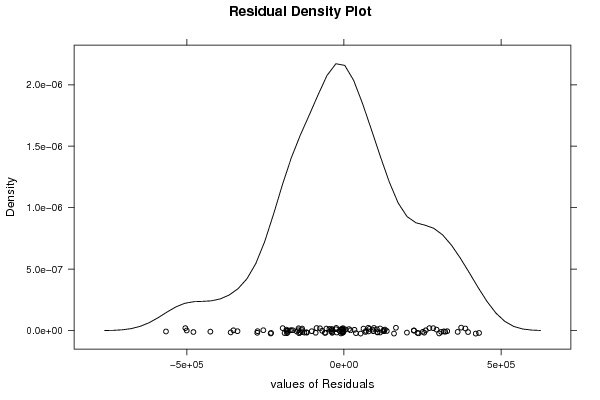
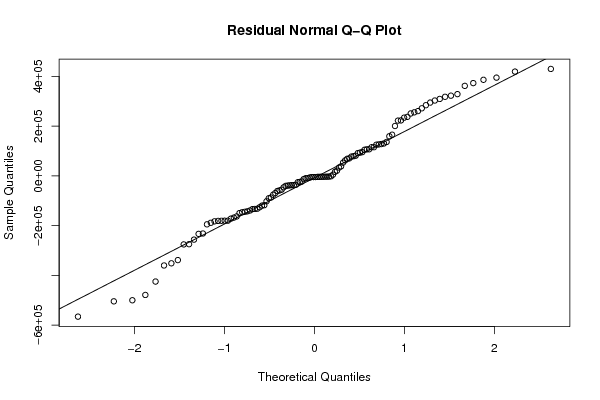
Estimated ARIMA Residuals
Value
33517.9357248135
251012.598337459
68730.6936459264
16182.7013619764
159436.550063256
-37857.0439343819
95480.1561444103
77521.1625811
-132041.191730192
386439.750294701
79084.0406611381
106731.931851647
-55721.2671676051
-87106.1509598148
-149674.932164654
125261.063995009
271926.318137798
-76014.6072490324
126568.041208365
-133704.266228613
20920.0583132954
-182780.336116609
38249.5829885014
-351630.842001098
-60696.1041104307
361997.572417591
328801.21806581
-146254.223953933
-37418.2687533835
309454.006284678
-133101.559634178
70322.4863797837
234108.529211605
-119657.171158685
222284.615725587
107070.366188102
-504573.758264678
-37185.2580728988
-22556.9280384119
-566211.613792202
53292.3576282978
-275703.751929294
91629.6596125169
-40145.8990489052
-89941.2903197414
-180365.303137232
-274773.883056872
430074.04905864
237327.478323316
136540.840030076
93492.3429987366
62313.7324031172
165549.554882085
-102236.347638544
-231758.936473866
-126053.035883143
-1596.40484262847
419476.534275928
-172074.400947294
-500235.264604165
-3206.86463205479
-35895.9742812432
-360356.239146273
-142393.694635746
373138.158517586
318039.392874728
130470.590704183
200598.577449183
81079.5223668035
-9425.84465467694
284281.920949514
-69043.4456010849
395039.288789223
-117986.246227546
128176.728960204
-188677.428158616
-39284.6663269767
-424997.289543308
294839.656093076
-181193.375871512
-338646.369293788
-233204.959999559
-45969.2208084711
-13103.4947522881
223063.530190353
105050.538594768
-144498.278592697
255675.813414905
-256382.577354514
-194844.765602362
-180231.585764004
-163092.112993529
303097.595320948
322552.477872713
-167992.360493285
-58530.7412405269
115276.408302296
-478915.261782372
-25463.3641811722
-139288.314732003
-180569.230067743
260595.995124036
115291.817841817

\begin{tabular}{lllllllll}
\hline
Estimated ARIMA Residuals \tabularnewline
Value \tabularnewline
33517.9357248135 \tabularnewline
251012.598337459 \tabularnewline
68730.6936459264 \tabularnewline
16182.7013619764 \tabularnewline
159436.550063256 \tabularnewline
-37857.0439343819 \tabularnewline
95480.1561444103 \tabularnewline
77521.1625811 \tabularnewline
-132041.191730192 \tabularnewline
386439.750294701 \tabularnewline
79084.0406611381 \tabularnewline
106731.931851647 \tabularnewline
-55721.2671676051 \tabularnewline
-87106.1509598148 \tabularnewline
-149674.932164654 \tabularnewline
125261.063995009 \tabularnewline
271926.318137798 \tabularnewline
-76014.6072490324 \tabularnewline
126568.041208365 \tabularnewline
-133704.266228613 \tabularnewline
20920.0583132954 \tabularnewline
-182780.336116609 \tabularnewline
38249.5829885014 \tabularnewline
-351630.842001098 \tabularnewline
-60696.1041104307 \tabularnewline
361997.572417591 \tabularnewline
328801.21806581 \tabularnewline
-146254.223953933 \tabularnewline
-37418.2687533835 \tabularnewline
309454.006284678 \tabularnewline
-133101.559634178 \tabularnewline
70322.4863797837 \tabularnewline
234108.529211605 \tabularnewline
-119657.171158685 \tabularnewline
222284.615725587 \tabularnewline
107070.366188102 \tabularnewline
-504573.758264678 \tabularnewline
-37185.2580728988 \tabularnewline
-22556.9280384119 \tabularnewline
-566211.613792202 \tabularnewline
53292.3576282978 \tabularnewline
-275703.751929294 \tabularnewline
91629.6596125169 \tabularnewline
-40145.8990489052 \tabularnewline
-89941.2903197414 \tabularnewline
-180365.303137232 \tabularnewline
-274773.883056872 \tabularnewline
430074.04905864 \tabularnewline
237327.478323316 \tabularnewline
136540.840030076 \tabularnewline
93492.3429987366 \tabularnewline
62313.7324031172 \tabularnewline
165549.554882085 \tabularnewline
-102236.347638544 \tabularnewline
-231758.936473866 \tabularnewline
-126053.035883143 \tabularnewline
-1596.40484262847 \tabularnewline
419476.534275928 \tabularnewline
-172074.400947294 \tabularnewline
-500235.264604165 \tabularnewline
-3206.86463205479 \tabularnewline
-35895.9742812432 \tabularnewline
-360356.239146273 \tabularnewline
-142393.694635746 \tabularnewline
373138.158517586 \tabularnewline
318039.392874728 \tabularnewline
130470.590704183 \tabularnewline
200598.577449183 \tabularnewline
81079.5223668035 \tabularnewline
-9425.84465467694 \tabularnewline
284281.920949514 \tabularnewline
-69043.4456010849 \tabularnewline
395039.288789223 \tabularnewline
-117986.246227546 \tabularnewline
128176.728960204 \tabularnewline
-188677.428158616 \tabularnewline
-39284.6663269767 \tabularnewline
-424997.289543308 \tabularnewline
294839.656093076 \tabularnewline
-181193.375871512 \tabularnewline
-338646.369293788 \tabularnewline
-233204.959999559 \tabularnewline
-45969.2208084711 \tabularnewline
-13103.4947522881 \tabularnewline
223063.530190353 \tabularnewline
105050.538594768 \tabularnewline
-144498.278592697 \tabularnewline
255675.813414905 \tabularnewline
-256382.577354514 \tabularnewline
-194844.765602362 \tabularnewline
-180231.585764004 \tabularnewline
-163092.112993529 \tabularnewline
303097.595320948 \tabularnewline
322552.477872713 \tabularnewline
-167992.360493285 \tabularnewline
-58530.7412405269 \tabularnewline
115276.408302296 \tabularnewline
-478915.261782372 \tabularnewline
-25463.3641811722 \tabularnewline
-139288.314732003 \tabularnewline
-180569.230067743 \tabularnewline
260595.995124036 \tabularnewline
115291.817841817 \tabularnewline
\hline
\end{tabular}
%Source: https://freestatistics.org/blog/index.php?pk=301385&T=2

[TABLE]
[ROW][C]Estimated ARIMA Residuals[/C][/ROW]
[ROW][C]Value[/C][/ROW]
[ROW][C]33517.9357248135[/C][/ROW]
[ROW][C]251012.598337459[/C][/ROW]
[ROW][C]68730.6936459264[/C][/ROW]
[ROW][C]16182.7013619764[/C][/ROW]
[ROW][C]159436.550063256[/C][/ROW]
[ROW][C]-37857.0439343819[/C][/ROW]
[ROW][C]95480.1561444103[/C][/ROW]
[ROW][C]77521.1625811[/C][/ROW]
[ROW][C]-132041.191730192[/C][/ROW]
[ROW][C]386439.750294701[/C][/ROW]
[ROW][C]79084.0406611381[/C][/ROW]
[ROW][C]106731.931851647[/C][/ROW]
[ROW][C]-55721.2671676051[/C][/ROW]
[ROW][C]-87106.1509598148[/C][/ROW]
[ROW][C]-149674.932164654[/C][/ROW]
[ROW][C]125261.063995009[/C][/ROW]
[ROW][C]271926.318137798[/C][/ROW]
[ROW][C]-76014.6072490324[/C][/ROW]
[ROW][C]126568.041208365[/C][/ROW]
[ROW][C]-133704.266228613[/C][/ROW]
[ROW][C]20920.0583132954[/C][/ROW]
[ROW][C]-182780.336116609[/C][/ROW]
[ROW][C]38249.5829885014[/C][/ROW]
[ROW][C]-351630.842001098[/C][/ROW]
[ROW][C]-60696.1041104307[/C][/ROW]
[ROW][C]361997.572417591[/C][/ROW]
[ROW][C]328801.21806581[/C][/ROW]
[ROW][C]-146254.223953933[/C][/ROW]
[ROW][C]-37418.2687533835[/C][/ROW]
[ROW][C]309454.006284678[/C][/ROW]
[ROW][C]-133101.559634178[/C][/ROW]
[ROW][C]70322.4863797837[/C][/ROW]
[ROW][C]234108.529211605[/C][/ROW]
[ROW][C]-119657.171158685[/C][/ROW]
[ROW][C]222284.615725587[/C][/ROW]
[ROW][C]107070.366188102[/C][/ROW]
[ROW][C]-504573.758264678[/C][/ROW]
[ROW][C]-37185.2580728988[/C][/ROW]
[ROW][C]-22556.9280384119[/C][/ROW]
[ROW][C]-566211.613792202[/C][/ROW]
[ROW][C]53292.3576282978[/C][/ROW]
[ROW][C]-275703.751929294[/C][/ROW]
[ROW][C]91629.6596125169[/C][/ROW]
[ROW][C]-40145.8990489052[/C][/ROW]
[ROW][C]-89941.2903197414[/C][/ROW]
[ROW][C]-180365.303137232[/C][/ROW]
[ROW][C]-274773.883056872[/C][/ROW]
[ROW][C]430074.04905864[/C][/ROW]
[ROW][C]237327.478323316[/C][/ROW]
[ROW][C]136540.840030076[/C][/ROW]
[ROW][C]93492.3429987366[/C][/ROW]
[ROW][C]62313.7324031172[/C][/ROW]
[ROW][C]165549.554882085[/C][/ROW]
[ROW][C]-102236.347638544[/C][/ROW]
[ROW][C]-231758.936473866[/C][/ROW]
[ROW][C]-126053.035883143[/C][/ROW]
[ROW][C]-1596.40484262847[/C][/ROW]
[ROW][C]419476.534275928[/C][/ROW]
[ROW][C]-172074.400947294[/C][/ROW]
[ROW][C]-500235.264604165[/C][/ROW]
[ROW][C]-3206.86463205479[/C][/ROW]
[ROW][C]-35895.9742812432[/C][/ROW]
[ROW][C]-360356.239146273[/C][/ROW]
[ROW][C]-142393.694635746[/C][/ROW]
[ROW][C]373138.158517586[/C][/ROW]
[ROW][C]318039.392874728[/C][/ROW]
[ROW][C]130470.590704183[/C][/ROW]
[ROW][C]200598.577449183[/C][/ROW]
[ROW][C]81079.5223668035[/C][/ROW]
[ROW][C]-9425.84465467694[/C][/ROW]
[ROW][C]284281.920949514[/C][/ROW]
[ROW][C]-69043.4456010849[/C][/ROW]
[ROW][C]395039.288789223[/C][/ROW]
[ROW][C]-117986.246227546[/C][/ROW]
[ROW][C]128176.728960204[/C][/ROW]
[ROW][C]-188677.428158616[/C][/ROW]
[ROW][C]-39284.6663269767[/C][/ROW]
[ROW][C]-424997.289543308[/C][/ROW]
[ROW][C]294839.656093076[/C][/ROW]
[ROW][C]-181193.375871512[/C][/ROW]
[ROW][C]-338646.369293788[/C][/ROW]
[ROW][C]-233204.959999559[/C][/ROW]
[ROW][C]-45969.2208084711[/C][/ROW]
[ROW][C]-13103.4947522881[/C][/ROW]
[ROW][C]223063.530190353[/C][/ROW]
[ROW][C]105050.538594768[/C][/ROW]
[ROW][C]-144498.278592697[/C][/ROW]
[ROW][C]255675.813414905[/C][/ROW]
[ROW][C]-256382.577354514[/C][/ROW]
[ROW][C]-194844.765602362[/C][/ROW]
[ROW][C]-180231.585764004[/C][/ROW]
[ROW][C]-163092.112993529[/C][/ROW]
[ROW][C]303097.595320948[/C][/ROW]
[ROW][C]322552.477872713[/C][/ROW]
[ROW][C]-167992.360493285[/C][/ROW]
[ROW][C]-58530.7412405269[/C][/ROW]
[ROW][C]115276.408302296[/C][/ROW]
[ROW][C]-478915.261782372[/C][/ROW]
[ROW][C]-25463.3641811722[/C][/ROW]
[ROW][C]-139288.314732003[/C][/ROW]
[ROW][C]-180569.230067743[/C][/ROW]
[ROW][C]260595.995124036[/C][/ROW]
[ROW][C]115291.817841817[/C][/ROW]
[/TABLE]
Source: https://freestatistics.org/blog/index.php?pk=301385&T=2

Globally Unique Identifier (entire table): ba.freestatistics.org/blog/index.php?pk=301385&T=2

As an alternative you can also use a QR Code:  

The GUIDs for individual cells are displayed in the table below:

Estimated ARIMA Residuals
Value
33517.9357248135
251012.598337459
68730.6936459264
16182.7013619764
159436.550063256
-37857.0439343819
95480.1561444103
77521.1625811
-132041.191730192
386439.750294701
79084.0406611381
106731.931851647
-55721.2671676051
-87106.1509598148
-149674.932164654
125261.063995009
271926.318137798
-76014.6072490324
126568.041208365
-133704.266228613
20920.0583132954
-182780.336116609
38249.5829885014
-351630.842001098
-60696.1041104307
361997.572417591
328801.21806581
-146254.223953933
-37418.2687533835
309454.006284678
-133101.559634178
70322.4863797837
234108.529211605
-119657.171158685
222284.615725587
107070.366188102
-504573.758264678
-37185.2580728988
-22556.9280384119
-566211.613792202
53292.3576282978
-275703.751929294
91629.6596125169
-40145.8990489052
-89941.2903197414
-180365.303137232
-274773.883056872
430074.04905864
237327.478323316
136540.840030076
93492.3429987366
62313.7324031172
165549.554882085
-102236.347638544
-231758.936473866
-126053.035883143
-1596.40484262847
419476.534275928
-172074.400947294
-500235.264604165
-3206.86463205479
-35895.9742812432
-360356.239146273
-142393.694635746
373138.158517586
318039.392874728
130470.590704183
200598.577449183
81079.5223668035
-9425.84465467694
284281.920949514
-69043.4456010849
395039.288789223
-117986.246227546
128176.728960204
-188677.428158616
-39284.6663269767
-424997.289543308
294839.656093076
-181193.375871512
-338646.369293788
-233204.959999559
-45969.2208084711
-13103.4947522881
223063.530190353
105050.538594768
-144498.278592697
255675.813414905
-256382.577354514
-194844.765602362
-180231.585764004
-163092.112993529
303097.595320948
322552.477872713
-167992.360493285
-58530.7412405269
115276.408302296
-478915.261782372
-25463.3641811722
-139288.314732003
-180569.230067743
260595.995124036
115291.817841817


Parameters (Session):
Parameters (R input):
par1 = FALSE ; par2 = 2.0 ; par3 = 2 ; par4 = 1 ; par5 = 12 ; par6 = 3 ; par7 = 1 ; par8 = 0 ; par9 = 0 ;
R code (references can be found in the software module):
par9 <- '1'
par8 <- '2'
par7 <- '1'
par6 <- '3'
par5 <- '12'
par4 <- '1'
par3 <- '2'
par2 <- '2.0'
par1 <- 'FALSE'
library(lattice)
if (par1 == 'TRUE') par1 <- TRUE
if (par1 == 'FALSE') par1 <- FALSE
par2 <- as.numeric(par2) #Box-Cox lambda transformation parameter
par3 <- as.numeric(par3) #degree of non-seasonal differencing
par4 <- as.numeric(par4) #degree of seasonal differencing
par5 <- as.numeric(par5) #seasonal period
par6 <- as.numeric(par6) #degree (p) of the non-seasonal AR(p) polynomial
par7 <- as.numeric(par7) #degree (q) of the non-seasonal MA(q) polynomial
par8 <- as.numeric(par8) #degree (P) of the seasonal AR(P) polynomial
par9 <- as.numeric(par9) #degree (Q) of the seasonal MA(Q) polynomial
armaGR <- function(arima.out, names, n){
try1 <- arima.out$coef
try2 <- sqrt(diag(arima.out$var.coef))
try.data.frame <- data.frame(matrix(NA,ncol=4,nrow=length(names)))
dimnames(try.data.frame) <- list(names,c('coef','std','tstat','pv'))
try.data.frame[,1] <- try1
for(i in 1:length(try2)) try.data.frame[which(rownames(try.data.frame)==names(try2)[i]),2] <- try2[i]
try.data.frame[,3] <- try.data.frame[,1] / try.data.frame[,2]
try.data.frame[,4] <- round((1-pt(abs(try.data.frame[,3]),df=n-(length(try2)+1)))*2,5)
vector <- rep(NA,length(names))
vector[is.na(try.data.frame[,4])] <- 0
maxi <- which.max(try.data.frame[,4])
continue <- max(try.data.frame[,4],na.rm=TRUE) > .05
vector[maxi] <- 0
list(summary=try.data.frame,next.vector=vector,continue=continue)
}
arimaSelect <- function(series, order=c(13,0,0), seasonal=list(order=c(2,0,0),period=12), include.mean=F){
nrc <- order[1]+order[3]+seasonal$order[1]+seasonal$order[3]
coeff <- matrix(NA, nrow=nrc*2, ncol=nrc)
pval <- matrix(NA, nrow=nrc*2, ncol=nrc)
mylist <- rep(list(NULL), nrc)
names <- NULL
if(order[1] > 0) names <- paste('ar',1:order[1],sep='')
if(order[3] > 0) names <- c( names , paste('ma',1:order[3],sep='') )
if(seasonal$order[1] > 0) names <- c(names, paste('sar',1:seasonal$order[1],sep=''))
if(seasonal$order[3] > 0) names <- c(names, paste('sma',1:seasonal$order[3],sep=''))
arima.out <- arima(series, order=order, seasonal=seasonal, include.mean=include.mean, method='ML')
mylist[[1]] <- arima.out
last.arma <- armaGR(arima.out, names, length(series))
mystop <- FALSE
i <- 1
coeff[i,] <- last.arma[[1]][,1]
pval [i,] <- last.arma[[1]][,4]
i <- 2
aic <- arima.out$aic
while(!mystop){
mylist[[i]] <- arima.out
arima.out <- arima(series, order=order, seasonal=seasonal, include.mean=include.mean, method='ML', fixed=last.arma$next.vector)
aic <- c(aic, arima.out$aic)
last.arma <- armaGR(arima.out, names, length(series))
mystop <- !last.arma$continue
coeff[i,] <- last.arma[[1]][,1]
pval [i,] <- last.arma[[1]][,4]
i <- i+1
}
list(coeff, pval, mylist, aic=aic)
}
arimaSelectplot <- function(arimaSelect.out,noms,choix){
noms <- names(arimaSelect.out[[3]][[1]]$coef)
coeff <- arimaSelect.out[[1]]
k <- min(which(is.na(coeff[,1])))-1
coeff <- coeff[1:k,]
pval <- arimaSelect.out[[2]][1:k,]
aic <- arimaSelect.out$aic[1:k]
coeff[coeff==0] <- NA
n <- ncol(coeff)
if(missing(choix)) choix <- k
layout(matrix(c(1,1,1,2,
3,3,3,2,
3,3,3,4,
5,6,7,7),nr=4),
widths=c(10,35,45,15),
heights=c(30,30,15,15))
couleurs <- rainbow(75)[1:50]#(50)
ticks <- pretty(coeff)
par(mar=c(1,1,3,1))
plot(aic,k:1-.5,type='o',pch=21,bg='blue',cex=2,axes=F,lty=2,xpd=NA)
points(aic[choix],k-choix+.5,pch=21,cex=4,bg=2,xpd=NA)
title('aic',line=2)
par(mar=c(3,0,0,0))
plot(0,axes=F,xlab='',ylab='',xlim=range(ticks),ylim=c(.1,1))
rect(xleft = min(ticks) + (0:49)/50*(max(ticks)-min(ticks)),
xright = min(ticks) + (1:50)/50*(max(ticks)-min(ticks)),
ytop = rep(1,50),
ybottom= rep(0,50),col=couleurs,border=NA)
axis(1,ticks)
rect(xleft=min(ticks),xright=max(ticks),ytop=1,ybottom=0)
text(mean(coeff,na.rm=T),.5,'coefficients',cex=2,font=2)
par(mar=c(1,1,3,1))
image(1:n,1:k,t(coeff[k:1,]),axes=F,col=couleurs,zlim=range(ticks))
for(i in 1:n) for(j in 1:k) if(!is.na(coeff[j,i])) {
if(pval[j,i]<.01) symb = 'green'
else if( (pval[j,i]<.05) & (pval[j,i]>=.01)) symb = 'orange'
else if( (pval[j,i]<.1) & (pval[j,i]>=.05)) symb = 'red'
else symb = 'black'
polygon(c(i+.5 ,i+.2 ,i+.5 ,i+.5),
c(k-j+0.5,k-j+0.5,k-j+0.8,k-j+0.5),
col=symb)
if(j==choix) {
rect(xleft=i-.5,
xright=i+.5,
ybottom=k-j+1.5,
ytop=k-j+.5,
lwd=4)
text(i,
k-j+1,
round(coeff[j,i],2),
cex=1.2,
font=2)
}
else{
rect(xleft=i-.5,xright=i+.5,ybottom=k-j+1.5,ytop=k-j+.5)
text(i,k-j+1,round(coeff[j,i],2),cex=1.2,font=1)
}
}
axis(3,1:n,noms)
par(mar=c(0.5,0,0,0.5))
plot(0,axes=F,xlab='',ylab='',type='n',xlim=c(0,8),ylim=c(-.2,.8))
cols <- c('green','orange','red','black')
niv <- c('0','0.01','0.05','0.1')
for(i in 0:3){
polygon(c(1+2*i ,1+2*i ,1+2*i-.5 ,1+2*i),
c(.4 ,.7 , .4 , .4),
col=cols[i+1])
text(2*i,0.5,niv[i+1],cex=1.5)
}
text(8,.5,1,cex=1.5)
text(4,0,'p-value',cex=2)
box()
residus <- arimaSelect.out[[3]][[choix]]$res
par(mar=c(1,2,4,1))
acf(residus,main='')
title('acf',line=.5)
par(mar=c(1,2,4,1))
pacf(residus,main='')
title('pacf',line=.5)
par(mar=c(2,2,4,1))
qqnorm(residus,main='')
title('qq-norm',line=.5)
qqline(residus)
residus
}
if (par2 == 0) x <- log(x)
if (par2 != 0) x <- x^par2
(selection <- arimaSelect(x, order=c(par6,par3,par7), seasonal=list(order=c(par8,par4,par9), period=par5)))
bitmap(file='test1.png')
resid <- arimaSelectplot(selection)
dev.off()
resid
bitmap(file='test2.png')
acf(resid,length(resid)/2, main='Residual Autocorrelation Function')
dev.off()
bitmap(file='test3.png')
pacf(resid,length(resid)/2, main='Residual Partial Autocorrelation Function')
dev.off()
bitmap(file='test4.png')
cpgram(resid, main='Residual Cumulative Periodogram')
dev.off()
bitmap(file='test5.png')
hist(resid, main='Residual Histogram', xlab='values of Residuals')
dev.off()
bitmap(file='test6.png')
densityplot(~resid,col='black',main='Residual Density Plot', xlab='values of Residuals')
dev.off()
bitmap(file='test7.png')
qqnorm(resid, main='Residual Normal Q-Q Plot')
qqline(resid)
dev.off()
ncols <- length(selection[[1]][1,])
nrows <- length(selection[[2]][,1])-1
load(file='createtable')
a<-table.start()
a<-table.row.start(a)
a<-table.element(a,'ARIMA Parameter Estimation and Backward Selection', ncols+1,TRUE)
a<-table.row.end(a)
a<-table.row.start(a)
a<-table.element(a,'Iteration', header=TRUE)
for (i in 1:ncols) {
a<-table.element(a,names(selection[[3]][[1]]$coef)[i],header=TRUE)
}
a<-table.row.end(a)
for (j in 1:nrows) {
a<-table.row.start(a)
mydum <- 'Estimates ('
mydum <- paste(mydum,j)
mydum <- paste(mydum,')')
a<-table.element(a,mydum, header=TRUE)
for (i in 1:ncols) {
a<-table.element(a,round(selection[[1]][j,i],4))
}
a<-table.row.end(a)
a<-table.row.start(a)
a<-table.element(a,'(p-val)', header=TRUE)
for (i in 1:ncols) {
mydum <- '('
mydum <- paste(mydum,round(selection[[2]][j,i],4),sep='')
mydum <- paste(mydum,')')
a<-table.element(a,mydum)
}
a<-table.row.end(a)
}
a<-table.end(a)
table.save(a,file='mytable.tab')
a<-table.start()
a<-table.row.start(a)
a<-table.element(a,'Estimated ARIMA Residuals', 1,TRUE)
a<-table.row.end(a)
a<-table.row.start(a)
a<-table.element(a,'Value', 1,TRUE)
a<-table.row.end(a)
for (i in (par4*par5+par3):length(resid)) {
a<-table.row.start(a)
a<-table.element(a,resid[i])
a<-table.row.end(a)
}
a<-table.end(a)
table.save(a,file='mytable1.tab')