Free Statistics

of Irreproducible Research!

Author's title

Author*Unverified author*
R Software Modulerwasp_decompose.wasp
Title produced by softwareClassical Decomposition
Date of computationMon, 19 Dec 2016 16:04:40 +0100
Cite this page as followsStatistical Computations at FreeStatistics.org, Office for Research Development and Education, URL https://freestatistics.org/blog/index.php?v=date/2016/Dec/19/t14821600056ed6eeveqmg4awp.htm/, Retrieved Sat, 18 May 2024 00:10:51 +0000
Statistical Computations at FreeStatistics.org, Office for Research Development and Education, URL https://freestatistics.org/blog/index.php?pk=301382, Retrieved Sat, 18 May 2024 00:10:51 +0000
QR Codes:

Original text written by user:
IsPrivate?No (this computation is public)
User-defined keywords
Estimated Impact72
Family? (F = Feedback message, R = changed R code, M = changed R Module, P = changed Parameters, D = changed Data)
-       [Classical Decomposition] [Classical Decompo...] [2016-12-19 15:04:40] [d41d8cd98f00b204e9800998ecf8427e] [Current]
Feedback Forum

Post a new message
Dataseries X:
3329.04
3170
2555.12
2221.44
3618.64
3504.4
2757.28
2687.6
3709.68
3771.44
2792.56
2930.24
3751.76
3631.92
2789.2
3158.24
4548.96
4191.36
3088.96
3480.16
4703.44
4584.64
3496.16
4215.52
4250.48
4779.6
3626.24
4571.44
5091.04
5398.24
4272.56
5206.56
5318.8
6039.76
4922.24
5694.64
5940.88
4937.92
4710.32
6057.2
5401.6


Summary of computational transaction
Raw Input view raw input (R code)
Raw Outputview raw output of R engine
Computing time2 seconds
R ServerBig Analytics Cloud Computing Center

\begin{tabular}{lllllllll}
\hline
Summary of computational transaction \tabularnewline
Raw Input view raw input (R code)  \tabularnewline
Raw Outputview raw output of R engine  \tabularnewline
Computing time2 seconds \tabularnewline
R ServerBig Analytics Cloud Computing Center \tabularnewline
\hline
\end{tabular}
%Source: https://freestatistics.org/blog/index.php?pk=301382&T=0

[TABLE]
[ROW]
Summary of computational transaction[/C][/ROW] [ROW]Raw Input[/C] view raw input (R code) [/C][/ROW] [ROW]Raw Output[/C]view raw output of R engine [/C][/ROW] [ROW]Computing time[/C]2 seconds[/C][/ROW] [ROW]R Server[/C]Big Analytics Cloud Computing Center[/C][/ROW] [/TABLE] Source: https://freestatistics.org/blog/index.php?pk=301382&T=0

Globally Unique Identifier (entire table): ba.freestatistics.org/blog/index.php?pk=301382&T=0

As an alternative you can also use a QR Code:  

The GUIDs for individual cells are displayed in the table below:

Summary of computational transaction
Raw Input view raw input (R code)
Raw Outputview raw output of R engine
Computing time2 seconds
R ServerBig Analytics Cloud Computing Center


Classical Decomposition by Moving Averages
tObservationsFitTrendSeasonalRandom
13329.04NANA141.61NA
23170NANA262.203NA
32555.12NANA-821.838NA
42221.44NANA-245.498NA
53618.64NANA618.037NA
63504.4NANA490.877NA
72757.282506.673104.9-598.232250.612
82687.62901.23141.76-240.555-213.605
93709.683661.583170.76490.82448.0963
103771.443848.473219.55628.923-77.0293
112792.562786.63297.34-510.7425.95847
122930.243149.123364.73-215.607-218.883
133751.763548.783407.17141.61202.977
143631.923716.223454.02262.203-84.2999
152789.22706.613528.45-821.83882.5918
163158.243358.243603.74-245.498-199.998
174548.964284.973666.94618.037263.987
184191.364240.683749.81490.877-49.3232
193088.963225.913824.14-598.232-136.948
203480.163652.183892.74-240.555-172.025
214703.444466.263975.44490.824237.18
224584.644698.124069.2628.923-113.479
233496.163639.924150.67-510.742-143.765
244215.524007.934223.54-215.607207.587
254250.484464.754323.14141.61-214.273
264779.64706.64444.39262.20373.0035
273626.243720.134541.97-821.838-93.8882
284571.444382.744628.24-245.498188.702
295091.045366.324748.29618.037-275.283
305398.245360.214869.34490.87738.0268
314272.564403.175001.4-598.232-130.608
325206.564837.875078.43-240.555368.685
335318.85621.025130.2490.824-302.22
346039.765866.25237.27628.923173.564
354922.244801.385312.12-510.742120.862
365694.64NANA-215.607NA
375940.88NANA141.61NA
384937.92NANA262.203NA
394710.32NANA-821.838NA
406057.2NANA-245.498NA
415401.6NANA618.037NA

\begin{tabular}{lllllllll}
\hline
Classical Decomposition by Moving Averages \tabularnewline
t & Observations & Fit & Trend & Seasonal & Random \tabularnewline
1 & 3329.04 & NA & NA & 141.61 & NA \tabularnewline
2 & 3170 & NA & NA & 262.203 & NA \tabularnewline
3 & 2555.12 & NA & NA & -821.838 & NA \tabularnewline
4 & 2221.44 & NA & NA & -245.498 & NA \tabularnewline
5 & 3618.64 & NA & NA & 618.037 & NA \tabularnewline
6 & 3504.4 & NA & NA & 490.877 & NA \tabularnewline
7 & 2757.28 & 2506.67 & 3104.9 & -598.232 & 250.612 \tabularnewline
8 & 2687.6 & 2901.2 & 3141.76 & -240.555 & -213.605 \tabularnewline
9 & 3709.68 & 3661.58 & 3170.76 & 490.824 & 48.0963 \tabularnewline
10 & 3771.44 & 3848.47 & 3219.55 & 628.923 & -77.0293 \tabularnewline
11 & 2792.56 & 2786.6 & 3297.34 & -510.742 & 5.95847 \tabularnewline
12 & 2930.24 & 3149.12 & 3364.73 & -215.607 & -218.883 \tabularnewline
13 & 3751.76 & 3548.78 & 3407.17 & 141.61 & 202.977 \tabularnewline
14 & 3631.92 & 3716.22 & 3454.02 & 262.203 & -84.2999 \tabularnewline
15 & 2789.2 & 2706.61 & 3528.45 & -821.838 & 82.5918 \tabularnewline
16 & 3158.24 & 3358.24 & 3603.74 & -245.498 & -199.998 \tabularnewline
17 & 4548.96 & 4284.97 & 3666.94 & 618.037 & 263.987 \tabularnewline
18 & 4191.36 & 4240.68 & 3749.81 & 490.877 & -49.3232 \tabularnewline
19 & 3088.96 & 3225.91 & 3824.14 & -598.232 & -136.948 \tabularnewline
20 & 3480.16 & 3652.18 & 3892.74 & -240.555 & -172.025 \tabularnewline
21 & 4703.44 & 4466.26 & 3975.44 & 490.824 & 237.18 \tabularnewline
22 & 4584.64 & 4698.12 & 4069.2 & 628.923 & -113.479 \tabularnewline
23 & 3496.16 & 3639.92 & 4150.67 & -510.742 & -143.765 \tabularnewline
24 & 4215.52 & 4007.93 & 4223.54 & -215.607 & 207.587 \tabularnewline
25 & 4250.48 & 4464.75 & 4323.14 & 141.61 & -214.273 \tabularnewline
26 & 4779.6 & 4706.6 & 4444.39 & 262.203 & 73.0035 \tabularnewline
27 & 3626.24 & 3720.13 & 4541.97 & -821.838 & -93.8882 \tabularnewline
28 & 4571.44 & 4382.74 & 4628.24 & -245.498 & 188.702 \tabularnewline
29 & 5091.04 & 5366.32 & 4748.29 & 618.037 & -275.283 \tabularnewline
30 & 5398.24 & 5360.21 & 4869.34 & 490.877 & 38.0268 \tabularnewline
31 & 4272.56 & 4403.17 & 5001.4 & -598.232 & -130.608 \tabularnewline
32 & 5206.56 & 4837.87 & 5078.43 & -240.555 & 368.685 \tabularnewline
33 & 5318.8 & 5621.02 & 5130.2 & 490.824 & -302.22 \tabularnewline
34 & 6039.76 & 5866.2 & 5237.27 & 628.923 & 173.564 \tabularnewline
35 & 4922.24 & 4801.38 & 5312.12 & -510.742 & 120.862 \tabularnewline
36 & 5694.64 & NA & NA & -215.607 & NA \tabularnewline
37 & 5940.88 & NA & NA & 141.61 & NA \tabularnewline
38 & 4937.92 & NA & NA & 262.203 & NA \tabularnewline
39 & 4710.32 & NA & NA & -821.838 & NA \tabularnewline
40 & 6057.2 & NA & NA & -245.498 & NA \tabularnewline
41 & 5401.6 & NA & NA & 618.037 & NA \tabularnewline
\hline
\end{tabular}
%Source: https://freestatistics.org/blog/index.php?pk=301382&T=1

[TABLE]
[ROW][C]Classical Decomposition by Moving Averages[/C][/ROW]
[ROW][C]t[/C][C]Observations[/C][C]Fit[/C][C]Trend[/C][C]Seasonal[/C][C]Random[/C][/ROW]
[ROW][C]1[/C][C]3329.04[/C][C]NA[/C][C]NA[/C][C]141.61[/C][C]NA[/C][/ROW]
[ROW][C]2[/C][C]3170[/C][C]NA[/C][C]NA[/C][C]262.203[/C][C]NA[/C][/ROW]
[ROW][C]3[/C][C]2555.12[/C][C]NA[/C][C]NA[/C][C]-821.838[/C][C]NA[/C][/ROW]
[ROW][C]4[/C][C]2221.44[/C][C]NA[/C][C]NA[/C][C]-245.498[/C][C]NA[/C][/ROW]
[ROW][C]5[/C][C]3618.64[/C][C]NA[/C][C]NA[/C][C]618.037[/C][C]NA[/C][/ROW]
[ROW][C]6[/C][C]3504.4[/C][C]NA[/C][C]NA[/C][C]490.877[/C][C]NA[/C][/ROW]
[ROW][C]7[/C][C]2757.28[/C][C]2506.67[/C][C]3104.9[/C][C]-598.232[/C][C]250.612[/C][/ROW]
[ROW][C]8[/C][C]2687.6[/C][C]2901.2[/C][C]3141.76[/C][C]-240.555[/C][C]-213.605[/C][/ROW]
[ROW][C]9[/C][C]3709.68[/C][C]3661.58[/C][C]3170.76[/C][C]490.824[/C][C]48.0963[/C][/ROW]
[ROW][C]10[/C][C]3771.44[/C][C]3848.47[/C][C]3219.55[/C][C]628.923[/C][C]-77.0293[/C][/ROW]
[ROW][C]11[/C][C]2792.56[/C][C]2786.6[/C][C]3297.34[/C][C]-510.742[/C][C]5.95847[/C][/ROW]
[ROW][C]12[/C][C]2930.24[/C][C]3149.12[/C][C]3364.73[/C][C]-215.607[/C][C]-218.883[/C][/ROW]
[ROW][C]13[/C][C]3751.76[/C][C]3548.78[/C][C]3407.17[/C][C]141.61[/C][C]202.977[/C][/ROW]
[ROW][C]14[/C][C]3631.92[/C][C]3716.22[/C][C]3454.02[/C][C]262.203[/C][C]-84.2999[/C][/ROW]
[ROW][C]15[/C][C]2789.2[/C][C]2706.61[/C][C]3528.45[/C][C]-821.838[/C][C]82.5918[/C][/ROW]
[ROW][C]16[/C][C]3158.24[/C][C]3358.24[/C][C]3603.74[/C][C]-245.498[/C][C]-199.998[/C][/ROW]
[ROW][C]17[/C][C]4548.96[/C][C]4284.97[/C][C]3666.94[/C][C]618.037[/C][C]263.987[/C][/ROW]
[ROW][C]18[/C][C]4191.36[/C][C]4240.68[/C][C]3749.81[/C][C]490.877[/C][C]-49.3232[/C][/ROW]
[ROW][C]19[/C][C]3088.96[/C][C]3225.91[/C][C]3824.14[/C][C]-598.232[/C][C]-136.948[/C][/ROW]
[ROW][C]20[/C][C]3480.16[/C][C]3652.18[/C][C]3892.74[/C][C]-240.555[/C][C]-172.025[/C][/ROW]
[ROW][C]21[/C][C]4703.44[/C][C]4466.26[/C][C]3975.44[/C][C]490.824[/C][C]237.18[/C][/ROW]
[ROW][C]22[/C][C]4584.64[/C][C]4698.12[/C][C]4069.2[/C][C]628.923[/C][C]-113.479[/C][/ROW]
[ROW][C]23[/C][C]3496.16[/C][C]3639.92[/C][C]4150.67[/C][C]-510.742[/C][C]-143.765[/C][/ROW]
[ROW][C]24[/C][C]4215.52[/C][C]4007.93[/C][C]4223.54[/C][C]-215.607[/C][C]207.587[/C][/ROW]
[ROW][C]25[/C][C]4250.48[/C][C]4464.75[/C][C]4323.14[/C][C]141.61[/C][C]-214.273[/C][/ROW]
[ROW][C]26[/C][C]4779.6[/C][C]4706.6[/C][C]4444.39[/C][C]262.203[/C][C]73.0035[/C][/ROW]
[ROW][C]27[/C][C]3626.24[/C][C]3720.13[/C][C]4541.97[/C][C]-821.838[/C][C]-93.8882[/C][/ROW]
[ROW][C]28[/C][C]4571.44[/C][C]4382.74[/C][C]4628.24[/C][C]-245.498[/C][C]188.702[/C][/ROW]
[ROW][C]29[/C][C]5091.04[/C][C]5366.32[/C][C]4748.29[/C][C]618.037[/C][C]-275.283[/C][/ROW]
[ROW][C]30[/C][C]5398.24[/C][C]5360.21[/C][C]4869.34[/C][C]490.877[/C][C]38.0268[/C][/ROW]
[ROW][C]31[/C][C]4272.56[/C][C]4403.17[/C][C]5001.4[/C][C]-598.232[/C][C]-130.608[/C][/ROW]
[ROW][C]32[/C][C]5206.56[/C][C]4837.87[/C][C]5078.43[/C][C]-240.555[/C][C]368.685[/C][/ROW]
[ROW][C]33[/C][C]5318.8[/C][C]5621.02[/C][C]5130.2[/C][C]490.824[/C][C]-302.22[/C][/ROW]
[ROW][C]34[/C][C]6039.76[/C][C]5866.2[/C][C]5237.27[/C][C]628.923[/C][C]173.564[/C][/ROW]
[ROW][C]35[/C][C]4922.24[/C][C]4801.38[/C][C]5312.12[/C][C]-510.742[/C][C]120.862[/C][/ROW]
[ROW][C]36[/C][C]5694.64[/C][C]NA[/C][C]NA[/C][C]-215.607[/C][C]NA[/C][/ROW]
[ROW][C]37[/C][C]5940.88[/C][C]NA[/C][C]NA[/C][C]141.61[/C][C]NA[/C][/ROW]
[ROW][C]38[/C][C]4937.92[/C][C]NA[/C][C]NA[/C][C]262.203[/C][C]NA[/C][/ROW]
[ROW][C]39[/C][C]4710.32[/C][C]NA[/C][C]NA[/C][C]-821.838[/C][C]NA[/C][/ROW]
[ROW][C]40[/C][C]6057.2[/C][C]NA[/C][C]NA[/C][C]-245.498[/C][C]NA[/C][/ROW]
[ROW][C]41[/C][C]5401.6[/C][C]NA[/C][C]NA[/C][C]618.037[/C][C]NA[/C][/ROW]
[/TABLE]
Source: https://freestatistics.org/blog/index.php?pk=301382&T=1

Globally Unique Identifier (entire table): ba.freestatistics.org/blog/index.php?pk=301382&T=1

As an alternative you can also use a QR Code:  

The GUIDs for individual cells are displayed in the table below:

Classical Decomposition by Moving Averages
tObservationsFitTrendSeasonalRandom
13329.04NANA141.61NA
23170NANA262.203NA
32555.12NANA-821.838NA
42221.44NANA-245.498NA
53618.64NANA618.037NA
63504.4NANA490.877NA
72757.282506.673104.9-598.232250.612
82687.62901.23141.76-240.555-213.605
93709.683661.583170.76490.82448.0963
103771.443848.473219.55628.923-77.0293
112792.562786.63297.34-510.7425.95847
122930.243149.123364.73-215.607-218.883
133751.763548.783407.17141.61202.977
143631.923716.223454.02262.203-84.2999
152789.22706.613528.45-821.83882.5918
163158.243358.243603.74-245.498-199.998
174548.964284.973666.94618.037263.987
184191.364240.683749.81490.877-49.3232
193088.963225.913824.14-598.232-136.948
203480.163652.183892.74-240.555-172.025
214703.444466.263975.44490.824237.18
224584.644698.124069.2628.923-113.479
233496.163639.924150.67-510.742-143.765
244215.524007.934223.54-215.607207.587
254250.484464.754323.14141.61-214.273
264779.64706.64444.39262.20373.0035
273626.243720.134541.97-821.838-93.8882
284571.444382.744628.24-245.498188.702
295091.045366.324748.29618.037-275.283
305398.245360.214869.34490.87738.0268
314272.564403.175001.4-598.232-130.608
325206.564837.875078.43-240.555368.685
335318.85621.025130.2490.824-302.22
346039.765866.25237.27628.923173.564
354922.244801.385312.12-510.742120.862
365694.64NANA-215.607NA
375940.88NANA141.61NA
384937.92NANA262.203NA
394710.32NANA-821.838NA
406057.2NANA-245.498NA
415401.6NANA618.037NA


Parameters (Session):
par4 = 12 ;
Parameters (R input):
par1 = additive ; par2 = 12 ;
R code (references can be found in the software module):
par2 <- as.numeric(par2)
x <- ts(x,freq=par2)
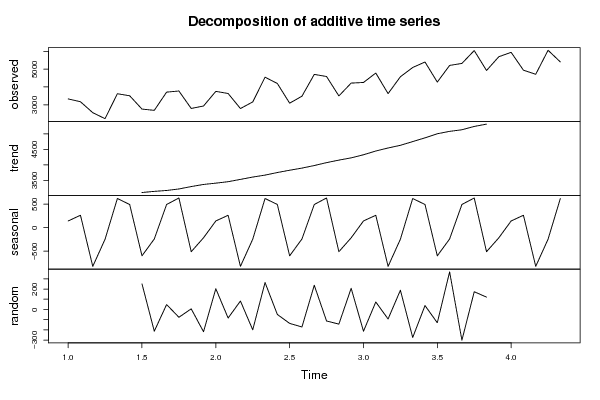
m <- decompose(x,type=par1)
m$figure
bitmap(file='test1.png')
plot(m)
dev.off()
mylagmax <- length(x)/2
bitmap(file='test2.png')
op <- par(mfrow = c(2,2))
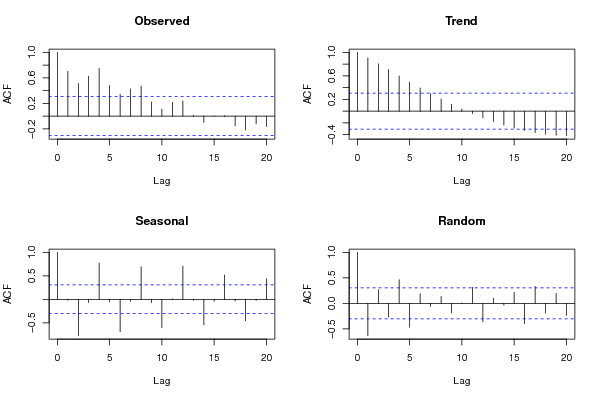
acf(as.numeric(x),lag.max = mylagmax,main='Observed')
acf(as.numeric(m$trend),na.action=na.pass,lag.max = mylagmax,main='Trend')
acf(as.numeric(m$seasonal),na.action=na.pass,lag.max = mylagmax,main='Seasonal')
acf(as.numeric(m$random),na.action=na.pass,lag.max = mylagmax,main='Random')
par(op)
dev.off()
bitmap(file='test3.png')
op <- par(mfrow = c(2,2))
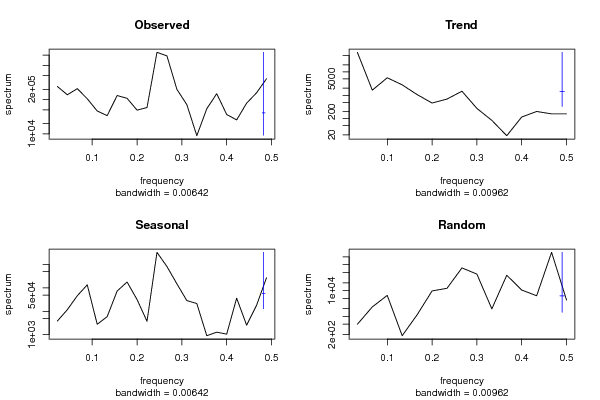
spectrum(as.numeric(x),main='Observed')
spectrum(as.numeric(m$trend[!is.na(m$trend)]),main='Trend')
spectrum(as.numeric(m$seasonal[!is.na(m$seasonal)]),main='Seasonal')
spectrum(as.numeric(m$random[!is.na(m$random)]),main='Random')
par(op)
dev.off()
bitmap(file='test4.png')
op <- par(mfrow = c(2,2))
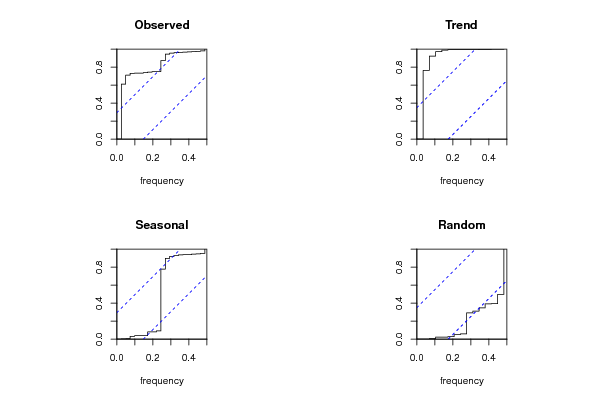
cpgram(as.numeric(x),main='Observed')
cpgram(as.numeric(m$trend[!is.na(m$trend)]),main='Trend')
cpgram(as.numeric(m$seasonal[!is.na(m$seasonal)]),main='Seasonal')
cpgram(as.numeric(m$random[!is.na(m$random)]),main='Random')
par(op)
dev.off()
load(file='createtable')
a<-table.start()
a<-table.row.start(a)
a<-table.element(a,'Classical Decomposition by Moving Averages',6,TRUE)
a<-table.row.end(a)
a<-table.row.start(a)
a<-table.element(a,'t',header=TRUE)
a<-table.element(a,'Observations',header=TRUE)
a<-table.element(a,'Fit',header=TRUE)
a<-table.element(a,'Trend',header=TRUE)
a<-table.element(a,'Seasonal',header=TRUE)
a<-table.element(a,'Random',header=TRUE)
a<-table.row.end(a)
for (i in 1:length(m$trend)) {
a<-table.row.start(a)
a<-table.element(a,i,header=TRUE)
a<-table.element(a,x[i])
if (par1 == 'additive') a<-table.element(a,signif(m$trend[i]+m$seasonal[i],6)) else a<-table.element(a,signif(m$trend[i]*m$seasonal[i],6))
a<-table.element(a,signif(m$trend[i],6))
a<-table.element(a,signif(m$seasonal[i],6))
a<-table.element(a,signif(m$random[i],6))
a<-table.row.end(a)
}
a<-table.end(a)
table.save(a,file='mytable.tab')