Free Statistics

of Irreproducible Research!

Author's title

Author*The author of this computation has been verified*
R Software Modulerwasp_arimaforecasting.wasp
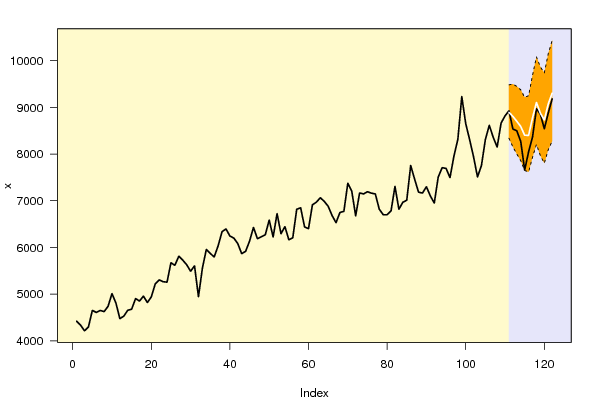
Title produced by softwareARIMA Forecasting
Date of computationMon, 19 Dec 2016 15:46:42 +0100
Cite this page as followsStatistical Computations at FreeStatistics.org, Office for Research Development and Education, URL https://freestatistics.org/blog/index.php?v=date/2016/Dec/19/t14821588303q5ykdttkplx5d4.htm/, Retrieved Sat, 18 May 2024 01:01:12 +0000
Statistical Computations at FreeStatistics.org, Office for Research Development and Education, URL https://freestatistics.org/blog/index.php?pk=301371, Retrieved Sat, 18 May 2024 01:01:12 +0000
QR Codes:

Original text written by user:
IsPrivate?No (this computation is public)
User-defined keywords
Estimated Impact92
Family? (F = Feedback message, R = changed R code, M = changed R Module, P = changed Parameters, D = changed Data)
-       [ARIMA Forecasting] [ARIMA Forecasting] [2016-12-19 14:46:42] [6fe662842930c5949e61d44eeb8a265b] [Current]
Feedback Forum

Post a new message
Dataseries X:
4419
4336
4214
4294
4650
4608
4650
4625
4739
5010
4808
4474
4527
4652
4677
4904
4851
4956
4819
4940
5217
5305
5265
5256
5671
5617
5811
5728
5629
5490
5605
4944
5555
5956
5872
5795
6033
6337
6396
6244
6200
6082
5866
5917
6134
6428
6187
6228
6269
6586
6223
6724
6294
6445
6163
6207
6816
6850
6439
6401
6913
6969
7064
6987
6882
6683
6530
6748
6773
7375
7208
6676
7167
7146
7193
7162
7145
6819
6702
6702
6782
7307
6818
6966
7012
7754
7462
7183
7165
7299
7103
6950
7506
7708
7693
7495
7955
8316
9230
8654
8307
7940
7509
7752
8310
8616
8358
8150
8664
8817
8927
8537
8497
8270
7658
8049
8365
8971
8854
8540
8878
9184


Summary of computational transaction
Raw Input view raw input (R code)
Raw Outputview raw output of R engine
Computing time1 seconds
R ServerBig Analytics Cloud Computing Center

\begin{tabular}{lllllllll}
\hline
Summary of computational transaction \tabularnewline
Raw Input view raw input (R code)  \tabularnewline
Raw Outputview raw output of R engine  \tabularnewline
Computing time1 seconds \tabularnewline
R ServerBig Analytics Cloud Computing Center \tabularnewline
\hline
\end{tabular}
%Source: https://freestatistics.org/blog/index.php?pk=301371&T=0

[TABLE]
[ROW]
Summary of computational transaction[/C][/ROW] [ROW]Raw Input[/C] view raw input (R code) [/C][/ROW] [ROW]Raw Output[/C]view raw output of R engine [/C][/ROW] [ROW]Computing time[/C]1 seconds[/C][/ROW] [ROW]R Server[/C]Big Analytics Cloud Computing Center[/C][/ROW] [/TABLE] Source: https://freestatistics.org/blog/index.php?pk=301371&T=0

Globally Unique Identifier (entire table): ba.freestatistics.org/blog/index.php?pk=301371&T=0

As an alternative you can also use a QR Code:  

The GUIDs for individual cells are displayed in the table below:

Summary of computational transaction
Raw Input view raw input (R code)
Raw Outputview raw output of R engine
Computing time1 seconds
R ServerBig Analytics Cloud Computing Center


Univariate ARIMA Extrapolation Forecast
timeY[t]F[t]95% LB95% UBp-value(H0: Y[t] = F[t])P(F[t]>Y[t-1])P(F[t]>Y[t-s])P(F[t]>Y[110])
988316.00000000001-------
999230.00000000001-------
1008654.00000000001-------
1018307.00000000001-------
1027940-------
1037509-------
1047752-------
1058310-------
1068616.00000000001-------
1078358-------
1088150-------
1098664.00000000001-------
1108817.00000000001-------
11189278895.36888337.73579482.44640.45790.60320.1320.6032
11285378805.73158153.10229499.50010.22390.36590.66590.4873
11384978700.80128000.78959448.97430.29670.66610.84890.3804
11482708589.95797857.24179376.3450.21260.59160.94740.2857
11576588402.36377648.55769214.46510.03620.62530.98450.1585
11680498400.66147615.5979249.17440.20830.95690.9330.1681
11783658775.6687931.65989690.04310.18940.94030.84090.4647
11889719104.2168204.452810081.24260.39460.9310.83630.7178
11988548874.59057964.64469865.86650.48380.42440.84650.5453
12085408728.60077803.53979739.38120.35730.40390.86910.4319
12188789073.80728092.02310148.65390.36050.83480.77260.6802
12291849305.52858276.73510434.17260.41640.77110.80190.8019

\begin{tabular}{lllllllll}
\hline
Univariate ARIMA Extrapolation Forecast \tabularnewline
time & Y[t] & F[t] & 95% LB & 95% UB & p-value(H0: Y[t] = F[t]) & P(F[t]>Y[t-1]) & P(F[t]>Y[t-s]) & P(F[t]>Y[110]) \tabularnewline
98 & 8316.00000000001 & - & - & - & - & - & - & - \tabularnewline
99 & 9230.00000000001 & - & - & - & - & - & - & - \tabularnewline
100 & 8654.00000000001 & - & - & - & - & - & - & - \tabularnewline
101 & 8307.00000000001 & - & - & - & - & - & - & - \tabularnewline
102 & 7940 & - & - & - & - & - & - & - \tabularnewline
103 & 7509 & - & - & - & - & - & - & - \tabularnewline
104 & 7752 & - & - & - & - & - & - & - \tabularnewline
105 & 8310 & - & - & - & - & - & - & - \tabularnewline
106 & 8616.00000000001 & - & - & - & - & - & - & - \tabularnewline
107 & 8358 & - & - & - & - & - & - & - \tabularnewline
108 & 8150 & - & - & - & - & - & - & - \tabularnewline
109 & 8664.00000000001 & - & - & - & - & - & - & - \tabularnewline
110 & 8817.00000000001 & - & - & - & - & - & - & - \tabularnewline
111 & 8927 & 8895.3688 & 8337.7357 & 9482.4464 & 0.4579 & 0.6032 & 0.132 & 0.6032 \tabularnewline
112 & 8537 & 8805.7315 & 8153.1022 & 9499.5001 & 0.2239 & 0.3659 & 0.6659 & 0.4873 \tabularnewline
113 & 8497 & 8700.8012 & 8000.7895 & 9448.9743 & 0.2967 & 0.6661 & 0.8489 & 0.3804 \tabularnewline
114 & 8270 & 8589.9579 & 7857.2417 & 9376.345 & 0.2126 & 0.5916 & 0.9474 & 0.2857 \tabularnewline
115 & 7658 & 8402.3637 & 7648.5576 & 9214.4651 & 0.0362 & 0.6253 & 0.9845 & 0.1585 \tabularnewline
116 & 8049 & 8400.6614 & 7615.597 & 9249.1744 & 0.2083 & 0.9569 & 0.933 & 0.1681 \tabularnewline
117 & 8365 & 8775.668 & 7931.6598 & 9690.0431 & 0.1894 & 0.9403 & 0.8409 & 0.4647 \tabularnewline
118 & 8971 & 9104.216 & 8204.4528 & 10081.2426 & 0.3946 & 0.931 & 0.8363 & 0.7178 \tabularnewline
119 & 8854 & 8874.5905 & 7964.6446 & 9865.8665 & 0.4838 & 0.4244 & 0.8465 & 0.5453 \tabularnewline
120 & 8540 & 8728.6007 & 7803.5397 & 9739.3812 & 0.3573 & 0.4039 & 0.8691 & 0.4319 \tabularnewline
121 & 8878 & 9073.8072 & 8092.023 & 10148.6539 & 0.3605 & 0.8348 & 0.7726 & 0.6802 \tabularnewline
122 & 9184 & 9305.5285 & 8276.735 & 10434.1726 & 0.4164 & 0.7711 & 0.8019 & 0.8019 \tabularnewline
\hline
\end{tabular}
%Source: https://freestatistics.org/blog/index.php?pk=301371&T=1

[TABLE]
[ROW][C]Univariate ARIMA Extrapolation Forecast[/C][/ROW]
[ROW][C]time[/C][C]Y[t][/C][C]F[t][/C][C]95% LB[/C][C]95% UB[/C][C]p-value(H0: Y[t] = F[t])[/C][C]P(F[t]>Y[t-1])[/C][C]P(F[t]>Y[t-s])[/C][C]P(F[t]>Y[110])[/C][/ROW]
[ROW][C]98[/C][C]8316.00000000001[/C][C]-[/C][C]-[/C][C]-[/C][C]-[/C][C]-[/C][C]-[/C][C]-[/C][/ROW]
[ROW][C]99[/C][C]9230.00000000001[/C][C]-[/C][C]-[/C][C]-[/C][C]-[/C][C]-[/C][C]-[/C][C]-[/C][/ROW]
[ROW][C]100[/C][C]8654.00000000001[/C][C]-[/C][C]-[/C][C]-[/C][C]-[/C][C]-[/C][C]-[/C][C]-[/C][/ROW]
[ROW][C]101[/C][C]8307.00000000001[/C][C]-[/C][C]-[/C][C]-[/C][C]-[/C][C]-[/C][C]-[/C][C]-[/C][/ROW]
[ROW][C]102[/C][C]7940[/C][C]-[/C][C]-[/C][C]-[/C][C]-[/C][C]-[/C][C]-[/C][C]-[/C][/ROW]
[ROW][C]103[/C][C]7509[/C][C]-[/C][C]-[/C][C]-[/C][C]-[/C][C]-[/C][C]-[/C][C]-[/C][/ROW]
[ROW][C]104[/C][C]7752[/C][C]-[/C][C]-[/C][C]-[/C][C]-[/C][C]-[/C][C]-[/C][C]-[/C][/ROW]
[ROW][C]105[/C][C]8310[/C][C]-[/C][C]-[/C][C]-[/C][C]-[/C][C]-[/C][C]-[/C][C]-[/C][/ROW]
[ROW][C]106[/C][C]8616.00000000001[/C][C]-[/C][C]-[/C][C]-[/C][C]-[/C][C]-[/C][C]-[/C][C]-[/C][/ROW]
[ROW][C]107[/C][C]8358[/C][C]-[/C][C]-[/C][C]-[/C][C]-[/C][C]-[/C][C]-[/C][C]-[/C][/ROW]
[ROW][C]108[/C][C]8150[/C][C]-[/C][C]-[/C][C]-[/C][C]-[/C][C]-[/C][C]-[/C][C]-[/C][/ROW]
[ROW][C]109[/C][C]8664.00000000001[/C][C]-[/C][C]-[/C][C]-[/C][C]-[/C][C]-[/C][C]-[/C][C]-[/C][/ROW]
[ROW][C]110[/C][C]8817.00000000001[/C][C]-[/C][C]-[/C][C]-[/C][C]-[/C][C]-[/C][C]-[/C][C]-[/C][/ROW]
[ROW][C]111[/C][C]8927[/C][C]8895.3688[/C][C]8337.7357[/C][C]9482.4464[/C][C]0.4579[/C][C]0.6032[/C][C]0.132[/C][C]0.6032[/C][/ROW]
[ROW][C]112[/C][C]8537[/C][C]8805.7315[/C][C]8153.1022[/C][C]9499.5001[/C][C]0.2239[/C][C]0.3659[/C][C]0.6659[/C][C]0.4873[/C][/ROW]
[ROW][C]113[/C][C]8497[/C][C]8700.8012[/C][C]8000.7895[/C][C]9448.9743[/C][C]0.2967[/C][C]0.6661[/C][C]0.8489[/C][C]0.3804[/C][/ROW]
[ROW][C]114[/C][C]8270[/C][C]8589.9579[/C][C]7857.2417[/C][C]9376.345[/C][C]0.2126[/C][C]0.5916[/C][C]0.9474[/C][C]0.2857[/C][/ROW]
[ROW][C]115[/C][C]7658[/C][C]8402.3637[/C][C]7648.5576[/C][C]9214.4651[/C][C]0.0362[/C][C]0.6253[/C][C]0.9845[/C][C]0.1585[/C][/ROW]
[ROW][C]116[/C][C]8049[/C][C]8400.6614[/C][C]7615.597[/C][C]9249.1744[/C][C]0.2083[/C][C]0.9569[/C][C]0.933[/C][C]0.1681[/C][/ROW]
[ROW][C]117[/C][C]8365[/C][C]8775.668[/C][C]7931.6598[/C][C]9690.0431[/C][C]0.1894[/C][C]0.9403[/C][C]0.8409[/C][C]0.4647[/C][/ROW]
[ROW][C]118[/C][C]8971[/C][C]9104.216[/C][C]8204.4528[/C][C]10081.2426[/C][C]0.3946[/C][C]0.931[/C][C]0.8363[/C][C]0.7178[/C][/ROW]
[ROW][C]119[/C][C]8854[/C][C]8874.5905[/C][C]7964.6446[/C][C]9865.8665[/C][C]0.4838[/C][C]0.4244[/C][C]0.8465[/C][C]0.5453[/C][/ROW]
[ROW][C]120[/C][C]8540[/C][C]8728.6007[/C][C]7803.5397[/C][C]9739.3812[/C][C]0.3573[/C][C]0.4039[/C][C]0.8691[/C][C]0.4319[/C][/ROW]
[ROW][C]121[/C][C]8878[/C][C]9073.8072[/C][C]8092.023[/C][C]10148.6539[/C][C]0.3605[/C][C]0.8348[/C][C]0.7726[/C][C]0.6802[/C][/ROW]
[ROW][C]122[/C][C]9184[/C][C]9305.5285[/C][C]8276.735[/C][C]10434.1726[/C][C]0.4164[/C][C]0.7711[/C][C]0.8019[/C][C]0.8019[/C][/ROW]
[/TABLE]
Source: https://freestatistics.org/blog/index.php?pk=301371&T=1

Globally Unique Identifier (entire table): ba.freestatistics.org/blog/index.php?pk=301371&T=1

As an alternative you can also use a QR Code:  

The GUIDs for individual cells are displayed in the table below:

Univariate ARIMA Extrapolation Forecast
timeY[t]F[t]95% LB95% UBp-value(H0: Y[t] = F[t])P(F[t]>Y[t-1])P(F[t]>Y[t-s])P(F[t]>Y[110])
988316.00000000001-------
999230.00000000001-------
1008654.00000000001-------
1018307.00000000001-------
1027940-------
1037509-------
1047752-------
1058310-------
1068616.00000000001-------
1078358-------
1088150-------
1098664.00000000001-------
1108817.00000000001-------
11189278895.36888337.73579482.44640.45790.60320.1320.6032
11285378805.73158153.10229499.50010.22390.36590.66590.4873
11384978700.80128000.78959448.97430.29670.66610.84890.3804
11482708589.95797857.24179376.3450.21260.59160.94740.2857
11576588402.36377648.55769214.46510.03620.62530.98450.1585
11680498400.66147615.5979249.17440.20830.95690.9330.1681
11783658775.6687931.65989690.04310.18940.94030.84090.4647
11889719104.2168204.452810081.24260.39460.9310.83630.7178
11988548874.59057964.64469865.86650.48380.42440.84650.5453
12085408728.60077803.53979739.38120.35730.40390.86910.4319
12188789073.80728092.02310148.65390.36050.83480.77260.6802
12291849305.52858276.73510434.17260.41640.77110.80190.8019


Univariate ARIMA Extrapolation Forecast Performance
time% S.E.PEMAPEsMAPESq.EMSERMSEScaledEMASE
1110.03370.00350.00350.00351000.5359000.09510.0951
1120.0402-0.03150.01750.017372216.608536608.5722191.3337-0.80830.4517
1130.0439-0.0240.01970.019441534.943538250.696195.5779-0.6130.5055
1140.0467-0.03870.02440.024102373.05154281.2847232.9834-0.96240.6197
1150.0493-0.09720.0390.0378554077.2671154240.4812392.7346-2.2390.9436
1160.0515-0.04370.03980.0386123665.7276149144.6889386.1926-1.05780.9626
1170.0532-0.04910.04110.0399168648.2406151930.9106389.7832-1.23531.0016
1180.0548-0.01480.03780.036817746.4914135157.8582367.6382-0.40070.9265
1190.057-0.00230.03390.033423.9673120187.4259346.6806-0.06190.8304
1200.0591-0.02210.03270.031835570.2336111725.7066334.254-0.56730.8041
1210.0604-0.02210.03170.030938340.4764105054.3221324.1208-0.5890.7845
1220.0619-0.01320.03020.029514769.178897530.5601312.2988-0.36550.7496

\begin{tabular}{lllllllll}
\hline
Univariate ARIMA Extrapolation Forecast Performance \tabularnewline
time & % S.E. & PE & MAPE & sMAPE & Sq.E & MSE & RMSE & ScaledE & MASE \tabularnewline
111 & 0.0337 & 0.0035 & 0.0035 & 0.0035 & 1000.5359 & 0 & 0 & 0.0951 & 0.0951 \tabularnewline
112 & 0.0402 & -0.0315 & 0.0175 & 0.0173 & 72216.6085 & 36608.5722 & 191.3337 & -0.8083 & 0.4517 \tabularnewline
113 & 0.0439 & -0.024 & 0.0197 & 0.0194 & 41534.9435 & 38250.696 & 195.5779 & -0.613 & 0.5055 \tabularnewline
114 & 0.0467 & -0.0387 & 0.0244 & 0.024 & 102373.051 & 54281.2847 & 232.9834 & -0.9624 & 0.6197 \tabularnewline
115 & 0.0493 & -0.0972 & 0.039 & 0.0378 & 554077.2671 & 154240.4812 & 392.7346 & -2.239 & 0.9436 \tabularnewline
116 & 0.0515 & -0.0437 & 0.0398 & 0.0386 & 123665.7276 & 149144.6889 & 386.1926 & -1.0578 & 0.9626 \tabularnewline
117 & 0.0532 & -0.0491 & 0.0411 & 0.0399 & 168648.2406 & 151930.9106 & 389.7832 & -1.2353 & 1.0016 \tabularnewline
118 & 0.0548 & -0.0148 & 0.0378 & 0.0368 & 17746.4914 & 135157.8582 & 367.6382 & -0.4007 & 0.9265 \tabularnewline
119 & 0.057 & -0.0023 & 0.0339 & 0.033 & 423.9673 & 120187.4259 & 346.6806 & -0.0619 & 0.8304 \tabularnewline
120 & 0.0591 & -0.0221 & 0.0327 & 0.0318 & 35570.2336 & 111725.7066 & 334.254 & -0.5673 & 0.8041 \tabularnewline
121 & 0.0604 & -0.0221 & 0.0317 & 0.0309 & 38340.4764 & 105054.3221 & 324.1208 & -0.589 & 0.7845 \tabularnewline
122 & 0.0619 & -0.0132 & 0.0302 & 0.0295 & 14769.1788 & 97530.5601 & 312.2988 & -0.3655 & 0.7496 \tabularnewline
\hline
\end{tabular}
%Source: https://freestatistics.org/blog/index.php?pk=301371&T=2

[TABLE]
[ROW][C]Univariate ARIMA Extrapolation Forecast Performance[/C][/ROW]
[ROW][C]time[/C][C]% S.E.[/C][C]PE[/C][C]MAPE[/C][C]sMAPE[/C][C]Sq.E[/C][C]MSE[/C][C]RMSE[/C][C]ScaledE[/C][C]MASE[/C][/ROW]
[ROW][C]111[/C][C]0.0337[/C][C]0.0035[/C][C]0.0035[/C][C]0.0035[/C][C]1000.5359[/C][C]0[/C][C]0[/C][C]0.0951[/C][C]0.0951[/C][/ROW]
[ROW][C]112[/C][C]0.0402[/C][C]-0.0315[/C][C]0.0175[/C][C]0.0173[/C][C]72216.6085[/C][C]36608.5722[/C][C]191.3337[/C][C]-0.8083[/C][C]0.4517[/C][/ROW]
[ROW][C]113[/C][C]0.0439[/C][C]-0.024[/C][C]0.0197[/C][C]0.0194[/C][C]41534.9435[/C][C]38250.696[/C][C]195.5779[/C][C]-0.613[/C][C]0.5055[/C][/ROW]
[ROW][C]114[/C][C]0.0467[/C][C]-0.0387[/C][C]0.0244[/C][C]0.024[/C][C]102373.051[/C][C]54281.2847[/C][C]232.9834[/C][C]-0.9624[/C][C]0.6197[/C][/ROW]
[ROW][C]115[/C][C]0.0493[/C][C]-0.0972[/C][C]0.039[/C][C]0.0378[/C][C]554077.2671[/C][C]154240.4812[/C][C]392.7346[/C][C]-2.239[/C][C]0.9436[/C][/ROW]
[ROW][C]116[/C][C]0.0515[/C][C]-0.0437[/C][C]0.0398[/C][C]0.0386[/C][C]123665.7276[/C][C]149144.6889[/C][C]386.1926[/C][C]-1.0578[/C][C]0.9626[/C][/ROW]
[ROW][C]117[/C][C]0.0532[/C][C]-0.0491[/C][C]0.0411[/C][C]0.0399[/C][C]168648.2406[/C][C]151930.9106[/C][C]389.7832[/C][C]-1.2353[/C][C]1.0016[/C][/ROW]
[ROW][C]118[/C][C]0.0548[/C][C]-0.0148[/C][C]0.0378[/C][C]0.0368[/C][C]17746.4914[/C][C]135157.8582[/C][C]367.6382[/C][C]-0.4007[/C][C]0.9265[/C][/ROW]
[ROW][C]119[/C][C]0.057[/C][C]-0.0023[/C][C]0.0339[/C][C]0.033[/C][C]423.9673[/C][C]120187.4259[/C][C]346.6806[/C][C]-0.0619[/C][C]0.8304[/C][/ROW]
[ROW][C]120[/C][C]0.0591[/C][C]-0.0221[/C][C]0.0327[/C][C]0.0318[/C][C]35570.2336[/C][C]111725.7066[/C][C]334.254[/C][C]-0.5673[/C][C]0.8041[/C][/ROW]
[ROW][C]121[/C][C]0.0604[/C][C]-0.0221[/C][C]0.0317[/C][C]0.0309[/C][C]38340.4764[/C][C]105054.3221[/C][C]324.1208[/C][C]-0.589[/C][C]0.7845[/C][/ROW]
[ROW][C]122[/C][C]0.0619[/C][C]-0.0132[/C][C]0.0302[/C][C]0.0295[/C][C]14769.1788[/C][C]97530.5601[/C][C]312.2988[/C][C]-0.3655[/C][C]0.7496[/C][/ROW]
[/TABLE]
Source: https://freestatistics.org/blog/index.php?pk=301371&T=2

Globally Unique Identifier (entire table): ba.freestatistics.org/blog/index.php?pk=301371&T=2

As an alternative you can also use a QR Code:  

The GUIDs for individual cells are displayed in the table below:

Univariate ARIMA Extrapolation Forecast Performance
time% S.E.PEMAPEsMAPESq.EMSERMSEScaledEMASE
1110.03370.00350.00350.00351000.5359000.09510.0951
1120.0402-0.03150.01750.017372216.608536608.5722191.3337-0.80830.4517
1130.0439-0.0240.01970.019441534.943538250.696195.5779-0.6130.5055
1140.0467-0.03870.02440.024102373.05154281.2847232.9834-0.96240.6197
1150.0493-0.09720.0390.0378554077.2671154240.4812392.7346-2.2390.9436
1160.0515-0.04370.03980.0386123665.7276149144.6889386.1926-1.05780.9626
1170.0532-0.04910.04110.0399168648.2406151930.9106389.7832-1.23531.0016
1180.0548-0.01480.03780.036817746.4914135157.8582367.6382-0.40070.9265
1190.057-0.00230.03390.033423.9673120187.4259346.6806-0.06190.8304
1200.0591-0.02210.03270.031835570.2336111725.7066334.254-0.56730.8041
1210.0604-0.02210.03170.030938340.4764105054.3221324.1208-0.5890.7845
1220.0619-0.01320.03020.029514769.178897530.5601312.2988-0.36550.7496


Parameters (Session):
par1 = Default ; par2 = 1 ; par3 = 0 ; par4 = 0 ; par5 = 12 ; par6 = White Noise ; par7 = 0.95 ;
Parameters (R input):
par1 = 12 ; par2 = 0.2 ; par3 = 1 ; par4 = 0 ; par5 = 12 ; par6 = 1 ; par7 = 1 ; par8 = 1 ; par9 = 1 ; par10 = FALSE ;
R code (references can be found in the software module):
par1 <- as.numeric(par1) #cut off periods
par2 <- as.numeric(par2) #lambda
par3 <- as.numeric(par3) #degree of non-seasonal differencing
par4 <- as.numeric(par4) #degree of seasonal differencing
par5 <- as.numeric(par5) #seasonal period
par6 <- as.numeric(par6) #p
par7 <- as.numeric(par7) #q
par8 <- as.numeric(par8) #P
par9 <- as.numeric(par9) #Q
if (par10 == 'TRUE') par10 <- TRUE
if (par10 == 'FALSE') par10 <- FALSE
if (par2 == 0) x <- log(x)
if (par2 != 0) x <- x^par2
lx <- length(x)
first <- lx - 2*par1
nx <- lx - par1
nx1 <- nx + 1
fx <- lx - nx
if (fx < 1) {
fx <- par5*2
nx1 <- lx + fx - 1
first <- lx - 2*fx
}
first <- 1
if (fx < 3) fx <- round(lx/10,0)
(arima.out <- arima(x[1:nx], order=c(par6,par3,par7), seasonal=list(order=c(par8,par4,par9), period=par5), include.mean=par10, method='ML'))
(forecast <- predict(arima.out,fx))
(lb <- forecast$pred - 1.96 * forecast$se)
(ub <- forecast$pred + 1.96 * forecast$se)
if (par2 == 0) {
x <- exp(x)
forecast$pred <- exp(forecast$pred)
lb <- exp(lb)
ub <- exp(ub)
}
if (par2 != 0) {
x <- x^(1/par2)
forecast$pred <- forecast$pred^(1/par2)
lb <- lb^(1/par2)
ub <- ub^(1/par2)
}
if (par2 < 0) {
olb <- lb
lb <- ub
ub <- olb
}
(actandfor <- c(x[1:nx], forecast$pred))
(perc.se <- (ub-forecast$pred)/1.96/forecast$pred)
bitmap(file='test1.png')
opar <- par(mar=c(4,4,2,2),las=1)
ylim <- c( min(x[first:nx],lb), max(x[first:nx],ub))
plot(x,ylim=ylim,type='n',xlim=c(first,lx))
usr <- par('usr')
rect(usr[1],usr[3],nx+1,usr[4],border=NA,col='lemonchiffon')
rect(nx1,usr[3],usr[2],usr[4],border=NA,col='lavender')
abline(h= (-3:3)*2 , col ='gray', lty =3)
polygon( c(nx1:lx,lx:nx1), c(lb,rev(ub)), col = 'orange', lty=2,border=NA)
lines(nx1:lx, lb , lty=2)
lines(nx1:lx, ub , lty=2)
lines(x, lwd=2)
lines(nx1:lx, forecast$pred , lwd=2 , col ='white')
box()
par(opar)
dev.off()
prob.dec <- array(NA, dim=fx)
prob.sdec <- array(NA, dim=fx)
prob.ldec <- array(NA, dim=fx)
prob.pval <- array(NA, dim=fx)
perf.pe <- array(0, dim=fx)
perf.spe <- array(0, dim=fx)
perf.scalederr <- array(0, dim=fx)
perf.mase <- array(0, dim=fx)
perf.mase1 <- array(0, dim=fx)
perf.mape <- array(0, dim=fx)
perf.smape <- array(0, dim=fx)
perf.mape1 <- array(0, dim=fx)
perf.smape1 <- array(0,dim=fx)
perf.se <- array(0, dim=fx)
perf.mse <- array(0, dim=fx)
perf.mse1 <- array(0, dim=fx)
perf.rmse <- array(0, dim=fx)
perf.scaleddenom <- 0
for (i in 2:fx) {
perf.scaleddenom = perf.scaleddenom + abs(x[nx+i] - x[nx+i-1])
}
perf.scaleddenom = perf.scaleddenom / (fx-1)
for (i in 1:fx) {
locSD <- (ub[i] - forecast$pred[i]) / 1.96
perf.scalederr[i] = (x[nx+i] - forecast$pred[i]) / perf.scaleddenom
perf.pe[i] = (x[nx+i] - forecast$pred[i]) / x[nx+i]
perf.spe[i] = 2*(x[nx+i] - forecast$pred[i]) / (x[nx+i] + forecast$pred[i])
perf.se[i] = (x[nx+i] - forecast$pred[i])^2
prob.dec[i] = pnorm((x[nx+i-1] - forecast$pred[i]) / locSD)
prob.sdec[i] = pnorm((x[nx+i-par5] - forecast$pred[i]) / locSD)
prob.ldec[i] = pnorm((x[nx] - forecast$pred[i]) / locSD)
prob.pval[i] = pnorm(abs(x[nx+i] - forecast$pred[i]) / locSD)
}
perf.mape[1] = abs(perf.pe[1])
perf.smape[1] = abs(perf.spe[1])
perf.mape1[1] = perf.mape[1]
perf.smape1[1] = perf.smape[1]
perf.mse[1] = perf.se[1]
perf.mase[1] = abs(perf.scalederr[1])
perf.mase1[1] = perf.mase[1]
for (i in 2:fx) {
perf.mape[i] = perf.mape[i-1] + abs(perf.pe[i])
perf.mape1[i] = perf.mape[i] / i
perf.smape[i] = perf.smape[i-1] + abs(perf.spe[i])
perf.smape1[i] = perf.smape[i] / i
perf.mse[i] = perf.mse[i-1] + perf.se[i]
perf.mse1[i] = perf.mse[i] / i
perf.mase[i] = perf.mase[i-1] + abs(perf.scalederr[i])
perf.mase1[i] = perf.mase[i] / i
}
perf.rmse = sqrt(perf.mse1)
bitmap(file='test2.png')
plot(forecast$pred, pch=19, type='b',main='ARIMA Extrapolation Forecast', ylab='Forecast and 95% CI', xlab='time',ylim=c(min(lb),max(ub)))
dum <- forecast$pred
dum[1:par1] <- x[(nx+1):lx]
lines(dum, lty=1)
lines(ub,lty=3)
lines(lb,lty=3)
dev.off()
load(file='createtable')
a<-table.start()
a<-table.row.start(a)
a<-table.element(a,'Univariate ARIMA Extrapolation Forecast',9,TRUE)
a<-table.row.end(a)
a<-table.row.start(a)
a<-table.element(a,'time',1,header=TRUE)
a<-table.element(a,'Y[t]',1,header=TRUE)
a<-table.element(a,'F[t]',1,header=TRUE)
a<-table.element(a,'95% LB',1,header=TRUE)
a<-table.element(a,'95% UB',1,header=TRUE)
a<-table.element(a,'p-value
(H0: Y[t] = F[t])',1,header=TRUE)
a<-table.element(a,'P(F[t]>Y[t-1])',1,header=TRUE)
a<-table.element(a,'P(F[t]>Y[t-s])',1,header=TRUE)
mylab <- paste('P(F[t]>Y[',nx,sep='')
mylab <- paste(mylab,'])',sep='')
a<-table.element(a,mylab,1,header=TRUE)
a<-table.row.end(a)
for (i in (nx-par5):nx) {
a<-table.row.start(a)
a<-table.element(a,i,header=TRUE)
a<-table.element(a,x[i])
a<-table.element(a,'-')
a<-table.row.end(a)
}
for (i in 1:fx) {
a<-table.row.start(a)
a<-table.element(a,nx+i,header=TRUE)
a<-table.element(a,round(x[nx+i],4))
a<-table.element(a,round(forecast$pred[i],4))
a<-table.element(a,round(lb[i],4))
a<-table.element(a,round(ub[i],4))
a<-table.element(a,round((1-prob.pval[i]),4))
a<-table.element(a,round((1-prob.dec[i]),4))
a<-table.element(a,round((1-prob.sdec[i]),4))
a<-table.element(a,round((1-prob.ldec[i]),4))
a<-table.row.end(a)
}
a<-table.end(a)
table.save(a,file='mytable.tab')
a<-table.start()
a<-table.row.start(a)
a<-table.element(a,'Univariate ARIMA Extrapolation Forecast Performance',10,TRUE)
a<-table.row.end(a)
a<-table.row.start(a)
a<-table.element(a,'time',1,header=TRUE)
a<-table.element(a,'% S.E.',1,header=TRUE)
a<-table.element(a,'PE',1,header=TRUE)
a<-table.element(a,'MAPE',1,header=TRUE)
a<-table.element(a,'sMAPE',1,header=TRUE)
a<-table.element(a,'Sq.E',1,header=TRUE)
a<-table.element(a,'MSE',1,header=TRUE)
a<-table.element(a,'RMSE',1,header=TRUE)
a<-table.element(a,'ScaledE',1,header=TRUE)
a<-table.element(a,'MASE',1,header=TRUE)
a<-table.row.end(a)
for (i in 1:fx) {
a<-table.row.start(a)
a<-table.element(a,nx+i,header=TRUE)
a<-table.element(a,round(perc.se[i],4))
a<-table.element(a,round(perf.pe[i],4))
a<-table.element(a,round(perf.mape1[i],4))
a<-table.element(a,round(perf.smape1[i],4))
a<-table.element(a,round(perf.se[i],4))
a<-table.element(a,round(perf.mse1[i],4))
a<-table.element(a,round(perf.rmse[i],4))
a<-table.element(a,round(perf.scalederr[i],4))
a<-table.element(a,round(perf.mase1[i],4))
a<-table.row.end(a)
}
a<-table.end(a)
table.save(a,file='mytable1.tab')