Free Statistics

of Irreproducible Research!

Author's title

Author*The author of this computation has been verified*
R Software Modulerwasp_arimaforecasting.wasp
Title produced by softwareARIMA Forecasting
Date of computationMon, 19 Dec 2016 13:06:18 +0100
Cite this page as followsStatistical Computations at FreeStatistics.org, Office for Research Development and Education, URL https://freestatistics.org/blog/index.php?v=date/2016/Dec/19/t1482149206iy0p0qhej81bzkx.htm/, Retrieved Sat, 18 May 2024 01:01:14 +0000
Statistical Computations at FreeStatistics.org, Office for Research Development and Education, URL https://freestatistics.org/blog/index.php?pk=301316, Retrieved Sat, 18 May 2024 01:01:14 +0000
QR Codes:

Original text written by user:
IsPrivate?No (this computation is public)
User-defined keywords
Estimated Impact66
Family? (F = Feedback message, R = changed R code, M = changed R Module, P = changed Parameters, D = changed Data)
-       [ARIMA Forecasting] [ARIMA Forecasting] [2016-12-19 12:06:18] [3373ac80755a3c11b71e203db9ac7f73] [Current]
Feedback Forum

Post a new message
Dataseries X:
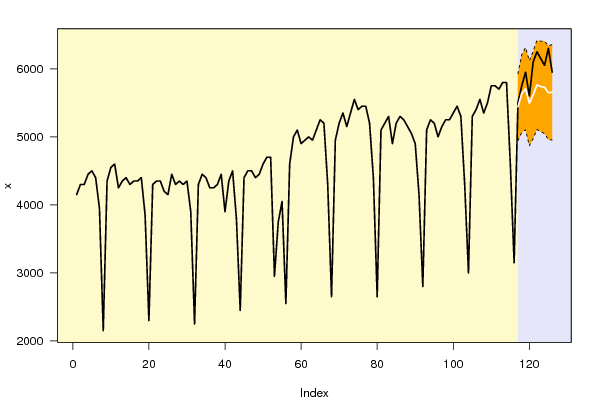
4150
4300
4300
4450
4500
4400
3950
2150
4350
4550
4600
4250
4350
4400
4300
4350
4350
4400
3850
2300
4300
4350
4350
4200
4150
4450
4300
4350
4300
4350
3900
2250
4300
4450
4400
4250
4250
4300
4450
3900
4350
4500
3800
2450
4400
4500
4500
4400
4450
4600
4700
4700
2950
3750
4050
2550
4600
5000
5100
4900
4950
5000
4950
5100
5250
5200
4300
2650
4950
5200
5350
5150
5350
5550
5400
5450
5450
5200
4400
2650
5100
5200
5300
4900
5200
5300
5250
5150
5050
4900
4150
2800
5100
5250
5200
5000
5150
5250
5250
5350
5450
5300
4300
3000
5300
5400
5550
5350
5500
5750
5750
5700
5800
5800
4600
3150
5500
5750
5950
5600
6100
6250
6150
6050
6300
5950


Summary of computational transaction
Raw Input view raw input (R code)
Raw Outputview raw output of R engine
Computing time2 seconds
R ServerBig Analytics Cloud Computing Center

\begin{tabular}{lllllllll}
\hline
Summary of computational transaction \tabularnewline
Raw Input view raw input (R code)  \tabularnewline
Raw Outputview raw output of R engine  \tabularnewline
Computing time2 seconds \tabularnewline
R ServerBig Analytics Cloud Computing Center \tabularnewline
\hline
\end{tabular}
%Source: https://freestatistics.org/blog/index.php?pk=301316&T=0

[TABLE]
[ROW]
Summary of computational transaction[/C][/ROW] [ROW]Raw Input[/C] view raw input (R code) [/C][/ROW] [ROW]Raw Output[/C]view raw output of R engine [/C][/ROW] [ROW]Computing time[/C]2 seconds[/C][/ROW] [ROW]R Server[/C]Big Analytics Cloud Computing Center[/C][/ROW] [/TABLE] Source: https://freestatistics.org/blog/index.php?pk=301316&T=0

Globally Unique Identifier (entire table): ba.freestatistics.org/blog/index.php?pk=301316&T=0

As an alternative you can also use a QR Code:  

The GUIDs for individual cells are displayed in the table below:

Summary of computational transaction
Raw Input view raw input (R code)
Raw Outputview raw output of R engine
Computing time2 seconds
R ServerBig Analytics Cloud Computing Center


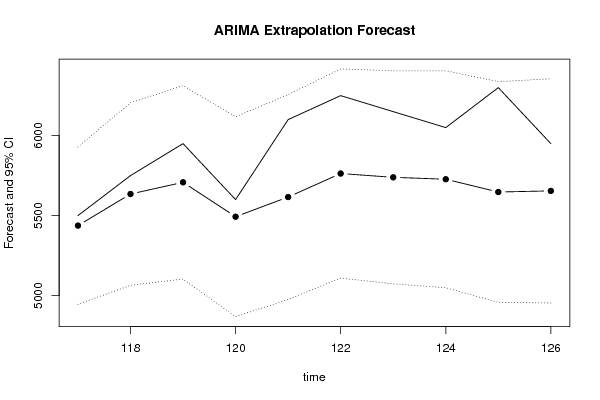
Univariate ARIMA Extrapolation Forecast
timeY[t]F[t]95% LB95% UBp-value(H0: Y[t] = F[t])P(F[t]>Y[t-1])P(F[t]>Y[t-s])P(F[t]>Y[116])
1043000-------
1055300-------
1065400-------
1075550-------
1085350-------
1095500-------
1105750-------
1115750-------
1125700-------
1135800-------
1145800-------
1154600-------
1163150-------
11755005437.34664945.70185928.99150.401410.7081
11857505634.76635064.06866205.46390.34610.67830.791
11959505708.02255103.53096312.51420.21630.44590.69581
12056005493.11614868.15276118.07950.36870.07590.67321
12161005615.89424975.55136256.2370.06920.51940.63861
12262505762.96815109.19016416.7460.07210.15610.51551
12361505739.14495072.91916405.37060.11340.06640.48731
12460505727.28925049.15346405.4250.17550.11090.53141
12563005647.36024957.65496337.06560.03180.12630.33221
12659505654.39284953.36746355.41820.20430.03550.3421

\begin{tabular}{lllllllll}
\hline
Univariate ARIMA Extrapolation Forecast \tabularnewline
time & Y[t] & F[t] & 95% LB & 95% UB & p-value(H0: Y[t] = F[t]) & P(F[t]>Y[t-1]) & P(F[t]>Y[t-s]) & P(F[t]>Y[116]) \tabularnewline
104 & 3000 & - & - & - & - & - & - & - \tabularnewline
105 & 5300 & - & - & - & - & - & - & - \tabularnewline
106 & 5400 & - & - & - & - & - & - & - \tabularnewline
107 & 5550 & - & - & - & - & - & - & - \tabularnewline
108 & 5350 & - & - & - & - & - & - & - \tabularnewline
109 & 5500 & - & - & - & - & - & - & - \tabularnewline
110 & 5750 & - & - & - & - & - & - & - \tabularnewline
111 & 5750 & - & - & - & - & - & - & - \tabularnewline
112 & 5700 & - & - & - & - & - & - & - \tabularnewline
113 & 5800 & - & - & - & - & - & - & - \tabularnewline
114 & 5800 & - & - & - & - & - & - & - \tabularnewline
115 & 4600 & - & - & - & - & - & - & - \tabularnewline
116 & 3150 & - & - & - & - & - & - & - \tabularnewline
117 & 5500 & 5437.3466 & 4945.7018 & 5928.9915 & 0.4014 & 1 & 0.708 & 1 \tabularnewline
118 & 5750 & 5634.7663 & 5064.0686 & 6205.4639 & 0.3461 & 0.6783 & 0.79 & 1 \tabularnewline
119 & 5950 & 5708.0225 & 5103.5309 & 6312.5142 & 0.2163 & 0.4459 & 0.6958 & 1 \tabularnewline
120 & 5600 & 5493.1161 & 4868.1527 & 6118.0795 & 0.3687 & 0.0759 & 0.6732 & 1 \tabularnewline
121 & 6100 & 5615.8942 & 4975.5513 & 6256.237 & 0.0692 & 0.5194 & 0.6386 & 1 \tabularnewline
122 & 6250 & 5762.9681 & 5109.1901 & 6416.746 & 0.0721 & 0.1561 & 0.5155 & 1 \tabularnewline
123 & 6150 & 5739.1449 & 5072.9191 & 6405.3706 & 0.1134 & 0.0664 & 0.4873 & 1 \tabularnewline
124 & 6050 & 5727.2892 & 5049.1534 & 6405.425 & 0.1755 & 0.1109 & 0.5314 & 1 \tabularnewline
125 & 6300 & 5647.3602 & 4957.6549 & 6337.0656 & 0.0318 & 0.1263 & 0.3322 & 1 \tabularnewline
126 & 5950 & 5654.3928 & 4953.3674 & 6355.4182 & 0.2043 & 0.0355 & 0.342 & 1 \tabularnewline
\hline
\end{tabular}
%Source: https://freestatistics.org/blog/index.php?pk=301316&T=1

[TABLE]
[ROW][C]Univariate ARIMA Extrapolation Forecast[/C][/ROW]
[ROW][C]time[/C][C]Y[t][/C][C]F[t][/C][C]95% LB[/C][C]95% UB[/C][C]p-value(H0: Y[t] = F[t])[/C][C]P(F[t]>Y[t-1])[/C][C]P(F[t]>Y[t-s])[/C][C]P(F[t]>Y[116])[/C][/ROW]
[ROW][C]104[/C][C]3000[/C][C]-[/C][C]-[/C][C]-[/C][C]-[/C][C]-[/C][C]-[/C][C]-[/C][/ROW]
[ROW][C]105[/C][C]5300[/C][C]-[/C][C]-[/C][C]-[/C][C]-[/C][C]-[/C][C]-[/C][C]-[/C][/ROW]
[ROW][C]106[/C][C]5400[/C][C]-[/C][C]-[/C][C]-[/C][C]-[/C][C]-[/C][C]-[/C][C]-[/C][/ROW]
[ROW][C]107[/C][C]5550[/C][C]-[/C][C]-[/C][C]-[/C][C]-[/C][C]-[/C][C]-[/C][C]-[/C][/ROW]
[ROW][C]108[/C][C]5350[/C][C]-[/C][C]-[/C][C]-[/C][C]-[/C][C]-[/C][C]-[/C][C]-[/C][/ROW]
[ROW][C]109[/C][C]5500[/C][C]-[/C][C]-[/C][C]-[/C][C]-[/C][C]-[/C][C]-[/C][C]-[/C][/ROW]
[ROW][C]110[/C][C]5750[/C][C]-[/C][C]-[/C][C]-[/C][C]-[/C][C]-[/C][C]-[/C][C]-[/C][/ROW]
[ROW][C]111[/C][C]5750[/C][C]-[/C][C]-[/C][C]-[/C][C]-[/C][C]-[/C][C]-[/C][C]-[/C][/ROW]
[ROW][C]112[/C][C]5700[/C][C]-[/C][C]-[/C][C]-[/C][C]-[/C][C]-[/C][C]-[/C][C]-[/C][/ROW]
[ROW][C]113[/C][C]5800[/C][C]-[/C][C]-[/C][C]-[/C][C]-[/C][C]-[/C][C]-[/C][C]-[/C][/ROW]
[ROW][C]114[/C][C]5800[/C][C]-[/C][C]-[/C][C]-[/C][C]-[/C][C]-[/C][C]-[/C][C]-[/C][/ROW]
[ROW][C]115[/C][C]4600[/C][C]-[/C][C]-[/C][C]-[/C][C]-[/C][C]-[/C][C]-[/C][C]-[/C][/ROW]
[ROW][C]116[/C][C]3150[/C][C]-[/C][C]-[/C][C]-[/C][C]-[/C][C]-[/C][C]-[/C][C]-[/C][/ROW]
[ROW][C]117[/C][C]5500[/C][C]5437.3466[/C][C]4945.7018[/C][C]5928.9915[/C][C]0.4014[/C][C]1[/C][C]0.708[/C][C]1[/C][/ROW]
[ROW][C]118[/C][C]5750[/C][C]5634.7663[/C][C]5064.0686[/C][C]6205.4639[/C][C]0.3461[/C][C]0.6783[/C][C]0.79[/C][C]1[/C][/ROW]
[ROW][C]119[/C][C]5950[/C][C]5708.0225[/C][C]5103.5309[/C][C]6312.5142[/C][C]0.2163[/C][C]0.4459[/C][C]0.6958[/C][C]1[/C][/ROW]
[ROW][C]120[/C][C]5600[/C][C]5493.1161[/C][C]4868.1527[/C][C]6118.0795[/C][C]0.3687[/C][C]0.0759[/C][C]0.6732[/C][C]1[/C][/ROW]
[ROW][C]121[/C][C]6100[/C][C]5615.8942[/C][C]4975.5513[/C][C]6256.237[/C][C]0.0692[/C][C]0.5194[/C][C]0.6386[/C][C]1[/C][/ROW]
[ROW][C]122[/C][C]6250[/C][C]5762.9681[/C][C]5109.1901[/C][C]6416.746[/C][C]0.0721[/C][C]0.1561[/C][C]0.5155[/C][C]1[/C][/ROW]
[ROW][C]123[/C][C]6150[/C][C]5739.1449[/C][C]5072.9191[/C][C]6405.3706[/C][C]0.1134[/C][C]0.0664[/C][C]0.4873[/C][C]1[/C][/ROW]
[ROW][C]124[/C][C]6050[/C][C]5727.2892[/C][C]5049.1534[/C][C]6405.425[/C][C]0.1755[/C][C]0.1109[/C][C]0.5314[/C][C]1[/C][/ROW]
[ROW][C]125[/C][C]6300[/C][C]5647.3602[/C][C]4957.6549[/C][C]6337.0656[/C][C]0.0318[/C][C]0.1263[/C][C]0.3322[/C][C]1[/C][/ROW]
[ROW][C]126[/C][C]5950[/C][C]5654.3928[/C][C]4953.3674[/C][C]6355.4182[/C][C]0.2043[/C][C]0.0355[/C][C]0.342[/C][C]1[/C][/ROW]
[/TABLE]
Source: https://freestatistics.org/blog/index.php?pk=301316&T=1

Globally Unique Identifier (entire table): ba.freestatistics.org/blog/index.php?pk=301316&T=1

As an alternative you can also use a QR Code:  

The GUIDs for individual cells are displayed in the table below:

Univariate ARIMA Extrapolation Forecast
timeY[t]F[t]95% LB95% UBp-value(H0: Y[t] = F[t])P(F[t]>Y[t-1])P(F[t]>Y[t-s])P(F[t]>Y[116])
1043000-------
1055300-------
1065400-------
1075550-------
1085350-------
1095500-------
1105750-------
1115750-------
1125700-------
1135800-------
1145800-------
1154600-------
1163150-------
11755005437.34664945.70185928.99150.401410.7081
11857505634.76635064.06866205.46390.34610.67830.791
11959505708.02255103.53096312.51420.21630.44590.69581
12056005493.11614868.15276118.07950.36870.07590.67321
12161005615.89424975.55136256.2370.06920.51940.63861
12262505762.96815109.19016416.7460.07210.15610.51551
12361505739.14495072.91916405.37060.11340.06640.48731
12460505727.28925049.15346405.4250.17550.11090.53141
12563005647.36024957.65496337.06560.03180.12630.33221
12659505654.39284953.36746355.41820.20430.03550.3421


Univariate ARIMA Extrapolation Forecast Performance
time% S.E.PEMAPEsMAPESq.EMSERMSEScaledEMASE
1170.04610.01140.01140.01153925.4423000.25060.2506
1180.05170.020.01570.015913278.81388602.128192.74770.46090.3558
1190.0540.04070.0240.024458553.089825252.4486158.91020.96790.5598
1200.0580.01910.02280.023111424.175921795.3805147.63260.42750.5267
1210.05820.07940.03410.035234358.45164307.9946253.59021.93640.8087
1220.05790.07790.04140.0427237200.106693123.3466305.16121.94810.9986
1230.05920.06680.0450.0465168801.924103934.5719322.38891.64341.0907
1240.06040.05330.04610.0475104142.2641103960.5334322.42911.29081.1157
1250.06230.10360.05250.0544425938.678139735.8828373.81262.61061.2818
1260.06330.04970.05220.05487383.6206134500.6566366.74331.18241.2719

\begin{tabular}{lllllllll}
\hline
Univariate ARIMA Extrapolation Forecast Performance \tabularnewline
time & % S.E. & PE & MAPE & sMAPE & Sq.E & MSE & RMSE & ScaledE & MASE \tabularnewline
117 & 0.0461 & 0.0114 & 0.0114 & 0.0115 & 3925.4423 & 0 & 0 & 0.2506 & 0.2506 \tabularnewline
118 & 0.0517 & 0.02 & 0.0157 & 0.0159 & 13278.8138 & 8602.1281 & 92.7477 & 0.4609 & 0.3558 \tabularnewline
119 & 0.054 & 0.0407 & 0.024 & 0.0244 & 58553.0898 & 25252.4486 & 158.9102 & 0.9679 & 0.5598 \tabularnewline
120 & 0.058 & 0.0191 & 0.0228 & 0.0231 & 11424.1759 & 21795.3805 & 147.6326 & 0.4275 & 0.5267 \tabularnewline
121 & 0.0582 & 0.0794 & 0.0341 & 0.035 & 234358.451 & 64307.9946 & 253.5902 & 1.9364 & 0.8087 \tabularnewline
122 & 0.0579 & 0.0779 & 0.0414 & 0.0427 & 237200.1066 & 93123.3466 & 305.1612 & 1.9481 & 0.9986 \tabularnewline
123 & 0.0592 & 0.0668 & 0.045 & 0.0465 & 168801.924 & 103934.5719 & 322.3889 & 1.6434 & 1.0907 \tabularnewline
124 & 0.0604 & 0.0533 & 0.0461 & 0.0475 & 104142.2641 & 103960.5334 & 322.4291 & 1.2908 & 1.1157 \tabularnewline
125 & 0.0623 & 0.1036 & 0.0525 & 0.0544 & 425938.678 & 139735.8828 & 373.8126 & 2.6106 & 1.2818 \tabularnewline
126 & 0.0633 & 0.0497 & 0.0522 & 0.054 & 87383.6206 & 134500.6566 & 366.7433 & 1.1824 & 1.2719 \tabularnewline
\hline
\end{tabular}
%Source: https://freestatistics.org/blog/index.php?pk=301316&T=2

[TABLE]
[ROW][C]Univariate ARIMA Extrapolation Forecast Performance[/C][/ROW]
[ROW][C]time[/C][C]% S.E.[/C][C]PE[/C][C]MAPE[/C][C]sMAPE[/C][C]Sq.E[/C][C]MSE[/C][C]RMSE[/C][C]ScaledE[/C][C]MASE[/C][/ROW]
[ROW][C]117[/C][C]0.0461[/C][C]0.0114[/C][C]0.0114[/C][C]0.0115[/C][C]3925.4423[/C][C]0[/C][C]0[/C][C]0.2506[/C][C]0.2506[/C][/ROW]
[ROW][C]118[/C][C]0.0517[/C][C]0.02[/C][C]0.0157[/C][C]0.0159[/C][C]13278.8138[/C][C]8602.1281[/C][C]92.7477[/C][C]0.4609[/C][C]0.3558[/C][/ROW]
[ROW][C]119[/C][C]0.054[/C][C]0.0407[/C][C]0.024[/C][C]0.0244[/C][C]58553.0898[/C][C]25252.4486[/C][C]158.9102[/C][C]0.9679[/C][C]0.5598[/C][/ROW]
[ROW][C]120[/C][C]0.058[/C][C]0.0191[/C][C]0.0228[/C][C]0.0231[/C][C]11424.1759[/C][C]21795.3805[/C][C]147.6326[/C][C]0.4275[/C][C]0.5267[/C][/ROW]
[ROW][C]121[/C][C]0.0582[/C][C]0.0794[/C][C]0.0341[/C][C]0.035[/C][C]234358.451[/C][C]64307.9946[/C][C]253.5902[/C][C]1.9364[/C][C]0.8087[/C][/ROW]
[ROW][C]122[/C][C]0.0579[/C][C]0.0779[/C][C]0.0414[/C][C]0.0427[/C][C]237200.1066[/C][C]93123.3466[/C][C]305.1612[/C][C]1.9481[/C][C]0.9986[/C][/ROW]
[ROW][C]123[/C][C]0.0592[/C][C]0.0668[/C][C]0.045[/C][C]0.0465[/C][C]168801.924[/C][C]103934.5719[/C][C]322.3889[/C][C]1.6434[/C][C]1.0907[/C][/ROW]
[ROW][C]124[/C][C]0.0604[/C][C]0.0533[/C][C]0.0461[/C][C]0.0475[/C][C]104142.2641[/C][C]103960.5334[/C][C]322.4291[/C][C]1.2908[/C][C]1.1157[/C][/ROW]
[ROW][C]125[/C][C]0.0623[/C][C]0.1036[/C][C]0.0525[/C][C]0.0544[/C][C]425938.678[/C][C]139735.8828[/C][C]373.8126[/C][C]2.6106[/C][C]1.2818[/C][/ROW]
[ROW][C]126[/C][C]0.0633[/C][C]0.0497[/C][C]0.0522[/C][C]0.054[/C][C]87383.6206[/C][C]134500.6566[/C][C]366.7433[/C][C]1.1824[/C][C]1.2719[/C][/ROW]
[/TABLE]
Source: https://freestatistics.org/blog/index.php?pk=301316&T=2

Globally Unique Identifier (entire table): ba.freestatistics.org/blog/index.php?pk=301316&T=2

As an alternative you can also use a QR Code:  

The GUIDs for individual cells are displayed in the table below:

Univariate ARIMA Extrapolation Forecast Performance
time% S.E.PEMAPEsMAPESq.EMSERMSEScaledEMASE
1170.04610.01140.01140.01153925.4423000.25060.2506
1180.05170.020.01570.015913278.81388602.128192.74770.46090.3558
1190.0540.04070.0240.024458553.089825252.4486158.91020.96790.5598
1200.0580.01910.02280.023111424.175921795.3805147.63260.42750.5267
1210.05820.07940.03410.035234358.45164307.9946253.59021.93640.8087
1220.05790.07790.04140.0427237200.106693123.3466305.16121.94810.9986
1230.05920.06680.0450.0465168801.924103934.5719322.38891.64341.0907
1240.06040.05330.04610.0475104142.2641103960.5334322.42911.29081.1157
1250.06230.10360.05250.0544425938.678139735.8828373.81262.61061.2818
1260.06330.04970.05220.05487383.6206134500.6566366.74331.18241.2719


Parameters (Session):
par1 = 12 ; par2 = Single ; par3 = additive ; par4 = 18 ;
Parameters (R input):
par1 = 10 ; par2 = 1 ; par3 = 1 ; par4 = 1 ; par5 = 12 ; par6 = 1 ; par7 = 1 ; par8 = 0 ; par9 = 1 ; par10 = FALSE ;
R code (references can be found in the software module):
par1 <- as.numeric(par1) #cut off periods
par2 <- as.numeric(par2) #lambda
par3 <- as.numeric(par3) #degree of non-seasonal differencing
par4 <- as.numeric(par4) #degree of seasonal differencing
par5 <- as.numeric(par5) #seasonal period
par6 <- as.numeric(par6) #p
par7 <- as.numeric(par7) #q
par8 <- as.numeric(par8) #P
par9 <- as.numeric(par9) #Q
if (par10 == 'TRUE') par10 <- TRUE
if (par10 == 'FALSE') par10 <- FALSE
if (par2 == 0) x <- log(x)
if (par2 != 0) x <- x^par2
lx <- length(x)
first <- lx - 2*par1
nx <- lx - par1
nx1 <- nx + 1
fx <- lx - nx
if (fx < 1) {
fx <- par5*2
nx1 <- lx + fx - 1
first <- lx - 2*fx
}
first <- 1
if (fx < 3) fx <- round(lx/10,0)
(arima.out <- arima(x[1:nx], order=c(par6,par3,par7), seasonal=list(order=c(par8,par4,par9), period=par5), include.mean=par10, method='ML'))
(forecast <- predict(arima.out,fx))
(lb <- forecast$pred - 1.96 * forecast$se)
(ub <- forecast$pred + 1.96 * forecast$se)
if (par2 == 0) {
x <- exp(x)
forecast$pred <- exp(forecast$pred)
lb <- exp(lb)
ub <- exp(ub)
}
if (par2 != 0) {
x <- x^(1/par2)
forecast$pred <- forecast$pred^(1/par2)
lb <- lb^(1/par2)
ub <- ub^(1/par2)
}
if (par2 < 0) {
olb <- lb
lb <- ub
ub <- olb
}
(actandfor <- c(x[1:nx], forecast$pred))
(perc.se <- (ub-forecast$pred)/1.96/forecast$pred)
bitmap(file='test1.png')
opar <- par(mar=c(4,4,2,2),las=1)
ylim <- c( min(x[first:nx],lb), max(x[first:nx],ub))
plot(x,ylim=ylim,type='n',xlim=c(first,lx))
usr <- par('usr')
rect(usr[1],usr[3],nx+1,usr[4],border=NA,col='lemonchiffon')
rect(nx1,usr[3],usr[2],usr[4],border=NA,col='lavender')
abline(h= (-3:3)*2 , col ='gray', lty =3)
polygon( c(nx1:lx,lx:nx1), c(lb,rev(ub)), col = 'orange', lty=2,border=NA)
lines(nx1:lx, lb , lty=2)
lines(nx1:lx, ub , lty=2)
lines(x, lwd=2)
lines(nx1:lx, forecast$pred , lwd=2 , col ='white')
box()
par(opar)
dev.off()
prob.dec <- array(NA, dim=fx)
prob.sdec <- array(NA, dim=fx)
prob.ldec <- array(NA, dim=fx)
prob.pval <- array(NA, dim=fx)
perf.pe <- array(0, dim=fx)
perf.spe <- array(0, dim=fx)
perf.scalederr <- array(0, dim=fx)
perf.mase <- array(0, dim=fx)
perf.mase1 <- array(0, dim=fx)
perf.mape <- array(0, dim=fx)
perf.smape <- array(0, dim=fx)
perf.mape1 <- array(0, dim=fx)
perf.smape1 <- array(0,dim=fx)
perf.se <- array(0, dim=fx)
perf.mse <- array(0, dim=fx)
perf.mse1 <- array(0, dim=fx)
perf.rmse <- array(0, dim=fx)
perf.scaleddenom <- 0
for (i in 2:fx) {
perf.scaleddenom = perf.scaleddenom + abs(x[nx+i] - x[nx+i-1])
}
perf.scaleddenom = perf.scaleddenom / (fx-1)
for (i in 1:fx) {
locSD <- (ub[i] - forecast$pred[i]) / 1.96
perf.scalederr[i] = (x[nx+i] - forecast$pred[i]) / perf.scaleddenom
perf.pe[i] = (x[nx+i] - forecast$pred[i]) / x[nx+i]
perf.spe[i] = 2*(x[nx+i] - forecast$pred[i]) / (x[nx+i] + forecast$pred[i])
perf.se[i] = (x[nx+i] - forecast$pred[i])^2
prob.dec[i] = pnorm((x[nx+i-1] - forecast$pred[i]) / locSD)
prob.sdec[i] = pnorm((x[nx+i-par5] - forecast$pred[i]) / locSD)
prob.ldec[i] = pnorm((x[nx] - forecast$pred[i]) / locSD)
prob.pval[i] = pnorm(abs(x[nx+i] - forecast$pred[i]) / locSD)
}
perf.mape[1] = abs(perf.pe[1])
perf.smape[1] = abs(perf.spe[1])
perf.mape1[1] = perf.mape[1]
perf.smape1[1] = perf.smape[1]
perf.mse[1] = perf.se[1]
perf.mase[1] = abs(perf.scalederr[1])
perf.mase1[1] = perf.mase[1]
for (i in 2:fx) {
perf.mape[i] = perf.mape[i-1] + abs(perf.pe[i])
perf.mape1[i] = perf.mape[i] / i
perf.smape[i] = perf.smape[i-1] + abs(perf.spe[i])
perf.smape1[i] = perf.smape[i] / i
perf.mse[i] = perf.mse[i-1] + perf.se[i]
perf.mse1[i] = perf.mse[i] / i
perf.mase[i] = perf.mase[i-1] + abs(perf.scalederr[i])
perf.mase1[i] = perf.mase[i] / i
}
perf.rmse = sqrt(perf.mse1)
bitmap(file='test2.png')
plot(forecast$pred, pch=19, type='b',main='ARIMA Extrapolation Forecast', ylab='Forecast and 95% CI', xlab='time',ylim=c(min(lb),max(ub)))
dum <- forecast$pred
dum[1:par1] <- x[(nx+1):lx]
lines(dum, lty=1)
lines(ub,lty=3)
lines(lb,lty=3)
dev.off()
load(file='createtable')
a<-table.start()
a<-table.row.start(a)
a<-table.element(a,'Univariate ARIMA Extrapolation Forecast',9,TRUE)
a<-table.row.end(a)
a<-table.row.start(a)
a<-table.element(a,'time',1,header=TRUE)
a<-table.element(a,'Y[t]',1,header=TRUE)
a<-table.element(a,'F[t]',1,header=TRUE)
a<-table.element(a,'95% LB',1,header=TRUE)
a<-table.element(a,'95% UB',1,header=TRUE)
a<-table.element(a,'p-value
(H0: Y[t] = F[t])',1,header=TRUE)
a<-table.element(a,'P(F[t]>Y[t-1])',1,header=TRUE)
a<-table.element(a,'P(F[t]>Y[t-s])',1,header=TRUE)
mylab <- paste('P(F[t]>Y[',nx,sep='')
mylab <- paste(mylab,'])',sep='')
a<-table.element(a,mylab,1,header=TRUE)
a<-table.row.end(a)
for (i in (nx-par5):nx) {
a<-table.row.start(a)
a<-table.element(a,i,header=TRUE)
a<-table.element(a,x[i])
a<-table.element(a,'-')
a<-table.row.end(a)
}
for (i in 1:fx) {
a<-table.row.start(a)
a<-table.element(a,nx+i,header=TRUE)
a<-table.element(a,round(x[nx+i],4))
a<-table.element(a,round(forecast$pred[i],4))
a<-table.element(a,round(lb[i],4))
a<-table.element(a,round(ub[i],4))
a<-table.element(a,round((1-prob.pval[i]),4))
a<-table.element(a,round((1-prob.dec[i]),4))
a<-table.element(a,round((1-prob.sdec[i]),4))
a<-table.element(a,round((1-prob.ldec[i]),4))
a<-table.row.end(a)
}
a<-table.end(a)
table.save(a,file='mytable.tab')
a<-table.start()
a<-table.row.start(a)
a<-table.element(a,'Univariate ARIMA Extrapolation Forecast Performance',10,TRUE)
a<-table.row.end(a)
a<-table.row.start(a)
a<-table.element(a,'time',1,header=TRUE)
a<-table.element(a,'% S.E.',1,header=TRUE)
a<-table.element(a,'PE',1,header=TRUE)
a<-table.element(a,'MAPE',1,header=TRUE)
a<-table.element(a,'sMAPE',1,header=TRUE)
a<-table.element(a,'Sq.E',1,header=TRUE)
a<-table.element(a,'MSE',1,header=TRUE)
a<-table.element(a,'RMSE',1,header=TRUE)
a<-table.element(a,'ScaledE',1,header=TRUE)
a<-table.element(a,'MASE',1,header=TRUE)
a<-table.row.end(a)
for (i in 1:fx) {
a<-table.row.start(a)
a<-table.element(a,nx+i,header=TRUE)
a<-table.element(a,round(perc.se[i],4))
a<-table.element(a,round(perf.pe[i],4))
a<-table.element(a,round(perf.mape1[i],4))
a<-table.element(a,round(perf.smape1[i],4))
a<-table.element(a,round(perf.se[i],4))
a<-table.element(a,round(perf.mse1[i],4))
a<-table.element(a,round(perf.rmse[i],4))
a<-table.element(a,round(perf.scalederr[i],4))
a<-table.element(a,round(perf.mase1[i],4))
a<-table.row.end(a)
}
a<-table.end(a)
table.save(a,file='mytable1.tab')